Effect of N-Acetylcysteine Oral Administration on Cutaneous Wound Healing
Effect of N-Acetylcysteine Oral Administration on Cutaneous Wound Healing
Nida Sadaqat1, Sheheyar Ahmed Khan1, Amna Bibi1, Sadaf Zahra1, Muhammad faisal Salamt1, Noreen Latief2 and Fatima Ali1*
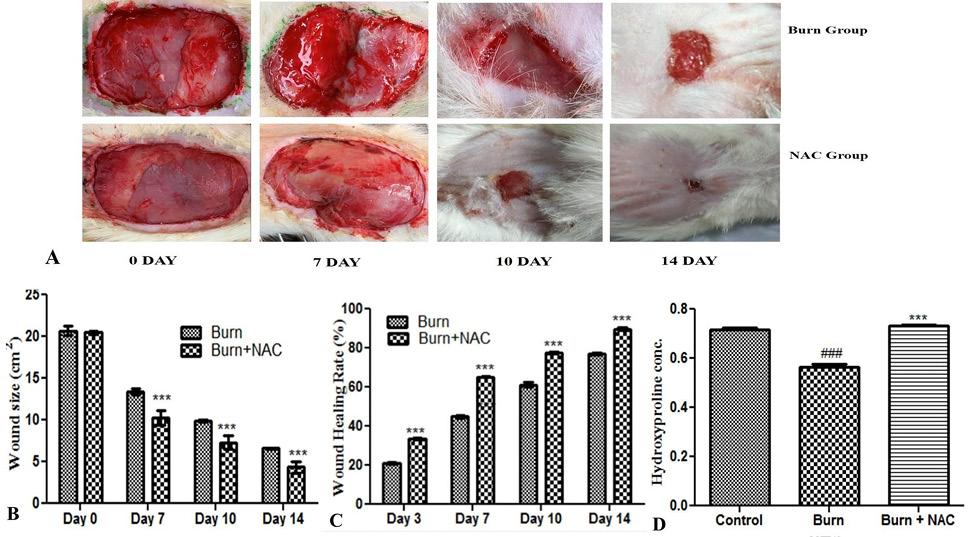
Effect of NAC on wound healing. (A) Wound contraction area in burn, and burn + NAC group. Wound appearance following 14 days of treatment with NAC. (B-C) Wound healing area and wound healing rate. (D) Effects of NAC on hydroxyproline levels in the burn wound model. Control versus burn group, #P < 0.05; ##P < 0.01; and ###P < 0.001; Control versus Burn+NAC group, ΦP < 0.05; ΦΦP < 0.01; and ΦΦΦP < 0.001; Burn versus Burn+NAC group, *P < 0.05; **P < 0.01; and ***P < 0.001.
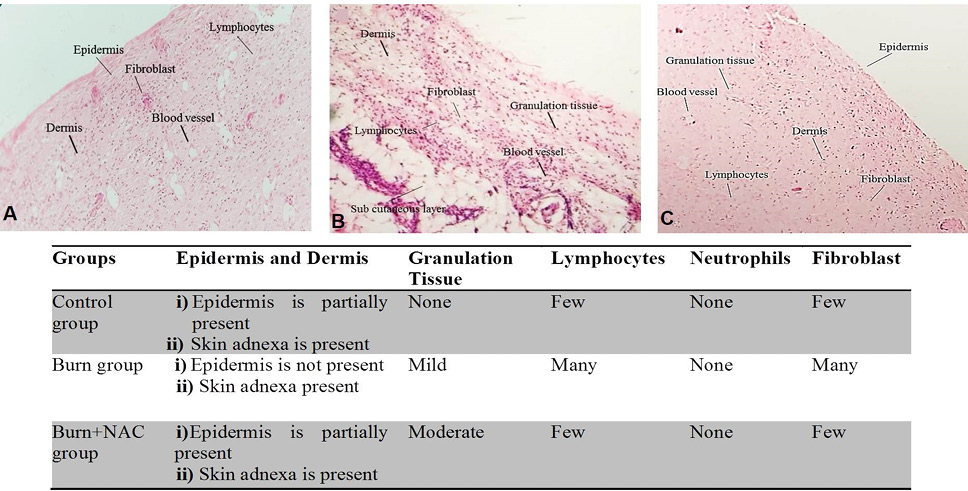
Histological examination of skin tissue. A, Control group; B, Burn group; C, Burn+NAC group; D, Summary of histological of features of wound healing.
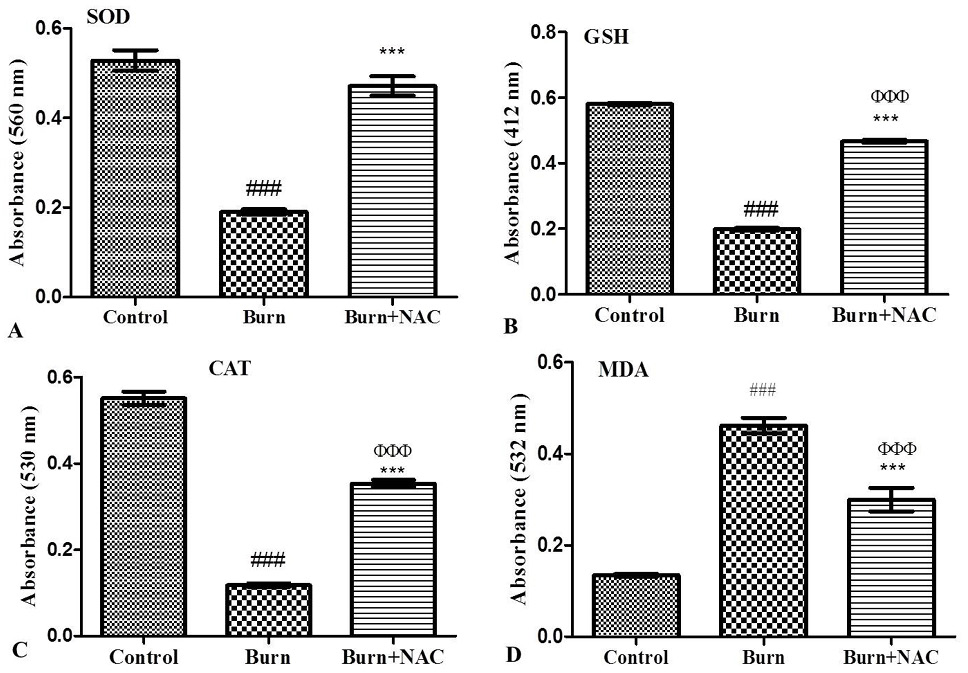
Assessment of oxidative stress markers in treatment groups. A, Superoxide dismutase (SOD); B, Reduced glutathione (GSH); C, Catalase (CAT); D, Malondialdehyde (MD A). Error bars represent ± standard error of mean (SEM). Control versus burn group, #P < 0.05; ##P < 0.01; and ###P < 0.001; Control versus Burn+NAC group, ΦP < 0.05; ΦΦP < 0.01; and ΦΦΦP < 0.001; Burn versus Burn+NAC group, *P < 0.05; **P < 0.01; and ***P < 0.001.
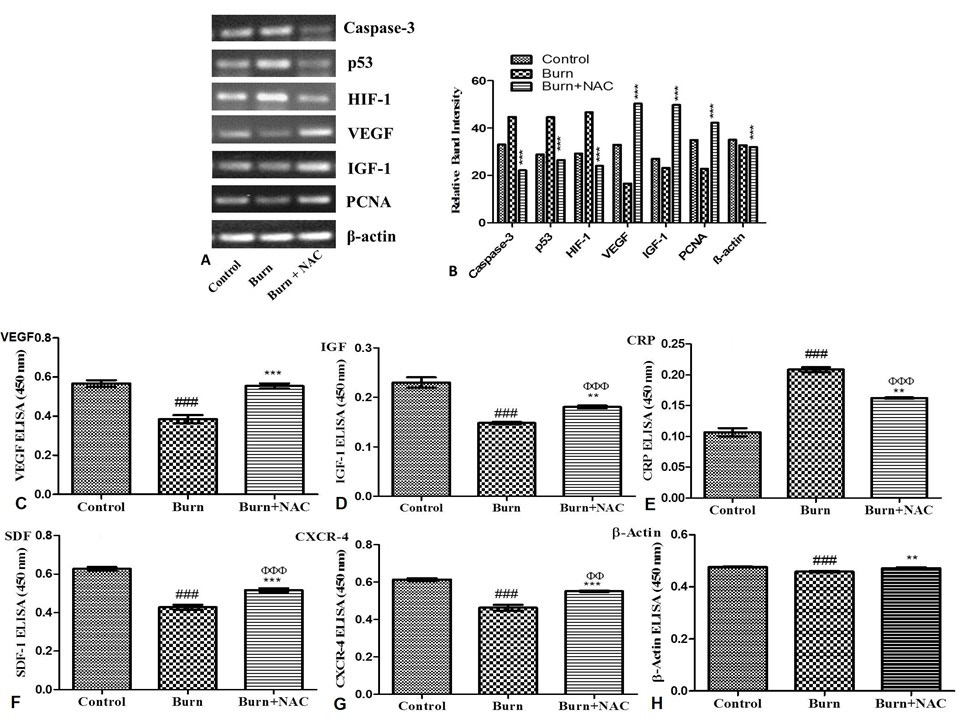
Effect of NAC on gene-expression analysis of rats inflicted with burn injury. Gene expression of skin preconditioned with NAC groups compared with control and Burn group along with corresponding quantification. Error bars represent ± standard error of mean (SEM). Control versus burn group, #P < 0.05; ##P < 0.01; and ###P < 0.001; Control versus Burn+NAC group, ΦP < 0.05; ΦΦP < 0.01; and ΦΦΦP < 0.001; Burn versus Burn+NAC group, *P < 0.05; **P < 0.01; and ***P < 0.001.


