
Effect of Low Level Laser Therapy on Diabetic Experimental Animals


Effect of Low Level Laser Therapy on Diabetic Experimental Animals
Rana A. Ali1, Abd-Elraheim A. Elshater2, Heba A. Mohammed3*, Mahmoud Elshazly4


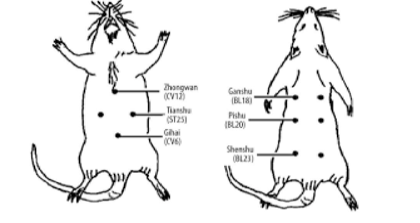
Distribution of acupoints in the rat. In 6 acupoints, 3 points distributed on the ventral side (zhongwan, tianshu, and qihai points) are shown in the left-hand side, and 3 points distributed on the dorsal side (ganshu, pishu, and shenshu points) are shown in the right-hand side (each point is shown by a filled-in circle).

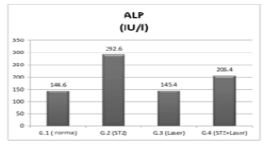
Effect of exposure to laser beam (15 session), for 30 days on serum ALP (IU/L), on diabetic rats induced by single dose of STZ 45 mg/kg b.wt.
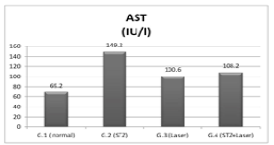
Effect of exposure to laser beam (15 session), for 30 days on serum AST (IU/L) on diabetic rats induced by single dose of STZ 45 mg/kg b.wt.
Effect of exposure to laser beam (15 session), for 30 days on serum AST (IU/L) on diabetic rats induced by single dose of STZ 45 mg/kg b.wt.

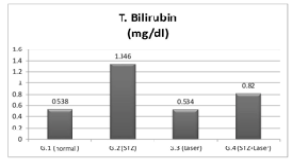
Effect of exposure to laser beam (15 session), for 30 days on serum T. bilirubin (IU/L) on diabetic rats induced by single dose of STZ 45 mg/kg b.wt.
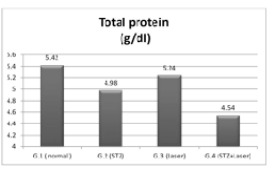
Effect of exposure to laser beam (15 session), for 30 days on serum total protein (gm/dl), on diabetic rats induced by single dose of STZ 45 mg/kg b.wt..

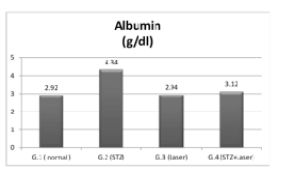
Effect of exposure to laser beam (15 session), for 30 days on serum albumin (gm/dl) on diabetic rats induced by single dose of STZ 45 mg/kg b.wt

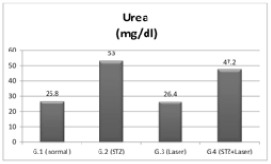
Effect of exposure to laser beam (15 session), for 30 days on serum Urea (mg/dl) on diabetic rats induced by single dose of STZ 45 mg/kg b.wt.
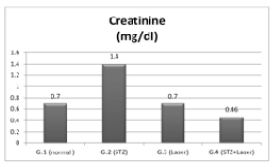
Effect of exposure to laser beam (15 session), for 30 days on serum Creatinine (mg/dl) on diabetic rats induced by single dose of STZ 45 mg/kg b.wt.

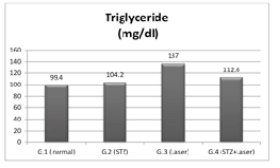
Effect of exposure to laser beam (15 session), for 30 days on serum Triglyceride (mg/dl) on diabetic rats induced by single dose of STZ (45 mg/kg b.wt.).

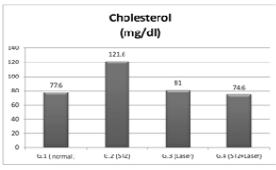
Effect of exposure to laser beam (15 session), for 30 days on serum Cholesterol (mg/dl) on diabetic rats induced by single dose of STZ (45 mg/kg b.w.)
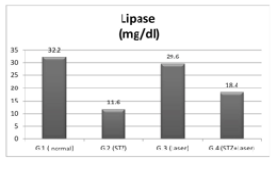
Effect of exposure to laser beam (15 session), for 30 days on serum Lipase (U/L) on diabetic rats induced by single dose of STZ (45 mg/kg b.wt.)

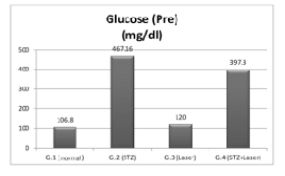
Glucose levels in groups before treatment with laser sessions (15 sessions) for day 30

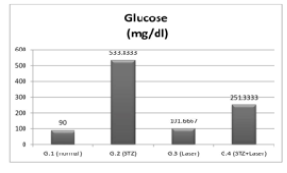
Effect of exposure to laser beam (15 session), for 30 days on serum glucose (mg/dl), on diabetic rats induced by single dose of STZ 45 mg/kg b.wt.

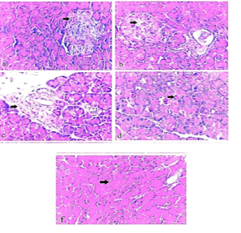
Photomicrograph of comparative figure of The normal group (group 1) showed a normal histological structure of the pancreas (Fig. 15a). The pancreas of diabetic control (group 2) showed severe necrosis and vacuolation of B-cells of Langerhans (Fig. 15 b), with extensive dilatation and congestion with inflammatory edoema (Fig. 15 c). The pancreas of group 3 showed haemorrhage with RBCs infiltration (Fig. 15 d). The pancreas of group 4 showed necrosis and vacuolation of pancreatic acini (Fig.15 e). (H&E., X 400).
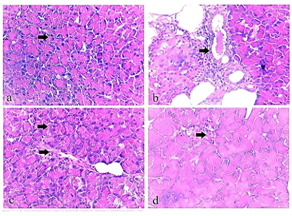
Photomicrograph of comparative figure of the normal group showed normal architecture of the pancreas (Fig. 16 a). The pancreas of group 2 showed severe congestion and thickening of blood vessels with inflammatory edoema (Fig. 16 b). The pancreas of group 3 showed haemorrhage with RBCs infiltration and mild congestion of blood vessels (Fig. 16 c). The pancreas of group 4 showed minimal vacuolation of pancreatic islets (Fig. 16 d).


