Effect of Drying Temperature on Bioactive Compound Content of Red Onion Using Photovoltaic Ventilation Solar Dryers
Effect of Drying Temperature on Bioactive Compound Content of Red Onion Using Photovoltaic Ventilation Solar Dryers
Suherman Suherman1*, Muhammad Fahri Rizky1, Zaki Bahrul Fikri1, Hadiyanto Hadiyanto1, Zane Vincevica-Gaile2, Anwar Saeed Khan3, Erkata Yandri4,5 and Iswahyudi Iswahyudi6
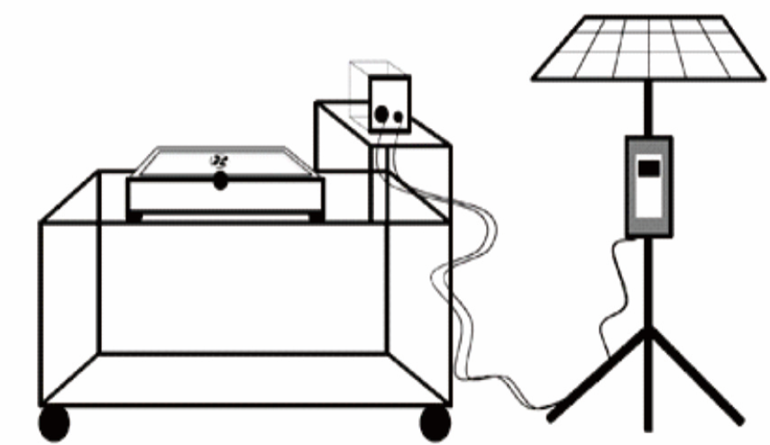
Photovoltaic ventilation solar dryer schematic diagram.
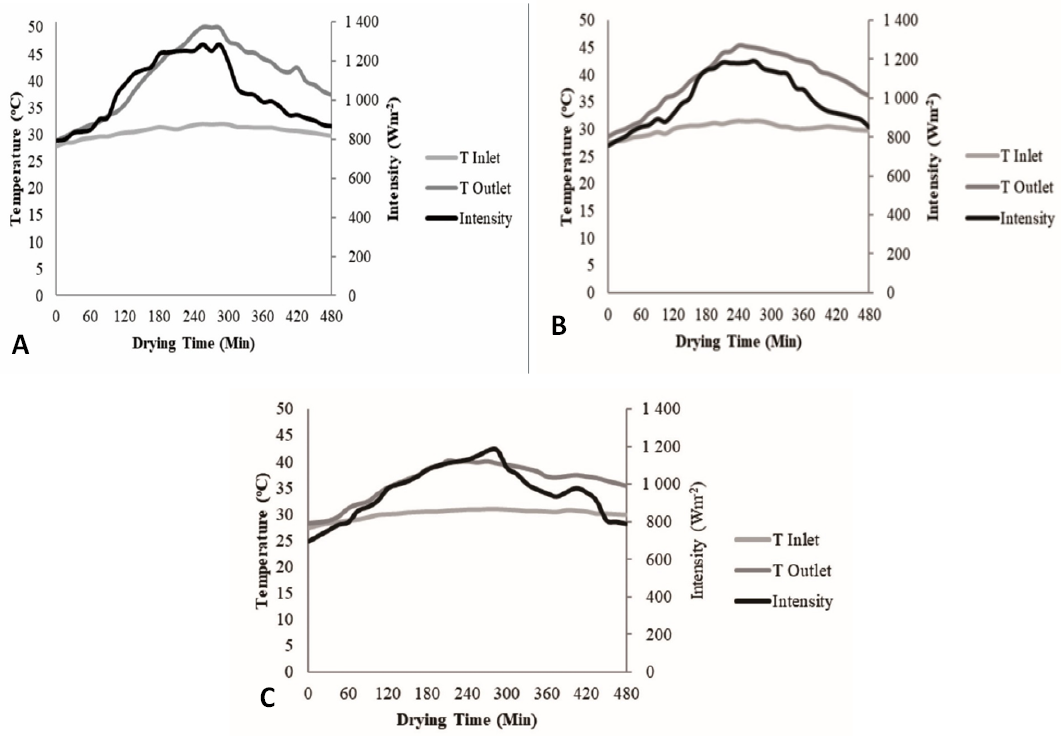
Temperature and intensity profiles on various variables (a) 50 oC, (b) 45oC, (c) 40 oC, (d) traditional.
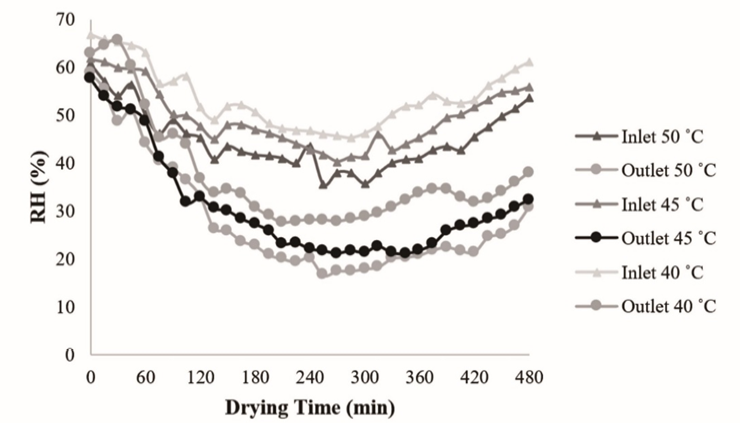
Relative humidity on various variables.
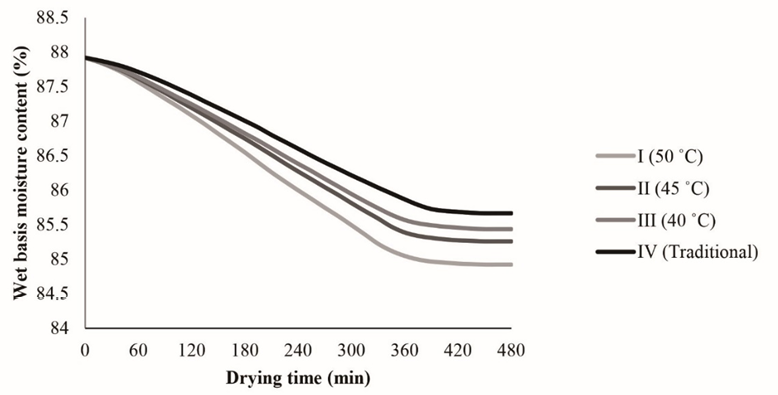
Wet basis moisture content profile on various variables (I) 50 oC, (II) 45 oC (III) 40 oC, (IV) traditional.
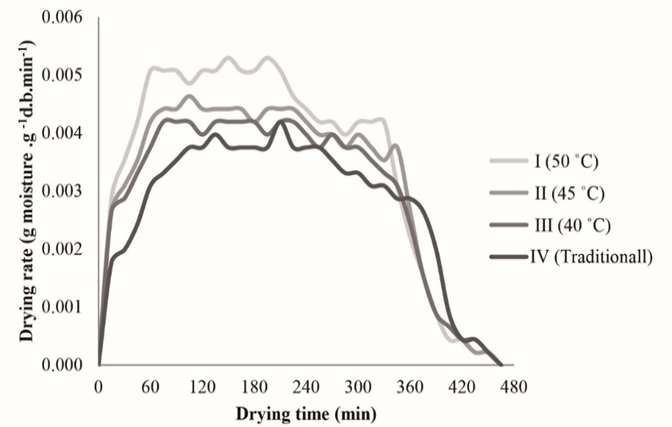
Drying rate profile on various variables (I) 50 oC, (II) 45 °C, (III) 40 oC, (IV) traditional.
Temperature and intensity profile variable.
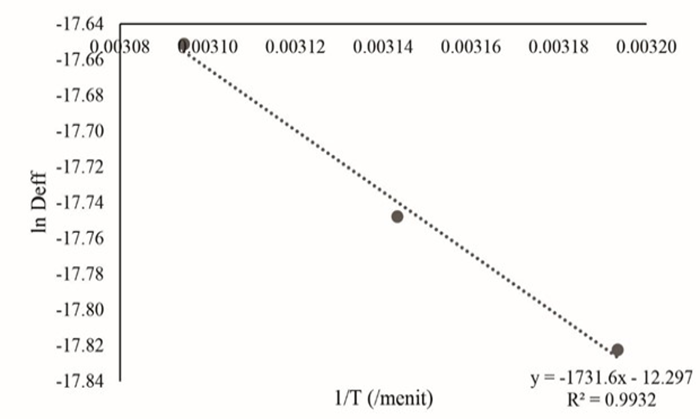
Data plotting ln Deff vs (1/T).
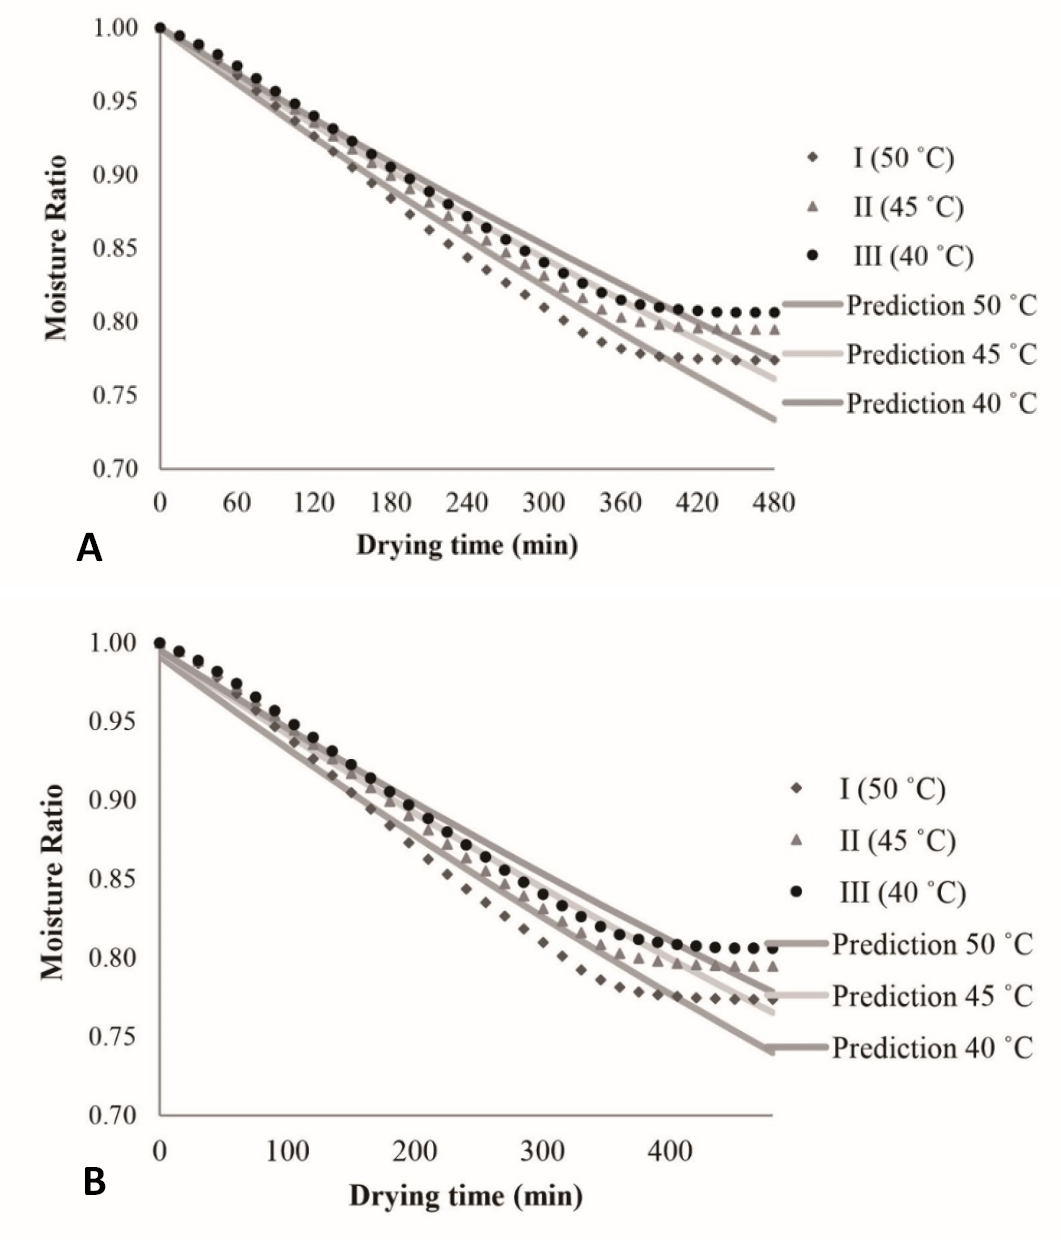
Graph of the difference between the observed value and the predicted value of variable I on various variables. (A) Lewis model, (B) Henderson and Pabis model.


