

2,4 -Dinitrophenol Trans-Differentiate NIH3T3 Cells into Insulin Producing β-Cells


2,4 -Dinitrophenol Trans-Differentiate NIH3T3 Cells into Insulin Producing β-Cells
Shumaila Usman1,2, Irfan Khan2, Kanwal Haneef3 and Asmat Salim2*
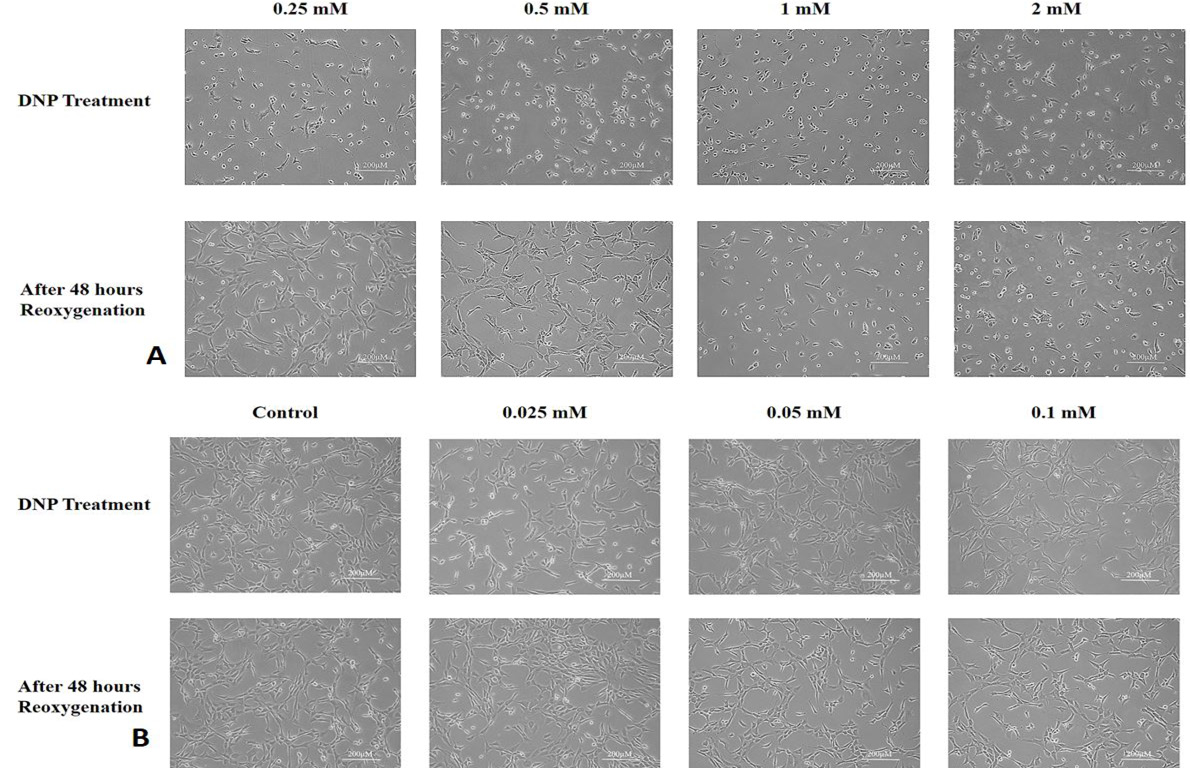
Morphology of NIH3T3 cells after DNP treatment. NIH3T3 cells treated with different concentrations of DNP (0.025 mM – 2 mM) for 20 min were round and shrunken. After 48 h of reoxygenation, cells regained normal morphology except in case of 1 mM and 2 mM concentrations in which most of the cells died (Fig. 1A-B). Images were taken at 10X magnification under inverted phase contrast microscope.
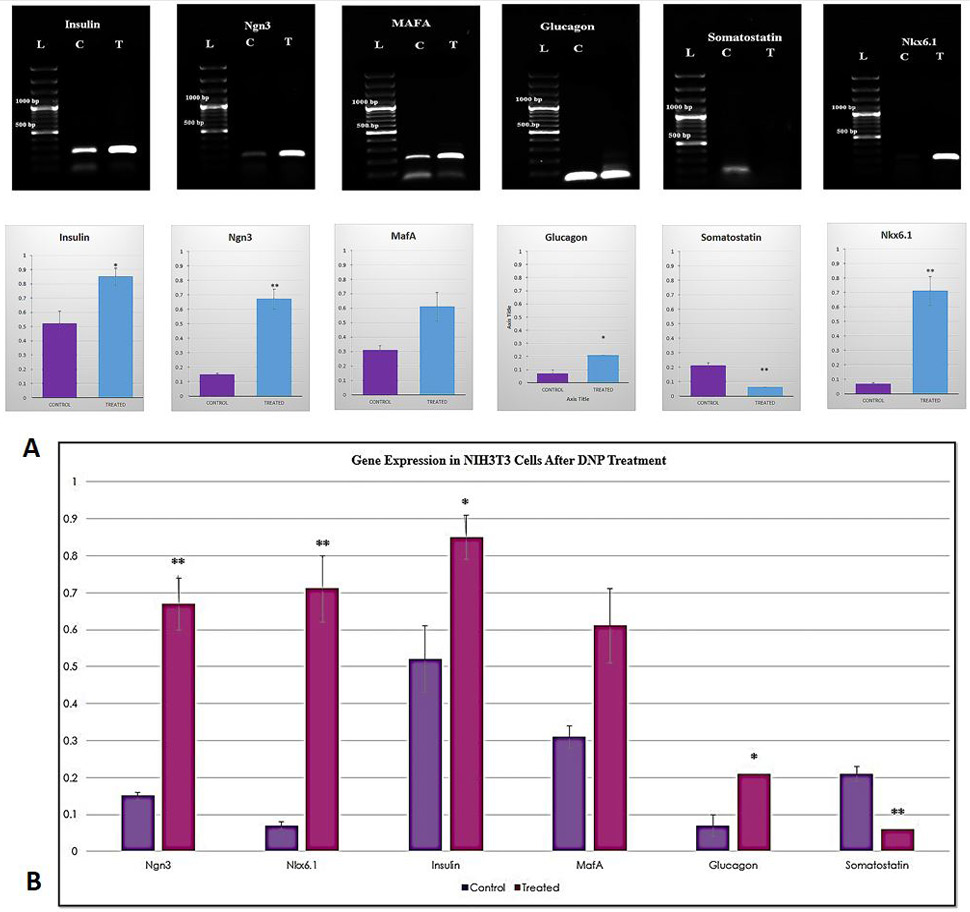
RT-PCR analysis of pancreatic genes in NIH3T3 cells after DNP treatment. Expression levels of insulin, Ngn3, MafA, Nkx6.1 and somatostatin in NIH3T3 cells before and after DNP treatment. Graphical representation is also shown. Ngn3, Nkx 6.1, insulin, and glucagon expression was significantly increased (p < 0.01, p < 0.01, p < 0.05 and p < 0.05, respectively) while that of somatostatin was significantly decreased (p<0.001) after DNP treatment. No significant change was observed in MafA expression after DNP treatment (Fig. 2A). Combined graphical representation of pancreatic gene expression in untreated and DNP treated groups is also shown (Fig. 2B). Data is presented as mean ± S.E.M; level of significance is p < 0.05; (where *** = p < 0.001, ** = p < 0.01, and * = p < 0.05.
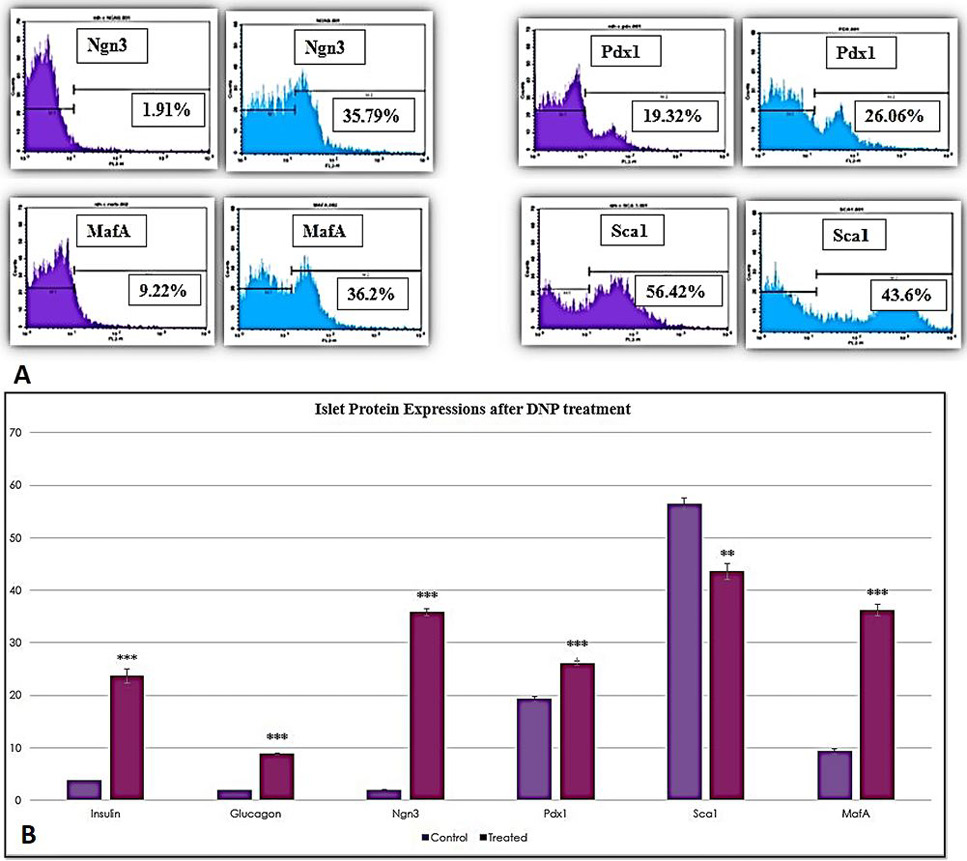
Flow cytometric analysis of pancreatic proteins in NIH3T3 cells after DNP treatment: pancreatic proteins, MafA, Pdx1, insulin, glucagon, Ngn3 and Sca1 were analyzed in NIH3T3 cells before and after treatment with DNP. Cells labelled with Alexa fluor 546 goat anti-mouse or anti-rabbit secondary antibodies were used as controls (Fig. 3A). Number of positive cells are shown as percentage of untreated cells. Significant increase (p<0.001) in insulin, glucagon, MafA, Ngn3 and Pdx1 expressions was observed after DNP treatment (Fig. 3B). Data is presented as mean ± S.E.M.; level of significance is p < 0.05; where *** = p < 0.001, ** = p < 0.01, and * = p < 0.05.


