

Cry2Aa Delta-Endotoxin Confers Strong Resistance Against Brinjal Fruit and Shoot Borer in Transgenic Brinjal (Solanum melongena L.) Plants


Cry2Aa Delta-Endotoxin Confers Strong Resistance Against Brinjal Fruit and Shoot Borer in Transgenic Brinjal (Solanum melongena L.) Plants
Shruti Yadav1,2*, Kamana Singh2, Pratap Adinath Divekar3 and Suhas Gorakh Karkute1,3*
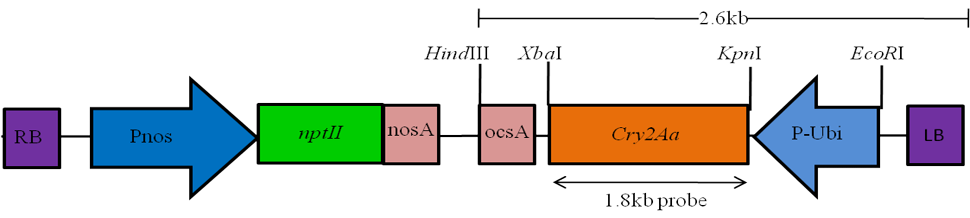
The T-DNA map of binary vector pBinAR-cry2Aa. LB: left border; RB: right border; P-potato: Potato ubiquitin promoter; OCS Ter: terminator sequence of octopine synthase; NOS: nopaline synthase promoter; nptII: neomycin phosphotransferase; and Nos Ter: terminator sequence of nopaline synthase.
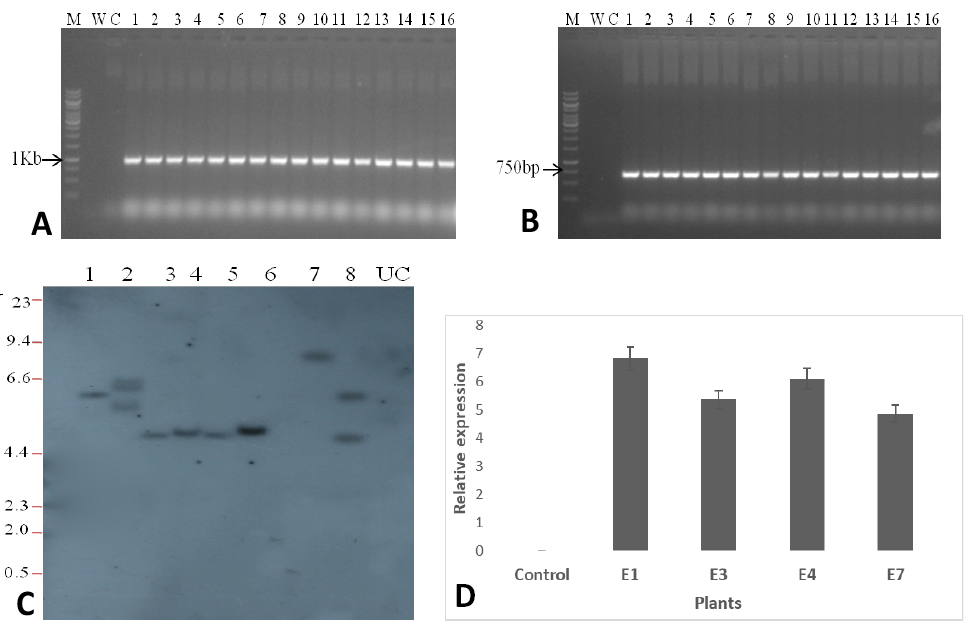
Molecular confirmation and expression analysis of cry2Aa in transgenic brinjal plants. PCR amplification of the cry2Aa (A) and nptII gene (B) from genomic DNA of putative transgenic plants (T0). Lanes: M1, 1-kb DNA ladder; W, water control; C, genomic DNA from wildtype plant; 1-16, putative transgenic plants. (C) Southern blot analysis of transgenic plants. Lane 1, 3, 4, 5, 6 and 7 shows single copy integration, Lane 2 shows triple copy integration while lane 8 shows double copy integration M: λ DNA/HindIII ladder (Thermo Scientific). The left border (LB) junction fragment of the T-DNA is greater than 2.6 kb in pBinAR-UBI:Cry2Aa binary vector (the distance between HindIII and LB). (D) The qRT-PCR analysis shows relative fold change in gene expression of cry2Aa transcript in T2 generation of transgenic brinjal plants. The expression of cry2Aa was determined by using 18S rRNA as internal control. E1, E3, E4 and E7 represent T2 generation transgenic lines.
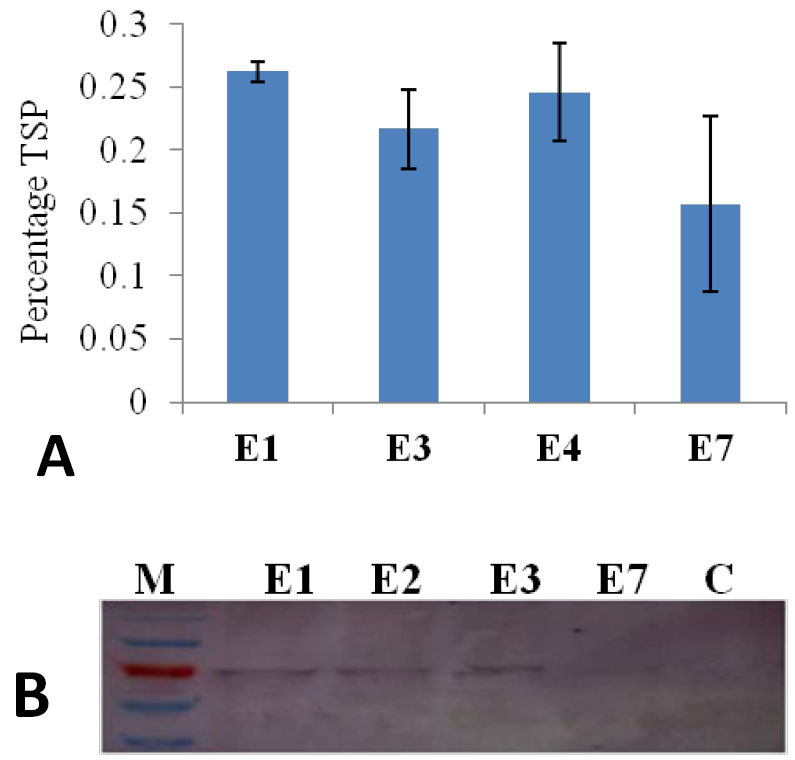
Protein expression analysis of transgenic brinjal plants. Protein expression profiling of different transgenic plants: E1, E2, E3 and E7 represent different lines of Cry2Aa transgenic plants. (A) Quantitative ELISA (B) Western analysis, E1 transgenic lines showes higher concentration of Cry2Aa protein accumulation whereas E7 accumulate less Cry2Aa protein.
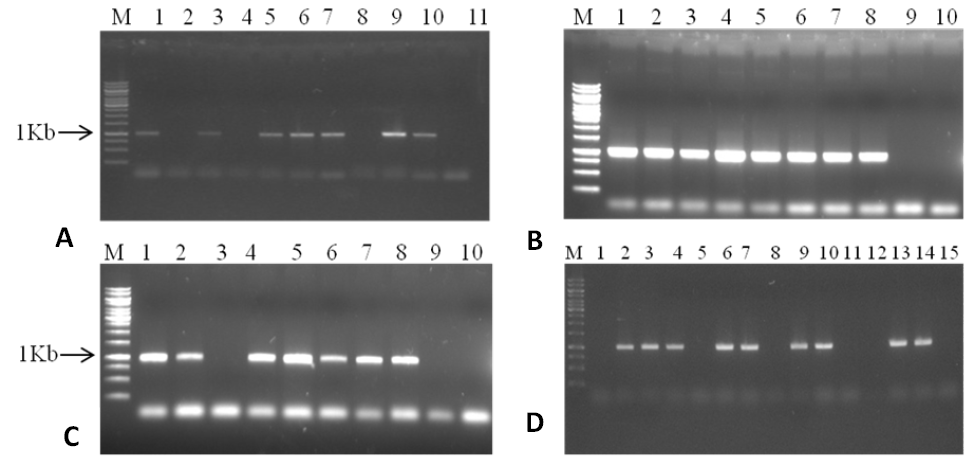
Segregation analysis of T1 Cry2Aa brinjal plants. Randomly collected leaf samples from different plants of line E1, E3, E4, and E7 have been used to test the segregation by PCR. (A) E1 cry2Aa gene-specific PCR; (B) E3 cry2Aa gene-specific PCR; (C) E4 cry2Aa gene-specific PCR; (D) E7 cry2Aa. M, 1 kb ladder.


