

Comparison of the Predictive Capabilities of Several Data Mining Algorithms and Multiple Linear Regression in the Prediction of Body Weight by Means of Body Measurements in the Indigenous Beetal Goat of Pakistan


Comparison of the Predictive Capabilities of Several Data Mining Algorithms and Multiple Linear Regression in the Prediction of Body Weight by Means of Body Measurements in the Indigenous Beetal Goat of Pakistan
Ecevit Eyduran1, Daniel Zaborski2*, Abdul Waheed3, Senol Celik4, Koksal Karadas5 and Wilhelm Grzesiak2
1Department of Animal Science, Igdir University, Igdir, Turkey
2Laboratory of Biostatistics, Department of Ruminants Science, West Pomeranian University of Technology, Doktora Judyma 10, 71-466 Szczecin, Poland
3Department of Livestock and Poultry Production, Bahauddin Zakariya University, Multan, Pakistan
4Department of Animal Science, Bingol University, Bingol, Turkey
5Department of Agricultural Economics, Igdir University, Igdir, Turkey
ABSTRACT
The main goal of this study was to establish the algorithm with the best predictive capability among classification and regression trees (CART), chi-square automatic interaction detector (CHAID), radial basis function (RBF) networks and multilayer perceptrons with one (MLP1) and two (MLP2) hidden layers in body weight (BW) prediction from selected body measurements in the indigenous Beetal goat of Pakistan. Moreover, the results obtained with the data mining algorithms were compared with multiple linear regression (MR). A total of 205 BW records including one categorical (sex) and six continuous (head girth above eyes, neck length, diagonal body length, belly sprung, shank circumference and rump height) predictors were utilized. The Pearson correlation coefficient between the actual and predicted BW (r) and root-mean-square error (RMSE) were used as goodness-of-fit criteria, among others. A 10-fold-cross validation was applied to train and test CART, CHAID and ANN and to estimate MR coefficients. The most significant BW predictors were sex, rump height, shank circumference and head girth. The r value ranged from 0.82 (MLP1) to 0.86 (RBF and MR). The lowest RMSE (3.94 kg) was found for RBF and the highest one (4.49 kg) for MLP1. In general, the applied algorithms quite accurately predicted BW of Beetal goats, which may be helpful in making decisions upon standards, favourable drug doses and required feed amount for animals. The ascertainment of the body measurements associated with BW using data mining algorithms can be considered as an indirect selection criterion for future goat breeding studies.
Article Information
Received 16 July 2016
Revised 01 August 2016
Accepted 22 1 August 2016
Available online 02 January 2017
Authors’ Contributions
AW, SC and EE conceived and designed the study and wrote the article, DZ and WG analyzed the data. KK helped in acquisition of data.
Key words
CART, CHAID, ANN, Multiple linear regression, Body weight
* Corresponding author: daniel.zaborski@zut.edu.pl
0030-9923/2017/0001-0273 $ 9.00/0
Copyright 2017 Zoological Society of Pakistan
DOI: http://dx.doi.org/10.17582/journal.pjz/2017.49.1.273.282
Introduction
Body weight (BW) prediction in farm animals is spotlighted in practice under circumstances in which weighing instrument is lacking, and it assists in the determination of requisite feed amount, drug dose, and market price of an animal and in improving profitability of animal farms. Establishment of the body measurements which are highly bound up with BW in practical terms aids in gaining heavier offspring in the selection programs of sheep and goat species. The predictive quality of the establishment in small ruminants is improved through fair and straight statistical techniques.
In goat breeding, Cankaya and Kayaalp (2007) found interrelationships among body weights (birth weight, weaning weight, and weight at 6 months) and body measurements (height at withers, body length, chest width, chest girth and depth, front, middle and hind rump width) taken from German Farm × Hair Crossbred goats in canonical correlation analysis and stated that chest depth and girth could be used as indirect selection criteria for the improvement of BW of the crossbred goats. Önder et al. (2015) estimated high genetic correlations between BW and body measurements viz. body length, height at sacrum and withers, and chest depth in Saanen kids. There are also many studies dealing with BW prediction from different body morphological measurements in small ruminants using alternative statistical techniques, such as correlation analysis (Khan et al., 2006; Yakubu, 2009; Tadesse et al., 2012), simple (Parés et al., 2012) and multiple (Moaeen-ud-Din et al., 2006; Chitra et al., 2012; Tadesse et al., 2012; Seifemichael et al., 2014) linear regression analysis, ridge and robust regression analysis and multiple linear regression for factor analysis and principal component scores (Eyduran et al., 2013). However, little attention to the data mining algorithms has been given in this context (Khan et al., 2014; Ali et al., 2015).
Numerous studies on BW prediction in goats are available in the literature. Villiers et al. (2009) predicted BW from heart girth in KwaZulu-Natal goats. Yakubu (2009) obtained BW prediction equations based on rump height, heart girth, height at withers, and body length of West African Dwarf goats, whereas, Parés et al. (2012) estimated BW from thoracic girth in Gwembe Goat of the South Zambia. The relationship between BW and chest girth, body length and height at withers in Beetal, Teddi and Beetal × Teddi crossbred goats in Punjab, Pakistan was recorded by Moaeen-ud-Din et al. (2006). Khan et al. (2006) were interested in the relationship between BW and body measurements (body length, heart girth and height at withers) in Beetal goats of Pakistan, while Alex et al. (2010) used simple, multiple and nonlinear regression models for BW prediction by the use of body measurements (chest girth, paunch girth, body length and height at withers) taken easily from Malabari goats reared under field conditions. On the other hand, Chitra et al. (2012) used a suitable regression model to examine the relationship between BW and body measurements (body length, hearth girth, and height at withers) in adult female Malabari goats under field conditions and Tadesse et al. (2012) measured determinative body measurements like heart girth, body length, and height at withers in the BW prediction of Abergelle goats in Tigray region, Northern Ethiopia. Seifemichael et al. (2014) aimed at predicting BW from body length, chest girth, ear length, horn length, pelvic width, rump height, and height at withers in Afar goats in Ethiopia, whereas Eyduran et al. (2013) predicted BW by means of body measurements in a local commercial goat of Southern Punjab in Pakistan with the assistance of scores extracted from the measurements fitted to the factor and principal component analyses. Finally, Khan et al. (2006) estimated correlation coefficients between BW and body measurements taken at different ages in Beetal goats. To indicate body measurements being pertinent to BW in terms of goat breeding, a very good solution may be found by applying much more impactful statistical techniques, such as data mining algorithms.
Instead of classical regression analyses, the powerful algorithms such as classification and regression trees (CART), chi-square automatic interaction detector (CHAID) and artificial neural network (ANN) types viz. radial basis function (RBF) networks and multilayer perceptrons (MLP) with one (MLP1) and two (MLP2) hidden layers can be utilized. They usually work very well in the prediction of quantitative traits, such as milk yield, BW, egg weight etc. (Grzesiak and Zaborski, 2012). Starting from the root node containing all cases, the CART algorithm structures a binary decision tree by recursively partitioning a given subset into two new subsets with the similar values of a dependent variable until forming the most homogenous subsets in the optimal decision tree diagram (Grzesiak and Zaborski, 2012; Ali et al., 2015). By contrast with the former one, the CHAID algorithm forms a decision tree structure by recursively dividing a subset into new multi-subsets comprising similar responses of a dependent variable as soon as possible beginning from the root node. One the other hand, MLP is a feed-forward neural network consisting of input, hidden and output layers (Gorgulu, 2012). It is trained in a supervised manner using various learning algorithms, of which back-propagation is the most popular one. Considered as another ANN type, the RBF network is also a feed-forward network with just one hidden layer that is trained in a supervised way. It has been reported that a limited number of previous studies on the BW prediction in Beetal goats and some other breeds was available (Moaeen-ud-Din et al., 2006; Khan et al., 2006). Data mining algorithms have not yet been employed in this field, but they may be an option for the straightforward identification of body measurements related to BW.
In view of the above information, the main aim of the present study was to determine the best algorithm in terms of its predictive performance among CART, CHAID, and ANN types such as RBF, MLP1 and MLP2 in the prediction of BW from selected body measurements in the indigenous Beetal goat of Pakistan. Moreover, the predictive performance of the above-mentioned data mining algorithms was compared with that of a more traditional statistical method, i.e. multiple linear regression (MR).
Table I.- Descriptive statistics for the input and output variables (n=205).
| Categorical variable | n | % |
| SEX – F | 189 | 92.20 |
| SEX - M | 16 | 7.80 |
| Continuous variable | Mean | SD |
| HEADGIR (cm) | 47.15 | 4.28 |
| NECKLEN (cm) | 30.86 | 3.71 |
| BODYLEN (cm) | 73.38 | 4.65 |
| BELLYSP (cm) | 21.92 | 3.01 |
| SHANKCI (cm) | 10.12 | 0.89 |
| RUMPH (cm) | 83.49 | 5.31 |
| BODYW (kg)* | 44.00 |
7.85 |
F, female; M, male; HEADGIR, head girth above eyes; NECKLEN, neck length; BODYLEN, body length; BELLYSP, belly sprung; SHANKCI, shank circumference; RUMPH, rump height; BODYW, body weight; *, output variable.
Material and Methods
A total of 205 BW records of Beetal goats were used in the analysis. The goats were maintained at four different government livestock farms viz. Livestock Experimental Station (LES), Rakh Kheirewala, District Layyah, LES, Rakh Ghulaman, Distrcit Bhakkar, LES, Allahdad, District Khanewal and Livestock Experimental and Research Station, Bahadurbagar, District Okara in the Punjab province of Pakistan. No ethical consent was required for carrying out the present study. Each BW record comprised seven input variables (goat’s sex as a categorical variable and six body measurements as continuous ones). They were denoted as follows: X1 – SEX – sex of the goat (F - female or M - male), X2 – HEADGIR – head girth above eyes (cm), X3 – NECKLEN – neck length (cm), X4 – BODYLEN – diagonal body length (cm), X5 – BELLYSP – belly sprung (cm), X6 - SHANKCI – shank circumference (cm) and X7 – RUMPH – rump height (cm). BW (kg) was an output variable (Y). Descriptive statistics for the input and output variables are presented in Table I.
The first method used for the prediction of goat BW was CART (Breiman et al., 1984). In the construction of the tree, pruning according to variance was used as a stopping rule and the minimum tree node size of 20 was adopted as an additional stopping criterion. Moreover, a 10-fold cross-validation with a one-standard error rule was applied in order to find the most effective regression tree with appropriate complexity and fit to the training data. The second tree-based algorithm used in the present study was CHAID (Kass, 1980) in the exhaustive mode with the following stopping criteria: the minimal node size of 20 and p-value for splitting equal to 0.05. In addition, the Bonferroni adjustment was utilized to correct for the p-values of the best predictor at each split in the CHAID data mining algorithm.
Finally, the following types of ANN were adopted: RBF networks, MLP1 and MLP2. For the training of the RBF networks, radial basis function centres were determined using a k-means method, their shape was found using a k-nearest neighbour algorithm and the optimization of the output linear layer was performed with the pseudoinversion method (StatSoft, 1998). For the MLP training, the classical back-propagation algorithm was mainly utilized with a conjugate gradient method applied afterwards if necessary. All the networks were trained until reaching the lowest possible root-mean-square error (RMSE) on the validation set (a part of the original training set used to prevent overtraining). The construction, training and testing of all ANN were carried out using the Statistica Neural Networks program (v. 4.0F, StatSoft Inc., Tulsa, OK, USA) enabling the choice of the optimal network structure and parameters (the number of neurons in hidden layers, the type of post-synaptic potential and activation functions, the number of training epochs, learning rate and momentum, etc).
To compare the predictive performance of the selected data mining algorithms with that of a more traditional statistical method, MR was also applied according to the following formula:

where: Y is a dependent variable (BW), β0 is an intercept, βi is the ith parameter, Xi is the ith predictor (explanatory variable), ε is a random error.
The regression parameters were estimated with the classical least squares method and the assumptions underlying the MR model were verified (the normal distribution of residuals using the Shapiro-Wilk W test, the lack of residual autocorrelation using the Durbin-Watson test and the residual homoscedasticity using the F test).
Because of the relatively small sample size (205 information records), a 10-fold cross-validation was employed to train and test CART, CHAID and ANN. The same method was also applied to estimate the coefficients of MR and test its predictive performance. In the 10-fold cross-validation, the whole data set (205 records) was randomly divided into 10 approx. equal parts of 20 or 21 records, from which nine were used to train a given type of a prediction model and one served as an independent test set. This procedure was repeated 10 times. Consequently, each part of the original data set was used as a test set exactly once and each of the 10 iterations produced a separate prediction model (a single tree, ANN or MR model). The prediction performance of 10 models was subsequently averaged (Arlot and Celisse, 2010).
To compare the predictive performance of CART, CHAID, ANN and MR in the 10-fold cross-validation, the following measures were employed (Akaike, 1973; Sugiura, 1978; Salehi et al., 1998; StatSoft, 1998; Willmott and Matsuura, 2005; Takma et al., 2012):
1. Pearson correlation coefficient (r) between the actual and predicted BW values,
2. Akaike information criterion (AIC) calculated as:

or:

3. Root-mean-square error (RMSE) given by the following formula:

4. Mean error (ME) given by the following equation:

5. Mean absolute deviation (MAD):

6. Standard deviation ratio (SDratio):

7. Global relative approximation error (RAE):

8. Mean absolute percentage error (MAPE):

where: n is the number of cases in a set, k is the number of model parameters, yi is the real value of an output variable (BW), yip is the predicted value of an output variable (BW), sm is the standard deviation of model errors, sd is the standard deviation of an output variable (BW).
In addition, a two-tailed t-test (with the Bonferroni adjustment) of the significance of the differences between correlation coefficients (r) among prediction models was performed, whose test statistic was given by the following formula (Kenny, 1987):
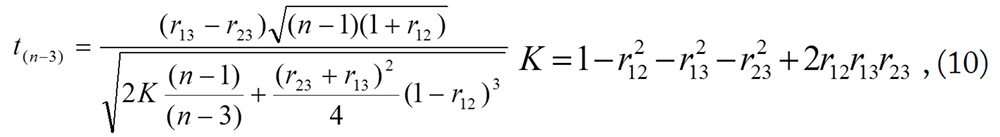
where: r13 is a correlation coefficient between observed and predicted values for the first model, r23 is a correlation coefficient between observed and predicted values for the second model, r12 is a correlation coefficient between the values predicted by the first and the second model, n is a sample size.
To find the average architecture of CART, CHAID, ANN and the final form of MR equation, each of 10 models obtained as a result of the 10-fold cross-validation was run on the whole dataset and its AIC (or AICc) value was calculated. The model with the lowest AIC or AICc was selected as an average one.
In the case of the classification trees (CART and CHAID), the importance measure was calculated to find the most influential predictors. Predictor importance was determined by summing the changes in re-substitution costs over all tree nodes and expressing this sum as a fraction of the maximum sum obtained for all predictors (StatSoft, 1998). So, the importance values ranged between 0 and 1.
Moreover, the sensitivity analysis of ANN was performed in order to reveal the most significant input variables. It was based on the following indicators:
1. The rank, which ordered input variables according to a decreasing error – the lower the rank, the more significant the variable.
2. The error, which was the RMSE value after removing a given variable from the neural model; the higher the error, the more significant the variable.
3. The error ratio, which was the ratio of the RMSE value after the removal of a given variable from the model to the error for the full model (with all the variables included); the higher the ratio, the more influential a given variable.
In the case of MR, the value of the Student t statistic and its corresponding degrees of freedom were utilized to order explanatory variables according to their significance to the model.
Importance values, errors and ratios calculated in the above-mentioned manner for each of the 10 models in the 10-fold cross-validation were averaged and ranks presented in Table IV were assigned on the basis of these averaged values. All the computations, excluding those associated with the construction, training and testing of ANN, were carried out using the Statistica program (v. 12, StatSoft Inc., Tulsa, OK, USA). The significance level in all the analyses was set at P<0.05.
Results
The average CART model comprised only three nodes (one non-terminal and two terminal nodes) and the average CHAID tree consisted of five nodes (two non-terminal and three terminal nodes). The average structures of both decision trees are depicted in Figures 1 and 2, respectively. There was only one split in the CART, according to the SEX variable, which resulted in the division of all animals into two groups (females and males). As can be expected,
Table II.- Predictive performance of CART, CHAID, ANN and MR in a 10-fold cross-validation.
| Measure | CART | CHAID | RBF | MLP1 | MLP2 | MR |
| r |
0.8212a |
0.8475ab |
0.8643b |
0.8199a |
0.8339ab |
0.8620b |
| AIC | 619.81 | 594.16 | 1172.16 | 890.97 | -30.12 | 582.34 |
| RMSE (kg) | 4.4687 | 4.1569 | 3.9398 | 4.4860 | 4.3267 | 3.9731 |
| ME (kg) | 0.0060 | -0.0336 | -0.0493 | -0.0837 | -0.1259 | -0.0649 |
| MAD (kg) | 3.3251 | 2.9904 | 2.8878 | 3.2592 | 3.1537 | 2.7860 |
|
SDratio |
0.5706 | 0.5308 | 0.5030 | 0.5727 | 0.5522 | 0.5072 |
| RAE | 0.1000 | 0.0930 | 0.0882 | 0.1004 | 0.0968 | 0.0889 |
| MAPE (%) | 8.1208 | 7.2946 | 6.9922 | 7.9811 | 7.7227 |
6.8779 |
a,b, different superscripts for r denote statistical significance at P<0.05; AIC, Akaike information criterion; CART, classification and regression tree; CHAID, chi-square automatic interaction detector; RBF, radial basis function network; MLP1, multilayer perceptron with one hidden layer; MLP2, multilayer perceptron with two hidden layers; MR, multiple linear regression; RMSE, root-mean-square error; ME, mean error; MAE, mean absolute error; SDratio, standard deviation ratio; RAE, relative approximation error; MAPE, mean absolute percentage error.
males were heavier on average (66.3 kg) than females (42.13 kg). However, two splits were present in the structure of the average exhaustive CHAID tree. The sex of a goat was the most significant input variable like for the CART, but the cases representing females (node ID=2) were further split into two smaller groups (nodes ID=4 and 5) according to the RUMPH variable. Females with the rump height less than or equal to 83.0 cm were lighter on average (41.0 kg) than those with the rump height greater than 83.0 cm (44.4 kg). As for ANN, the average RBF network had a 7-34-1 structure (the number of neurons in the input, hidden and output layers, respectively), whereas the average MLP1 had a 7-1-1 structure and MLP2 had a 7-13-10-1 structure. Finally, the estimated parameters of the final form of MR are given in Table III. It should be emphasized that the value of the F statistic (74.30) in the global test of model quality showed its adequacy (P=0.0000) with the percentage of the BW variance explained by the model equal to 73.71%. The explanatory variables with the significant effect on BW were SEX, BODYLEN, SHANKCI and RUMPH (P<0.05 in the Student T test). However, it should also be mentioned that not all the assumptions of the regression model applicability were fulfilled (the lack of normal distribution of residuals existed in all cases).
Table III.- The estimated multiple linear regression parameters.
| Model term | Estimate | Standard error | T statistic | P |
| Intercept | -16.4948 | 10.6078 | -1.5550 | 0.1218 |
| SEX | -13.5118 | 1.8426 | -7.3330 | 0.0000 |
| HEADGIR | -0.1529 | 0.0930 | -1.6452 | 0.1017 |
| NECKLEN | -0.0070 | 0.1015 | -0.0695 | 0.9447 |
| BODYLEN | 0.2861 | 0.0823 | 3.4763 | 0.0006 |
|
BELLYSP |
0.0706 | 0.1083 | 0.6521 | 0.5152 |
| SHANKCI | 1.6808 | 0.3975 | 4.2286 | 0.0000 |
| RUMPH | 0.4887 | 0.0841 | 5.8127 |
0.0000 |
R, 0.8644; R2, 0.7472; adjusted R2, 0.7371; F7,176, 74.295; P, 0.0000; variables with a statistically significant effect on body weight are marked in bold.
Predictive performance of decision trees, ANN and MR
The mean predictive performance measures estimated on the basis of the 10-fold cross-validation procedure showed the slight superiority of the RBF network and MR over MLP and decision trees (Table II) although all the models were characterized by the relatively favourable values of the prediction accuracy criteria. The relationship between the observed and predicted values of BW in the goats is presented in Figure 3. The estimated value of the Pearson correlation coefficient was significantly higher (P<0.05) for the RBF network (0.8643) and MR (0.8620) compared with that for CART (0.8212) and MLP1 (0.8199). In general, all other quality measures (RMSE, MAD, SDratio, RAE and MAPE) were lowest for the RBF network and MR, which indicates their better predictive capabilities in comparison with other specified models. On the other hand, slightly lower values of the Pearson correlation coefficient and the higher values of the errors (RMSE, RAE, and MAPE) and SDratio were found for CART and MLP1. As for ME and MAD, MLP2 underestimated the goats’ BW most (ME equal to -0.13 kg), while CART overestimated the values of this trait most (ME equal to 0.01 kg). In terms of the absolute differences (MAD), the highest error was recorded for CART (3.33 kg) and the lowest one for MR (2.79 kg). Finally, AIC being the measure of model performance, which also takes into account its complexity, favored MLP2 (the smallest AIC value), while the highest AIC was characteristic of the RBF network. MR and CHAID had also a relatively low AIC, but it was higher than that for MLP2 (Table II).
The most significant input variables
The most influential predictors for CART, CHAID, ANN and MR are shown in Table IV. As can be seen, SEX was most significant for all the models, followed by RUMPH (for CHAID, MLP and MR), SHANKCI (for the RBF network) or HEADGIR (for CART), whereas the sequence of the remaining input variables differed depending on the model. RUMPH and NECKLEN were ranked third and fourth, respectively, by CART, while HEADGIR and
BODYLEN were ranked in the same way by CHAID.
RUMPH and HEADGIR were also important for the RBF network (third and fourth position, respectively), whereas SHANKCI and BODYLEN turned out to be fairly significant for MLP and MR (also the third and fourth position, respectively). Finally, BELLYSP was indicated as an input variable with the least contribution to the determination of BW value in most cases (firth to seventh position depending on the model – Table IV).
Discussion
In general, a survey of the relationship between BW and morphological measurements obtained by using measuring device is a purposeful procedure in the BW prediction in the goat. Reliability of the procedure rests on statistical analyses executed by several analysts. In the literature, an endeavour at applying CART, CHAID and some ANN types rather than classical analyses was finitely made in the prediction of BW by means of morphological measurements in sheep (Khan et al., 2014; Ali et al., 2015).
In Harnai breed, Ali et al. (2015) comparatively examined CART, CHAID, exhaustive CHAID and ANN in terms of their predictive capabilities, estimating at the same time the Pearson correlation coefficients between actual and predicted BW (0.915, 0.918, 0.909 and 0.91), SDratio (0.403, 0.397, 0.417 and 0.4230), RAE (0.0564, 0.0556, 0.0583 and 0.0594) and RMSE (1.509, 1.488, 1.560 and 1.589) for CHAID, exhaustive CHAID, CART and ANN, respectively. The goodness-of-fit criteria estimated by Ali et al. (2015)
Table IV.- The most important predictors for CART, CHAID, ANN and MR.
| SEX | HEADGIR | NECKLEN | BODYLEN | BELLYSP | SHANKCI | RUMPH | |
| CART | |||||||
| Rank | 1 | 2 | 4 | 5 | 7 | 6 | 3 |
| Import ance | 1.0000 | 0.9109 | 0.5923 | 0.5690 | 0.1969 | 0.2914 | 0.8133 |
| CHAID | |||||||
| Rank | 1 | 3 | 6 | 4 | 7 | 5 | 2 |
| Import ance | 1.0000 | 0.1853 | 0.0482 | 0.1520 | 0.0283 | 0.1280 | 0.3101 |
| RBF | |||||||
| Rank | 1 | 4 | 6 | 5 | 7 | 2 | 3 |
| Error | 5.9410 | 4.0495 | 3.9537 | 4.0308 | 3.9181 | 4.2146 | 4.1485 |
| Ratio | 1.5548 | 1.0612 | 1.0350 | 1.0527 | 1.0249 | 1.1026 | 1.0868 |
| MLP1 | |||||||
| Rank | 1 | 6 | 7 | 4 | 5 | 3 | 2 |
| Error | 5.7210 | 4.2777 | 4.2655 | 4.4687 | 4.2861 | 4.5607 | 4.9467 |
|
Ratio |
1.3455 | 1.0015 | 0.9990 | 1.0462 | 1.0042 | 1.0680 | 1.1593 |
| MLP2 | |||||||
| Rank | 1 | 6 | 7 | 4 | 5 | 3 | 2 |
|
Error |
5.7210 | 4.2777 | 4.2655 | 4.4687 | 4.2861 | 4.5607 | 4.9467 |
| Ratio | 1.3455 | 1.0015 | 0.9990 | 1.0462 | 1.0042 | 1.0680 | 1.1593 |
| MR | |||||||
| Rank | 1 | 5 | 7 | 4 | 6 | 3 |
2 |
CART, classification and regression tree; CHAID, chi-square automatic interaction detector; RBF, radial basis function network; MLP1, multilayer perceptron with one hidden layer; MLP2, multilayer perceptron with two hidden layers; MR, multiple linear regression; HEADGIR, head girth above eyes; NECKLEN, neck length; BODYLEN, body length; BELLYSP, belly sprung; SHANKCI, shank circumference; RUMPH, rump height.
were better compared with the corresponding estimates in the present study. The variation might be ascribed to species, breed, managerial and agro-climatic conditions.
Mohammad et al. (2012) specified the CHAID algorithm to predict BW from chest girth and height at withers at yearling age in the indigenous sheep breeds of Pakistan. The value of R2 representing explained variability in BW was 72% and chest girth was a determinative trait for the CHAID tree-based algorithm used in the elimination of multicollinearity problems associated with a multiple linear regression analysis. In the literature on BW prediction in small ruminants, the earlier reports on the good assessment of model goodness-of-fit criteria were ineligible by contrast with Ali et al. (2015). In this context, the present paper could be useful for similar future studies.
The application of regression trees to birth weight prediction in Karakas and Norduz sheep was also investigated by Eyduran et al. (2008), who found that lamb sex significantly affected birth weight of single lambs, whereas genotype was important for the birth weight of twins. In a similar study on fleece weight prediction in Akkaraman and Awassi ewes using CHAID, Eyduran et al. (2016) reported that the highest value of this trait was characteristic of Awassi sheep and the lowest one of Akkaraman sheep.
The ANN model with training (75% of cases) and testing (25% of cases) sets was developed by Ruhil et al. (2013) in the prediction of BW based on chest girth, body length and height at withers measured from 919 female Attappady Black goats belonging to four age groups (0 - 3, 3 - 6, 6 - 12 and above 12 months). The authors estimated the Pearson correlation coefficients between actual and predicted BW which were equal to 0.9314 - 0.8791, 0.8590 - 0.7958, 0.7586 - 0.7588 and 0.8207 - 0.8725 (P<0.01) for the training and testing sets comprising animals at the age of 0 - 3, 3 - 6, 6 - 12 and above 12 months, respectively, which was almost in agreement with the correlation coefficients estimated in the present work (Table II).
In data mining studies, some authors suggested that the applied algorithm should have the SDratio less than 0.40 for a good predictive performance (Ali et al., 2015). Having nearly good performance, the estimates of SDratio in the present study ranged between 0.5030 (RBF) and 0.5727 (MLP1), and were lower than those obtained for the training and testing sets by Ruhil et al. (2013), who reported the values of 0.6517 - 0.6519 at 6 - 12 months of age, respectively. The current estimates of RMSE in our work varied from 3.9398 kg (RBF) to 4.4860 kg (MLP1) and were higher compared to those obtained by Ruhil et al. (2013), who recorded the RMSE values of 0.8142 - 3.1054 kg and 1.1960 - 2.7255 kg for the training and testing set, respectively. Some authors reported that a very high Pearson correlation coefficient between actual and predicted BW yielded a good fit to the data in data mining studies (Grzesiak and Zaborski, 2012; Ali et al., 2015). This statement is consistent with the present estimates relating to all the algorithms analyzed in our work (Table II). The observed differences may be generally attributed to genotypic (species, breed, rearing systems) and environmental (agro-climatic and managerial conditions) factors.
Conclusions
The BW prediction based on selected body measurements carried out in our study presents some valuable clues in practical terms to the breeders in rural conditions, where there is often a lack of weighing balance and experienced farm staff. Body weight prediction is also useful for the administration of suitable medicinal doses and determination of an accurate price of an animal.
The present study containing technical information on several model quality criteria provided some precious results: (1) all the data mining algorithms, for which there is no need of the assumption of regression models, and MR had a good fit to the data, (2) in all the data mining algorithms and MR, sex factor was found to be the most determinative BW predictor, (3) in the CHAID algorithm, sex and rump height were determined as effective BW predictors and female goats with rump height greater than 83.00 cm had heavier BW, (4) MLP1 and MLP2 had the same importance order of predictors, (5) rump height was the second most significant variable affecting body weight for CHAID, MLP1, MLP2 and MR. Results of the present study based on the goodness-of-fit criteria illustrated that data mining algorithms could be successfully applied to BW prediction based on selected body measurements and might be evaluated for goat breeding in future studies.
Acknowledgments
The publication of this article was partially supported by the Polish Ministry of Science and Higher Education grant No. 517-01-028-3962/17.
Conflict of Interest statement
The authors declare that there is no conflict of interests regarding the publication of this article.
References
Akaike, H., 1973. Information theory and an extension of the maximum likelihood principle. In: Second International Symposium on Information Theory. Akademiai Kiado, Hungary, pp. 267–281.
Alex, R., Raghavan, K.C. and Mercey, K.A., 2010. Prediction of body weight of Malabari goats from body measurements under field conditions. J. Vet. Anim. Sci., 41: 21-27.
Ali, M., Eyduran, E., Tariq, M.M., Tirink, C., Abbas, F., Bajwa, M.A., Baloch, M.H., Nizamani, A.H., Waheed, A., Awan, M.A., Shah, S.H., Ahmad, Z. and Jan, S., 2015. Comparison of artificial neural network and decision tree algorithms used for predicting live weight at post-weaning period from some biometrical characteristics in Harnai sheep. Pakistan J. Zool., 47: 1579-1585.
Arlot, S. and Celisse, A., 2010. A survey of cross-validation procedures for model selection. Stat. Surv., 4: 40–79. http://dx.doi.org/10.1214/09-SS054
Breiman, L., Friedman, J., Stone, C.J. and Olshen, R.A., 1984. Classification and regression trees. CRC Press, USA.
Cankaya, S. and Kayaalp, G.T., 2007. Estimation of relationship between live weights and some body measurements in German Farm x Hair crossbred by canonical correlation analysis. Hayvansal Üretim, 48: 27-32.
Chitra, R., Rajendran, S., Prasanna, D. and Kirubakaran, A., 2012. Prediction of body weight using appropriate regression model in adult female Malabari goat. Vet. World, 5: 409-411. http://dx.doi.org/10.5455/vetworld.2012.409-411
Eyduran, E., Karakus, K., Keskin, S. and Cengiz, F., 2008. Determination of factors influencing birth weight using regression tree (RT) method. J. appl. Anim. Res., 34: 109–112. http://dx.doi.org/10.1080/09712119.2008.9706952
Eyduran, E., Waheed, A., Tariq, M.M., Iqbal, F. and Ahmad, S., 2013. Prediction of live weight from morphological characteristics of commercial goat in Pakistan using factor and principal component scores in multiple linear regression. J. Anim. Pl. Sci., 23: 1532-1540.
Eyduran, E., Keskin, I., Erturk, Y.E., Dag, B., Tatliyer, A., Tirink, C., Aksahan, R. and Tariq, M.M., 2016. Prediction of fleece weight from wool characteristics of sheep using regression tree method (CHAID algorithm). Pakistan J. Zool., 48: 957–960.
Gorgulu, O., 2012. Prediction of 305-day milk yield in Brown Swiss cattle using artificial neural networks. S. Afr. J. Anim. Sci., 42: 280-287. http://dx.doi.org/10.4314/sajas.v42i3.10
Grzesiak, W. and Zaborski, D., 2012. Examples of the use of data mining methods in animal breeding. In: Data mining applications in engineering and medicine. (ed. A. Karahoca)., InTech, Croatia, pp. 303-324. http://dx.doi.org/10.5772/50893
Kass, G.V., 1980. An exploratory technique for investigating large quantities of categorical data. J. R. Stat. Soc. Ser. C Appl. Stat., 29: 119–127. http://dx.doi.org/10.2307/2986296
Kenny, D.A., 1987. Statistics for the social and behavioral sciences. Little, Brown, USA.
Khan H., Muhammad, F., Ahmad, R., Nawaz, G., Rahimullah and Zubair M., 2006. Relationship of body weight with linear body measurements in goats. J. Agric. biol. Sci., 1: 51-54.
Khan, M.A., Tariq, M.M., Eyduran, E., Tatliyer, A., Rafeeq, M., Abbas, F., Rashid, N., Awan, M.A. and Javed, K., 2014. Estimating body weight from several body measurements in Harnai sheep without multicollinearity problem. J. Anim. Pl. Sci., 24: 120–126.
Moaeen-ud-Din, M., Ahmad, N., Iqbal, A. and Abdullah, M., 2006. Evaluation of different formulas for weight estimation in Beetal, Teddi and crossbred (Beetal x Teddi) goats. J. Anim. Pl. Sci., 16: 3-4.
Mohammad, M.T., Rafeeq, M., Bajwa, M.A., Awan, M.A., Abbas, F., Waheed, A., Bukhari, F.A. and Akhtar, P., 2012. Prediction of body weight from body measurements using regression tree (RT) method for indigenous sheep breeds in Balochistan, Pakistan. J. Anim. Pl. Sci., 22: 20-24.
Önder, H., Şen, U., Takma, Ç., Ocak, S. and Abacı, S.H., 2015. Genetic parameter estimates for growth traits in Saanen kids. Kafkas Univ. Vet. Fak Derg., 21: 799-804.
Parés, P.-M., Mwaanga, E.S., Caballero, M., Sabate, J. and Valenzuela, S., 2012. Live weight estimation of Gwembe goat (Capra hircus) from measurement of thoracic girth. J. Vet. Anat., 5: 9-14.
Ruhil, A.P., Raja, T.V. and Gandhi, R.S., 2013. Preliminary study on prediction of body weight from morphometric measurements of goats through ANN models. J. Ind. Soc. Agric. Stat., 67: 51-58.
Salehi, F., Lacroix, R. and Wade, K.M., 1998. Improving dairy yield predictions through combined record classifiers and specialized artificial neural networks. Comput. Electron. Agric., 20: 199–213. http://dx.doi.org/10.1016/S0168-1699(98)00018-0
Seifemichael, M., Kefelegn, K., Negassi, A. and Banerjee, A.K., 2014. Variability in linear body measurements and their application in predicting body weight of Afar goats in Ethiopia. Int. J. Interdiscip. Multidiscip. Stud., 1: 17-25.
StatSoft, 1998. Statistica Neural Networks user guide. StatSoft, USA.
Sugiura, N., 1978. Further analysis of the data by Akaike’s information criterion and the finite corrections. Commun. Stat. - Theory Methods., 7: 13–26. http://dx.doi.org/10.1080/03610927808827599
Tadesse, A., Gebremariam T. and Gangwar, S.K., 2012. Application of linear body measurements for predicting body weight of Abergelle goat breed in Tigray Region, Northern Ethiopia. Global J. Biosci. Biotech., 1: 314-319.
Takma, Ç., Atil, H. and Aksakal, V., 2012. Çoklu doğrusal regresyon ve yapay sinir ağı modellerinin laktasyon süt verimlerine uyum yeteneklerinin karşılaştırılması. Kafkas Univ. Vet. Fak Derg., 18: 941–944. http://dx.doi.org/10.9775/kvfd.2012.6764
Villiers, J.F., Gcumisa, S.T., Gumede, S.A., Thusi, S.P., Dugmore, T.J., Cole, M., Toit, J.F., Vatta, A.F. and Stevens, C., 2009. Estimation of live body weight from the heart girth measurement in KwaZulu-Natal goats. Appl. Anim. Husb. Rural Dev., 2: 1-8.
Willmott, C.J. and Matsuura, K., 2005. Advantages of the mean absolute error (MAE) over the root mean square error (RMSE) in assessing average model performance. Clim. Res., 30: 79. http://dx.doi.org/10.3354/cr030079
Yakubu, A., 2009. Fixing collinearity instability ın the estimation of body weight from morpho-biometrical traits of West African dwarf goats. Trakia J. Sci., 7: 61-66.
To share on other social networks, click on any share button. What are these?


