

Co-Treatment of Caffeic Acid Phenethyl Ester with Chitosan Nanoparticles Inhibits DNA Methylation in HepG2 Cells


Co-Treatment of Caffeic Acid Phenethyl Ester with Chitosan Nanoparticles Inhibits DNA Methylation in HepG2 Cells
Faisal Alzahani1* and Mohammed Abu El-Magd2*
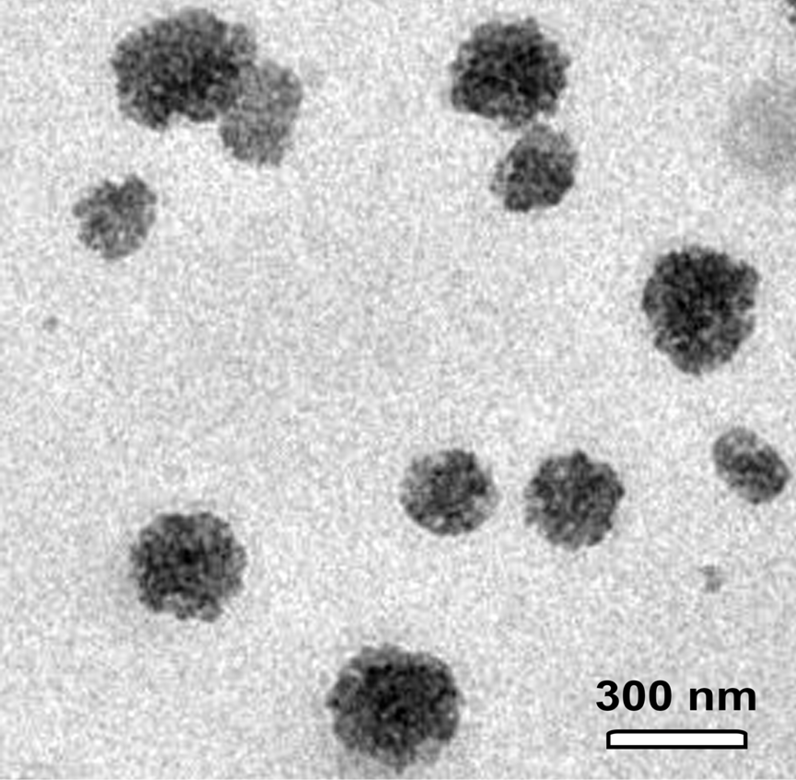
Transmission electron microscope showed the presence of CNPs with various sizes ranging from 150 to 300 nm. Scale bar = 300 nm.

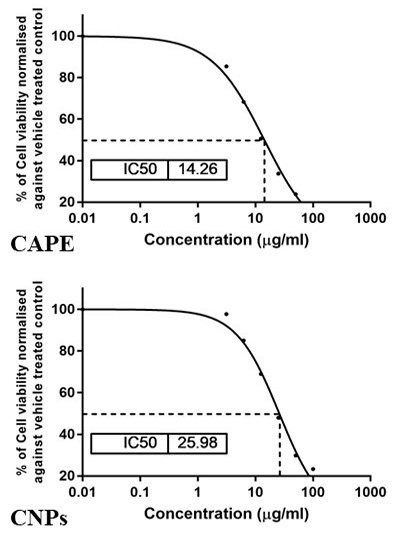
The cytotoxic potential of CAPE and CNPs on HepG2 cells. A representative graph displaying the IC50 value as revealed by the MTT assay. Cells were treated with CAPE or CNPs at serial concentrations from 3.125 to 100 μg/ml and were incubated for 24 h.

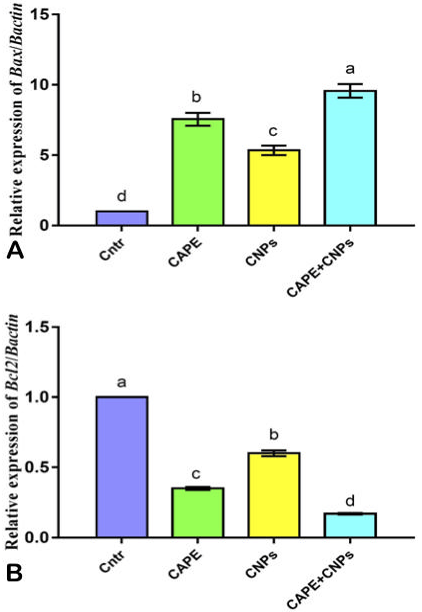
Effect of CAPE and/or CNPs on the expression of Bax (A) and Bcl2 (B) genes in HepG2 cells as detected by qPCR. Cells were treated with CAPE and CNPs alone or in combination (CAPE+CNPs) at doses of their IC50 and incubated for 24 h. Data were presented in the form of fold change mean ± SEM, n = 5/group. Different letters above means (as presented by columns plus error bars) refer to significant differences at P<0.05. All groups compared to each other.
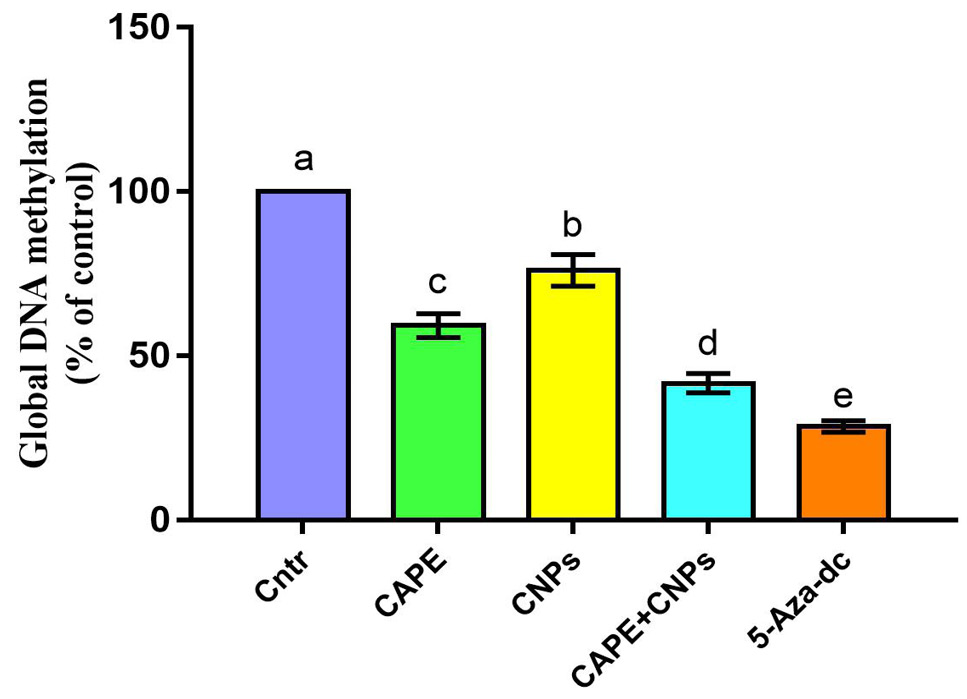
Effect of CAPE and/or CNPs on the Global DNA methylation quantities in HepG2 cells. Cells were treated with CAPE and CNPs alone or in combination (CAPE+CNPs) at doses of their IC50 and incubated for 72 h. Data were presented in the form of % mean ± SEM, n = 5/group. Different letters above means (as presented by columns plus error bars) refer to significant differences at P<0.05. All groups compared to each other. The control group was assigned a value of 100%.

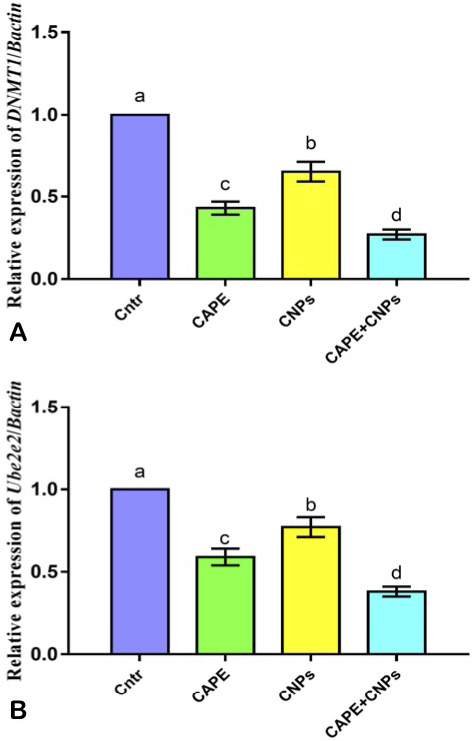
Effect of CAPE and/or CNPs on the expression of DNA methylation-related genes DNMT1 (A) and Ube2e2 (B) in HepG2 cells as detected by qPCR. Cells were treated with CAPE and CNPs alone or in combination (CAPE+CNPs) at doses of their IC50 and incubated for 24 h. Data were presented in the form of fold change mean ± SEM, n = 5/group. Different letters above means (as presented by columns plus error bars) refer to significant differences at P<0.05. All groups were compared to each other.


