
Assessing Drought Conditions in Southern Baghdad (1988-2023) Using NDVI Anomaly and Its Impact on Soil and Vegetation


Assessing Drought Conditions in Southern Baghdad (1988-2023) Using NDVI Anomaly and Its Impact on Soil and Vegetation
Auras Muhi Taha*, Ibrahim Ahmed Ibrahim, Hassanein Abduladeem, Mohammed Qais Yassen, Omaima Khalid Ahmed and Tabark Najim Abdul-Allah
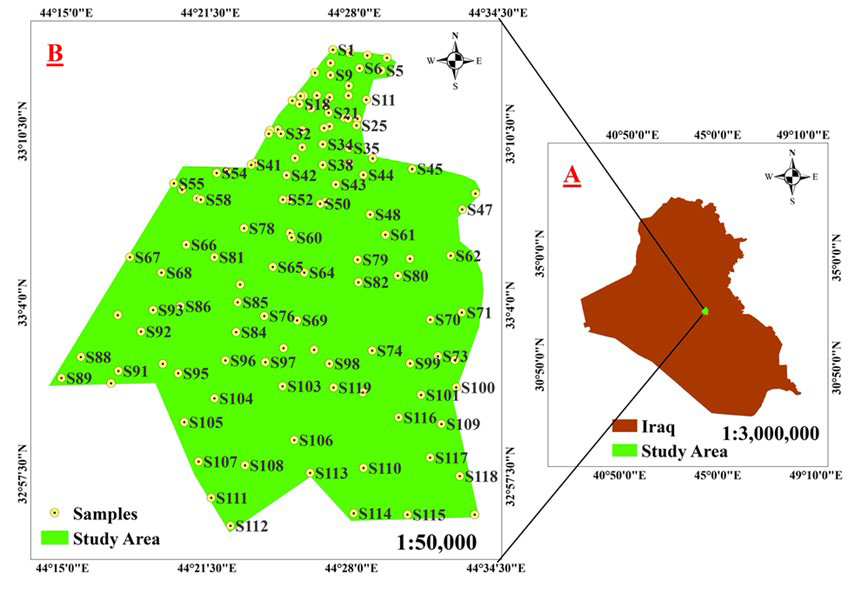
Figure 1:
Location of the study area: A. Iraq, B. Study area with samples.
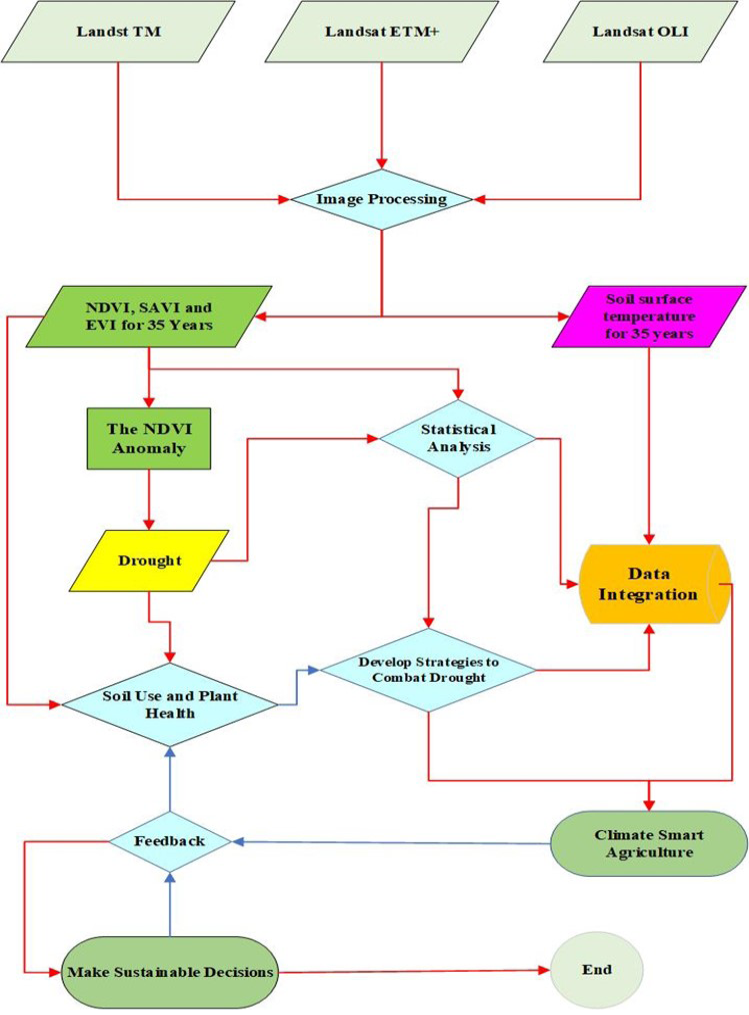
Figure 2:
A diagram showing the stages of image processing and the statistical operations performed on the data.
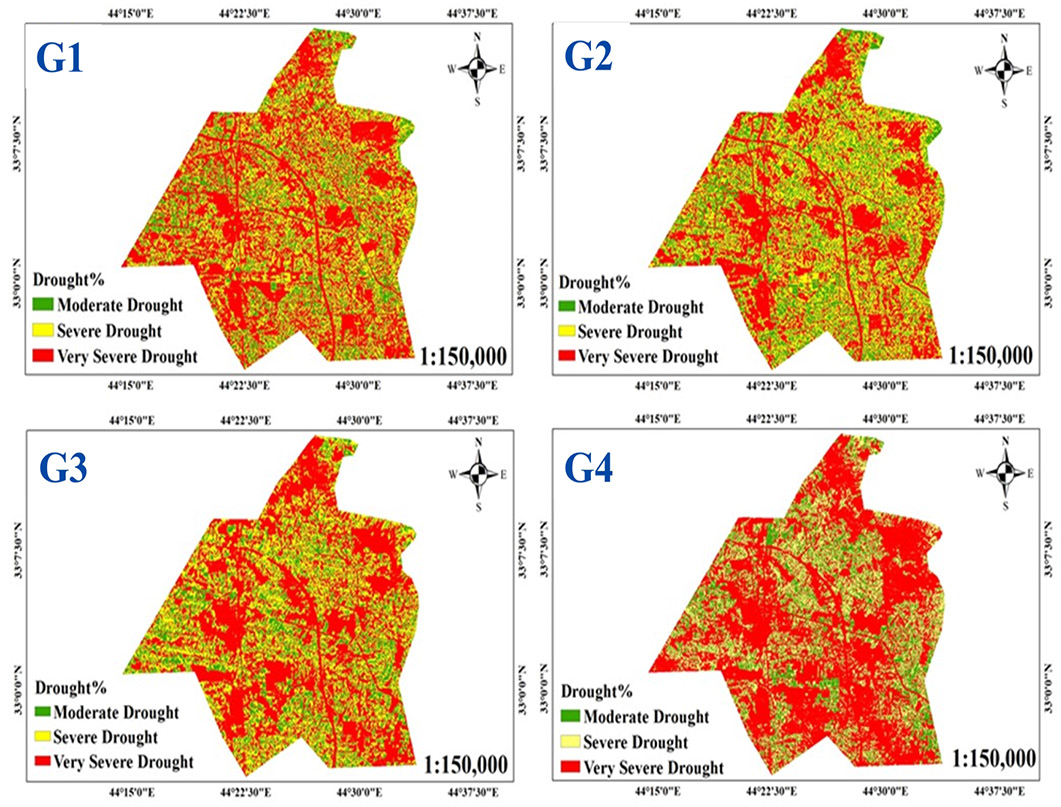
Figure 3:
Drought levels rates for thirty-five years distributed into four groups.
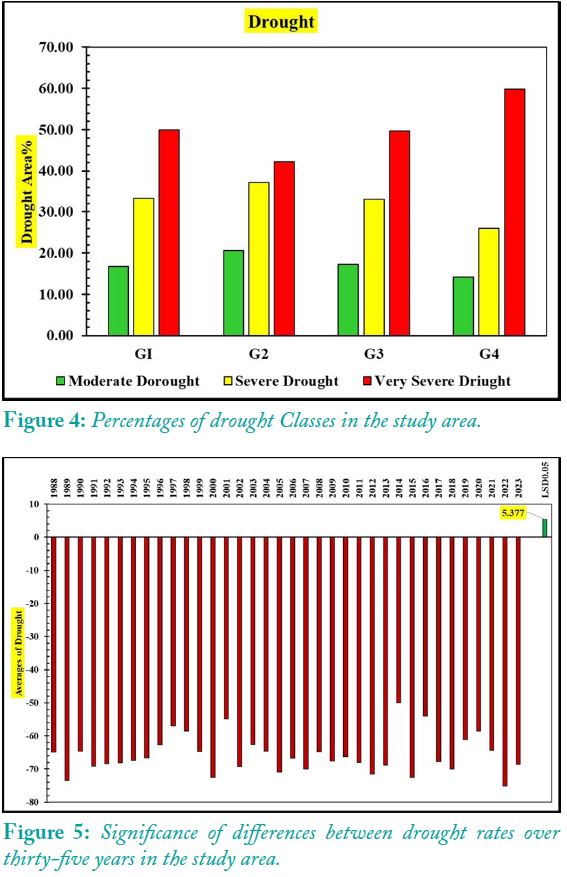
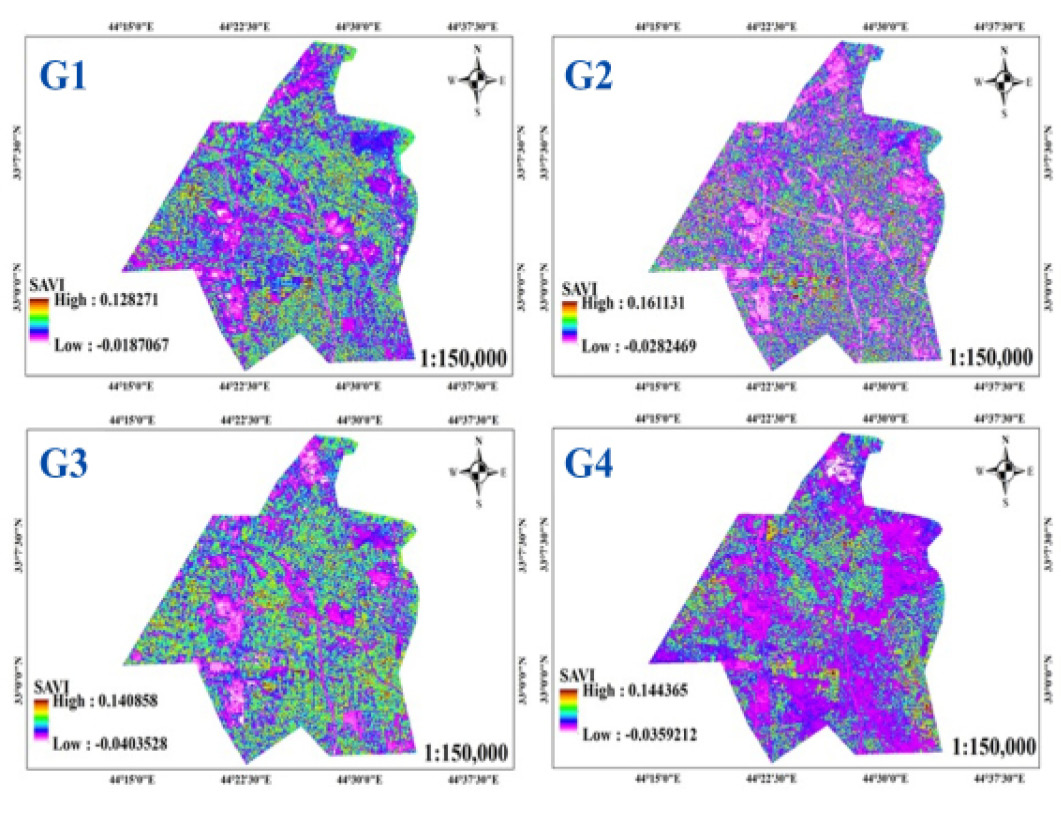
Figure 6:
SAVI rates for thirty-five years distributed into four groups.
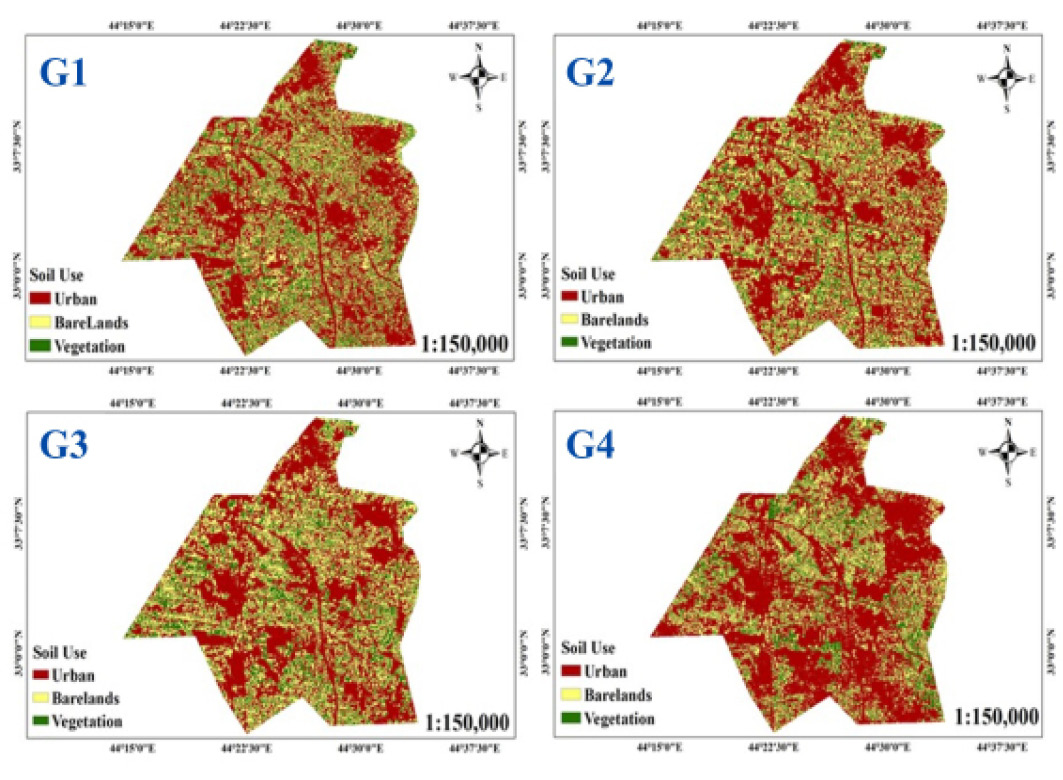
Figure 9:
Soil use rates for thirty-five years distributed into four groups.
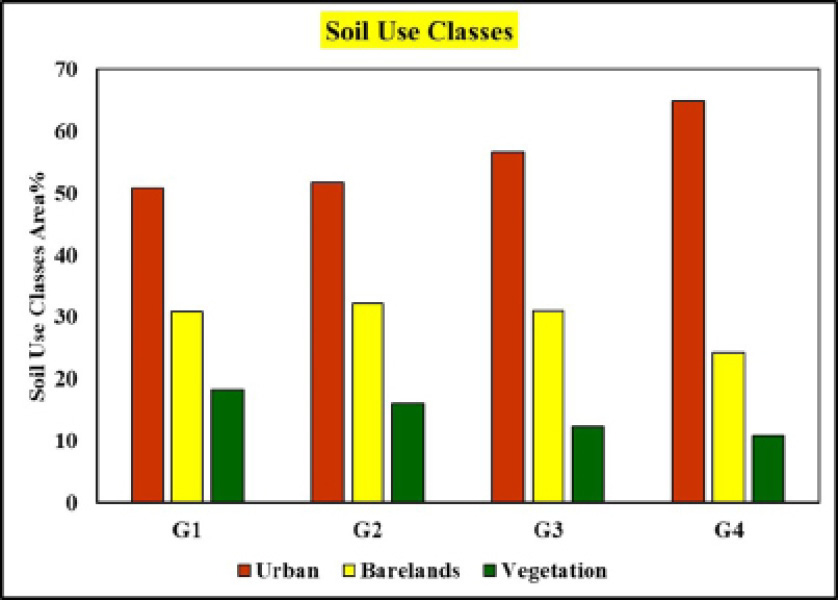
Figure 10:
Percentages of Soil Use Classes In the study area.
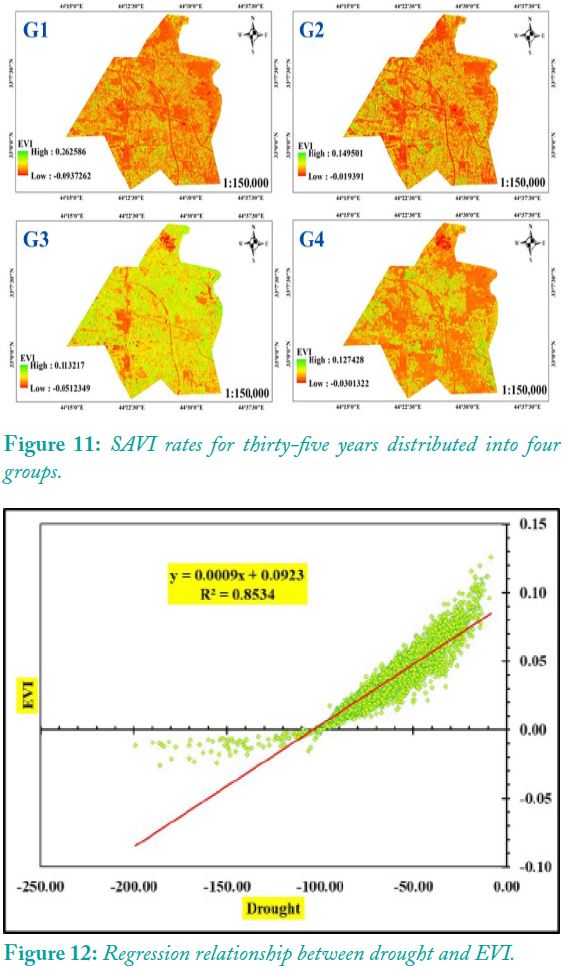
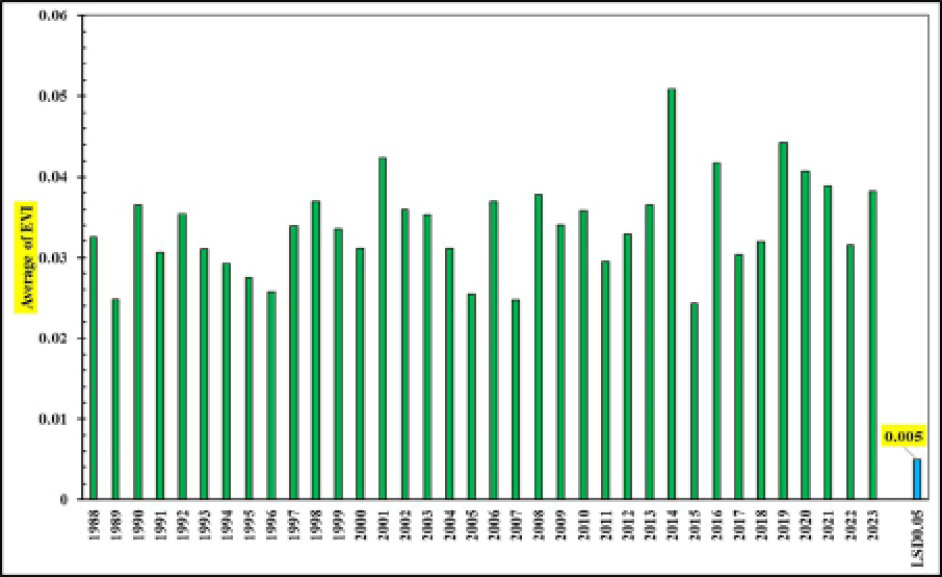
Figure 13:
Significance of differences between EVI rates over thirty-five years in the study area.
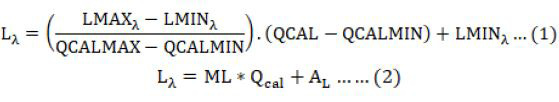
Equation 1
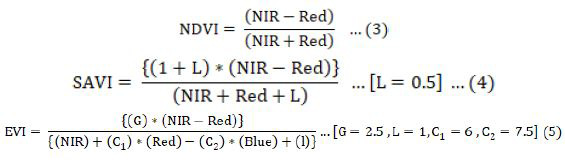
Equation 2
Equation 3

Equation 4
September 2024
Vol.37, Iss. 3, Pages 190-344


