

Age-Related Changes in the Gut Microbiota Composition of Hog Deer (Axis porcinus)


Age-Related Changes in the Gut Microbiota Composition of Hog Deer (Axis porcinus)
Hui-juan Yan1, Wei Wang2,*, Jian-qiu Yu1, Jun Yi2, Li-li Niu1, Hong-wei Chen1, Yu Qu1, Yang Pu 1, Ang Chen1, Yan Zhong1, Wei-gang Chen1 and Xing-ming Yu1
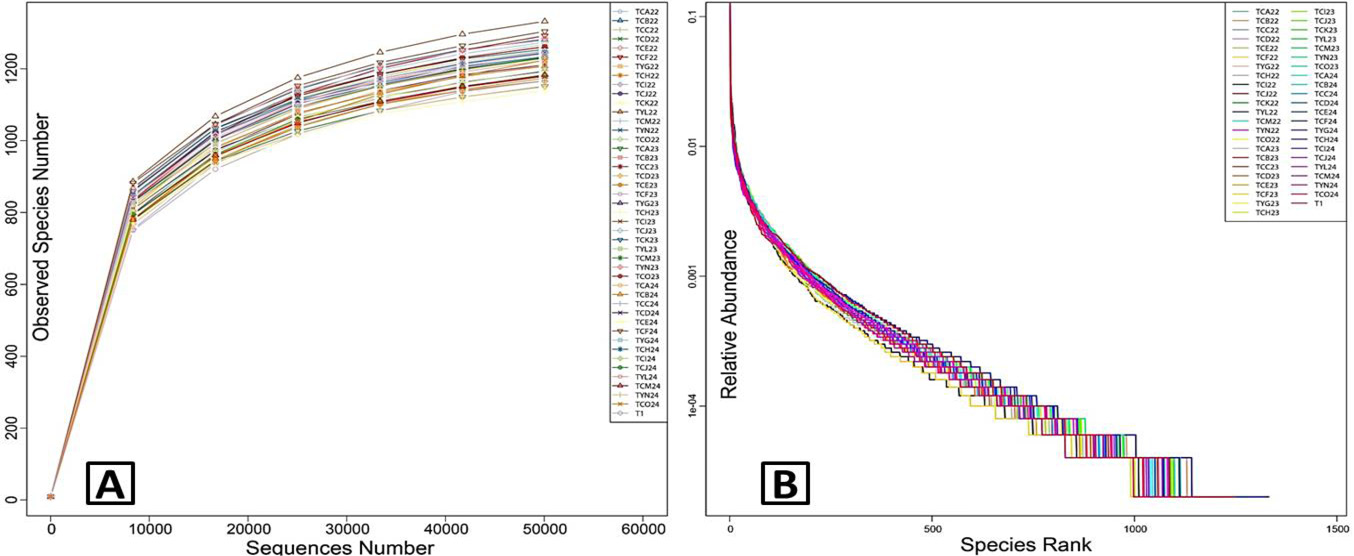
Species diversity curves. A, rarefaction curves; B, rank abundance curves. Plot A reflects indirectly the rationality of sequencing data size and richness of species in the faecal samples. When rarefaction curves tend to flatten, rational sequencing data is indicated. Plot B represents the richness and evenness of the species. The wider span of the curves illustrates the higher relative abundance of taxa in the x axis direction and the smoothness of the curves showed the evenness of bacterial species in the y axis direction. The figure legend at the top-right corner showed identification of each sample. TC, adult; TY, sub-adults, T1, infant.
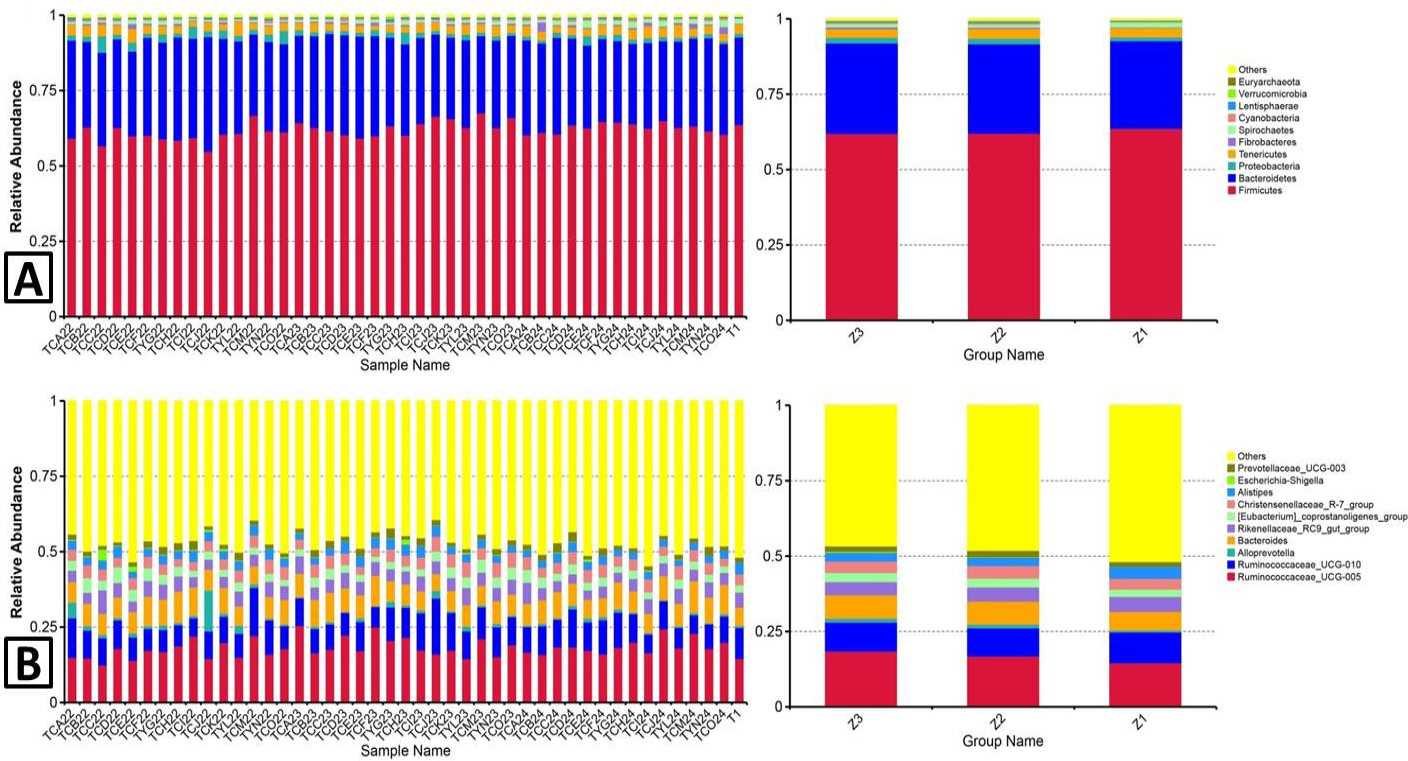
Gut microbiota composition. Faecal microbial composition of Axis porcinus at the phylum (A) and genus (B) level. Each bar represents the top 10 bacterial species ranked by the relative abundance in each individual sample or group. Z3, adult; Z2, sub-adults; Z1, infant; TC, adult; TY, sub-adults; T1, infant.
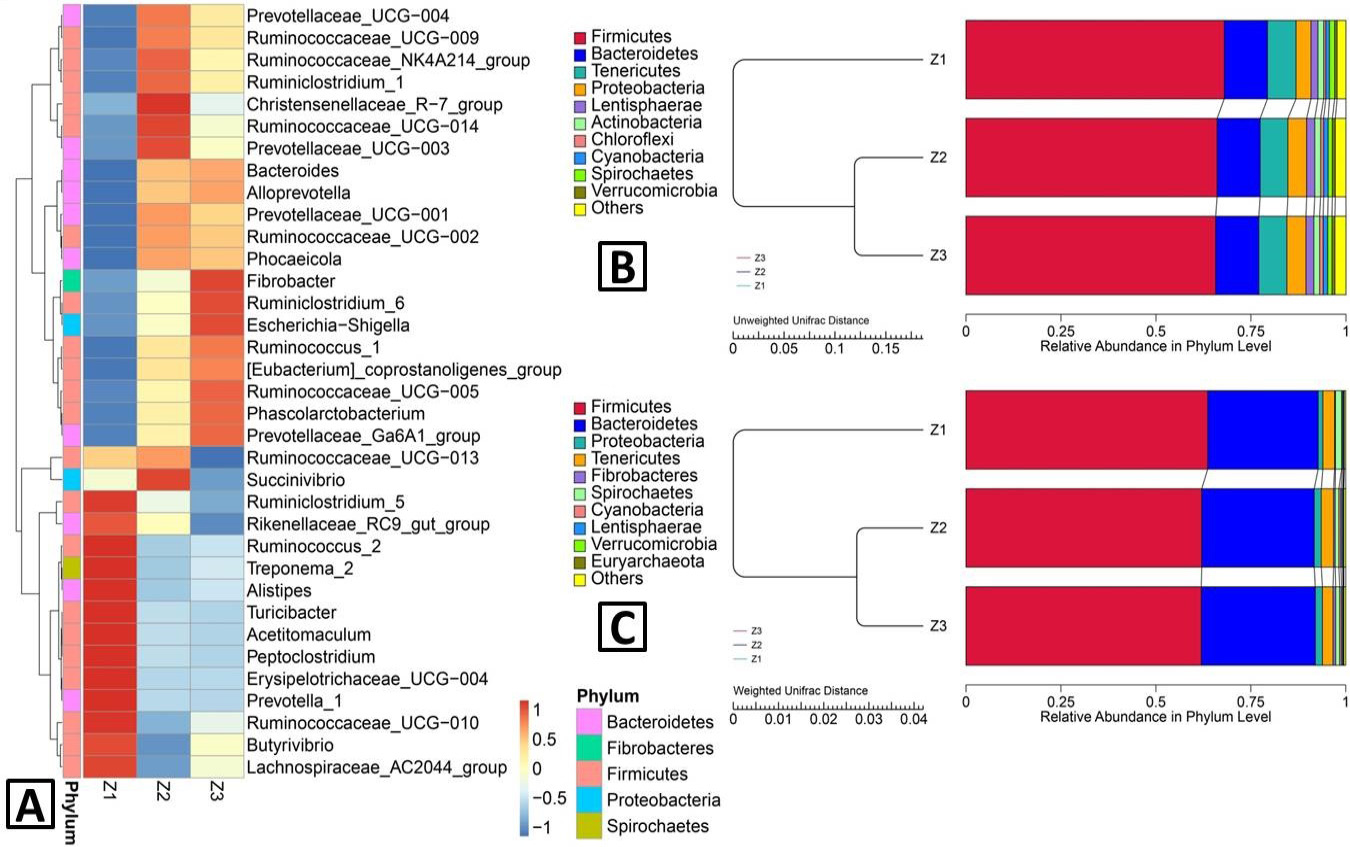
Heatmap and UPFMA (unweighted pair-group method with arithmetic mean) tree. A, The heatmap of clustering for species abundance. The information for the groups (Z1, Z2 and Z3) and the species mark were revealed along X-axis and Y-axis, respectively. The clustering tree was generated based on the relative abundance of the genera in the top 35. The relative abundance in the heatmap, which was described by colours after normalization, indicate the aggregation degree or content of the bacterial species among the samples at the genus level; B. UPMGA clustering trees—based on unweighted UniFrac distance; C, weighted UniFrac distance. The results of clustering using two distance matrices were combined with the overall percentages of relative abundance among all samples at the phylum level. Z3, adult; Z2, sub-adults; Z1, infant.
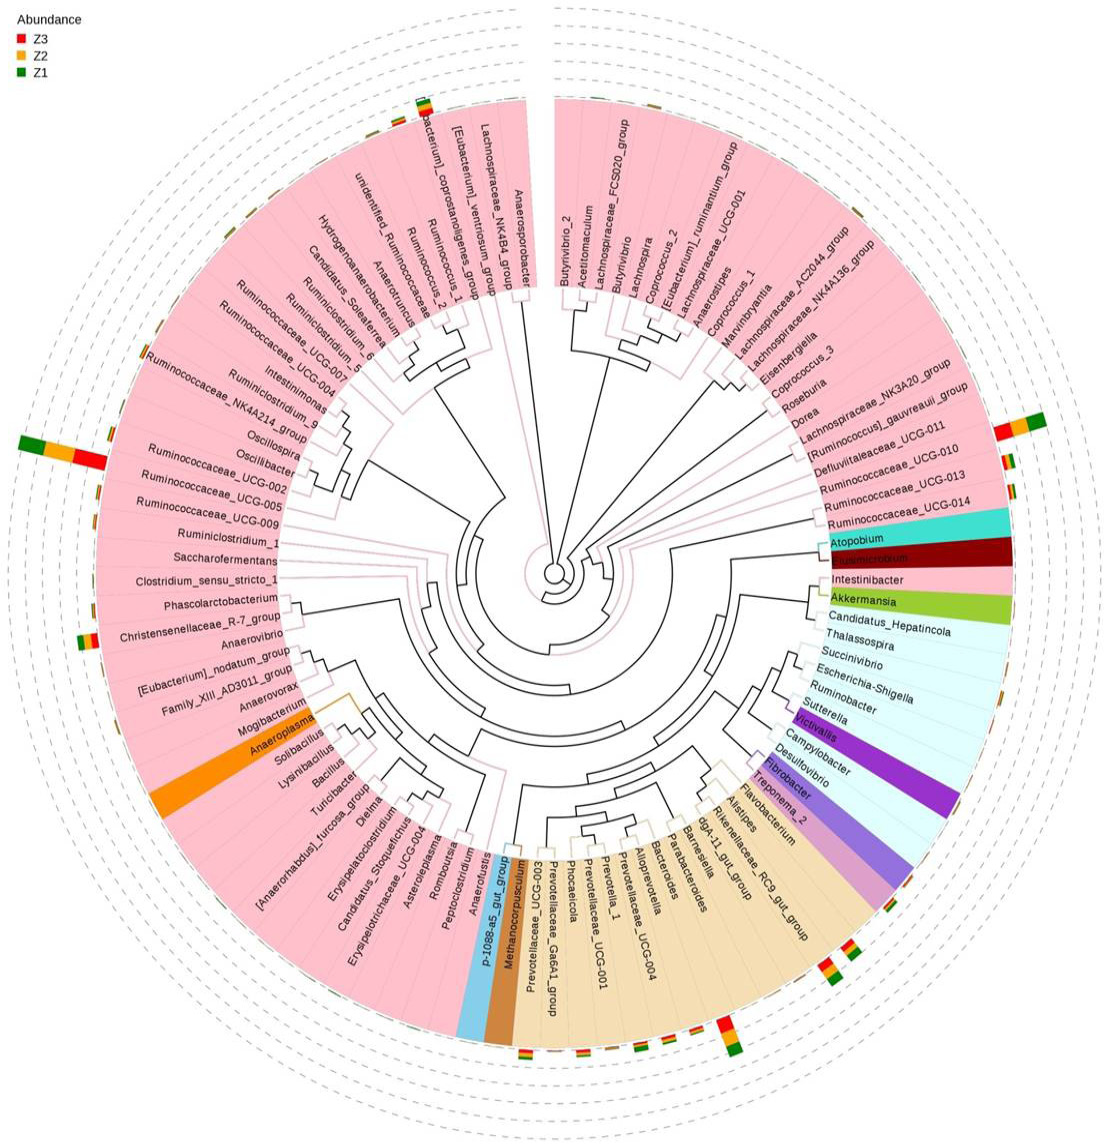
Genus phylogenetic tree. To investigate the systematic phylogenetic relationship of species at the genus level, the combination of genus relative abundance and relations among the top 100 genera is represented. The inside components of the phylogenetic tree were built with the representative sequences of the genera, and the colour of the branches represent the corresponding phyla. The outside cycle indicates the relative abundance of genera under each group, and the colour of the abundance is represented by the different groups. Z3, adult; Z2, sub-adults; Z1, infant.
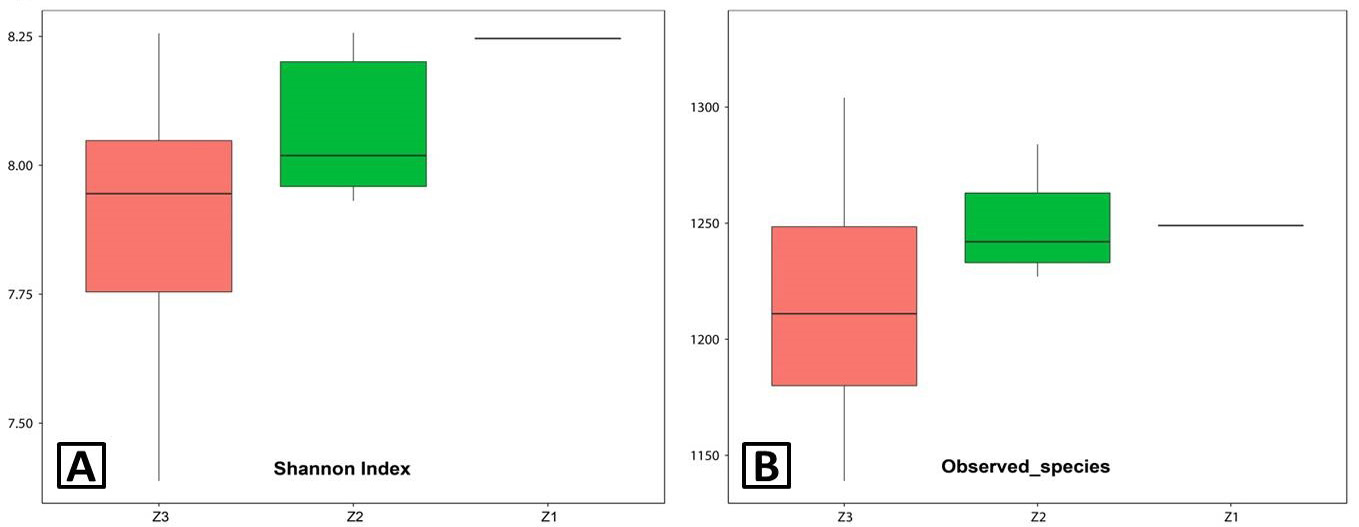
Alpha diversities. A, Shannon index; B, observed species. The comparisons for Alpha-diversity (Shannon index and observed species) are shown in the different growth stages (Z1, Z2 and Z3). Z3, adult; Z2, sub-adults; Z1, infant.
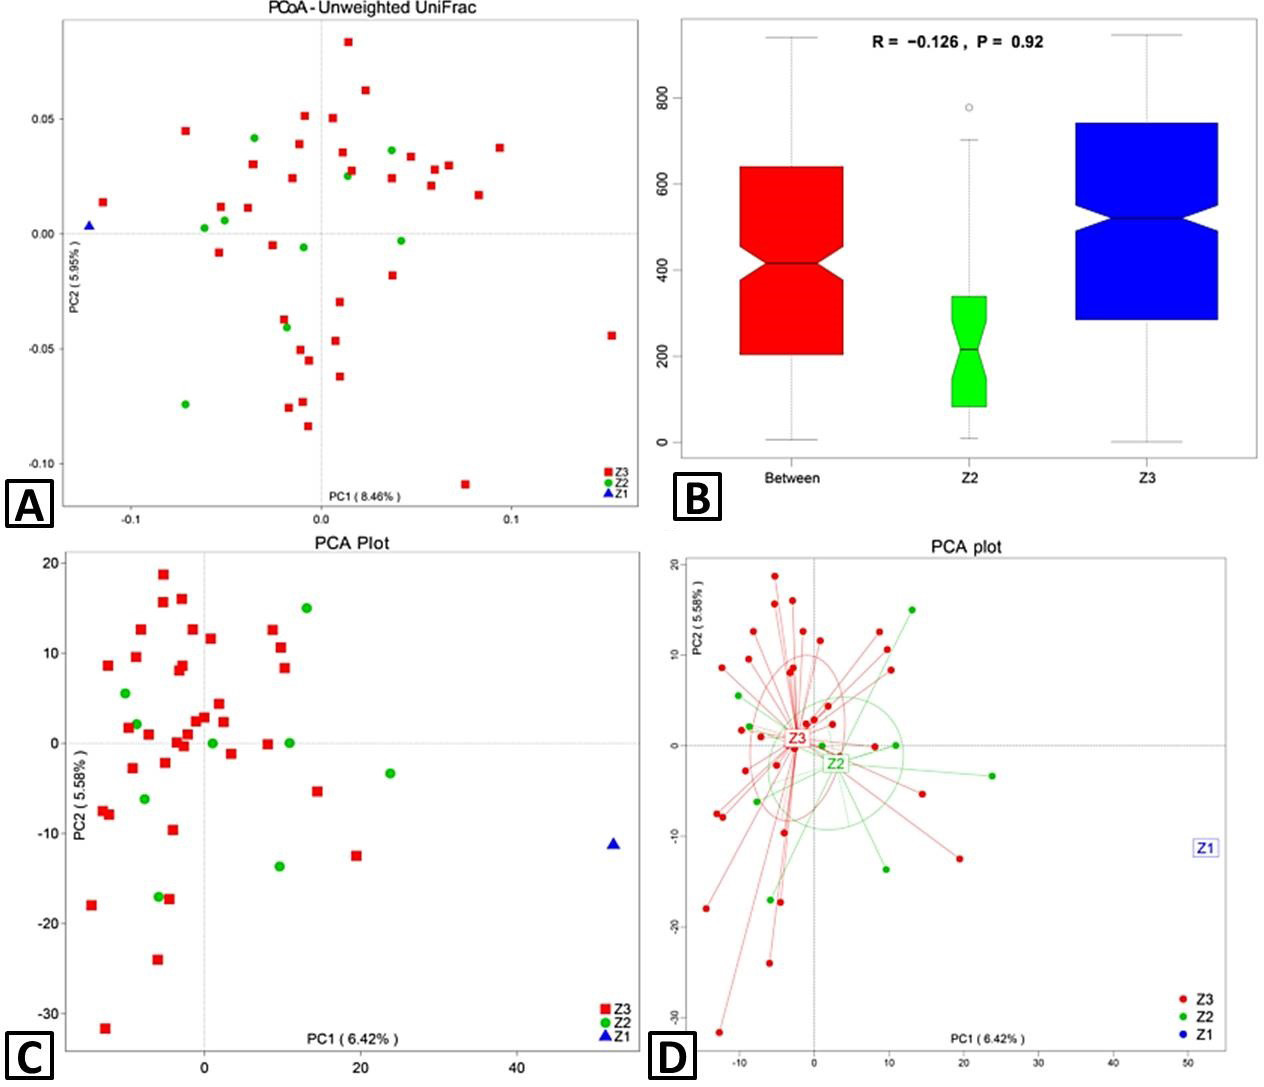
Beta diversity. Principal coordinates analysis (PCoA) 2D images were developed using unweighted UniFrac (A) and distance matrices. (B) ANOSIM (analysis of similarities) analysis. Principal component analysis (PCA) plot (C) was drawn based on OTUs levels. (D) PCA plot clustering by groups. Each sample is represented by a point with Z1 in blue triangle, Z2 in green cycle and Z3 in red square R-value: R-value range (–1, 1). Actual results are generally between 0 and 1. An R-value close to 0 represents no significant inter-group and intra-group differences, whereas the R-value close to 1 shows that inter-group differences are greater than intra-group differences. P-value: The P-value represents the confidence level of the statistical analysis; P < 0.05 reflects a statistically significant difference. The y-axis represents the distance rank between samples, and the x-axis represents the results between both groups. Intra-group results are shown for each group. In the plot, the R-value was negative and close to 0, indicating no differences, and P > 0.05 shows that this result was not statistically significant. Z3, adult; Z2, sub-adults; Z1, infant.
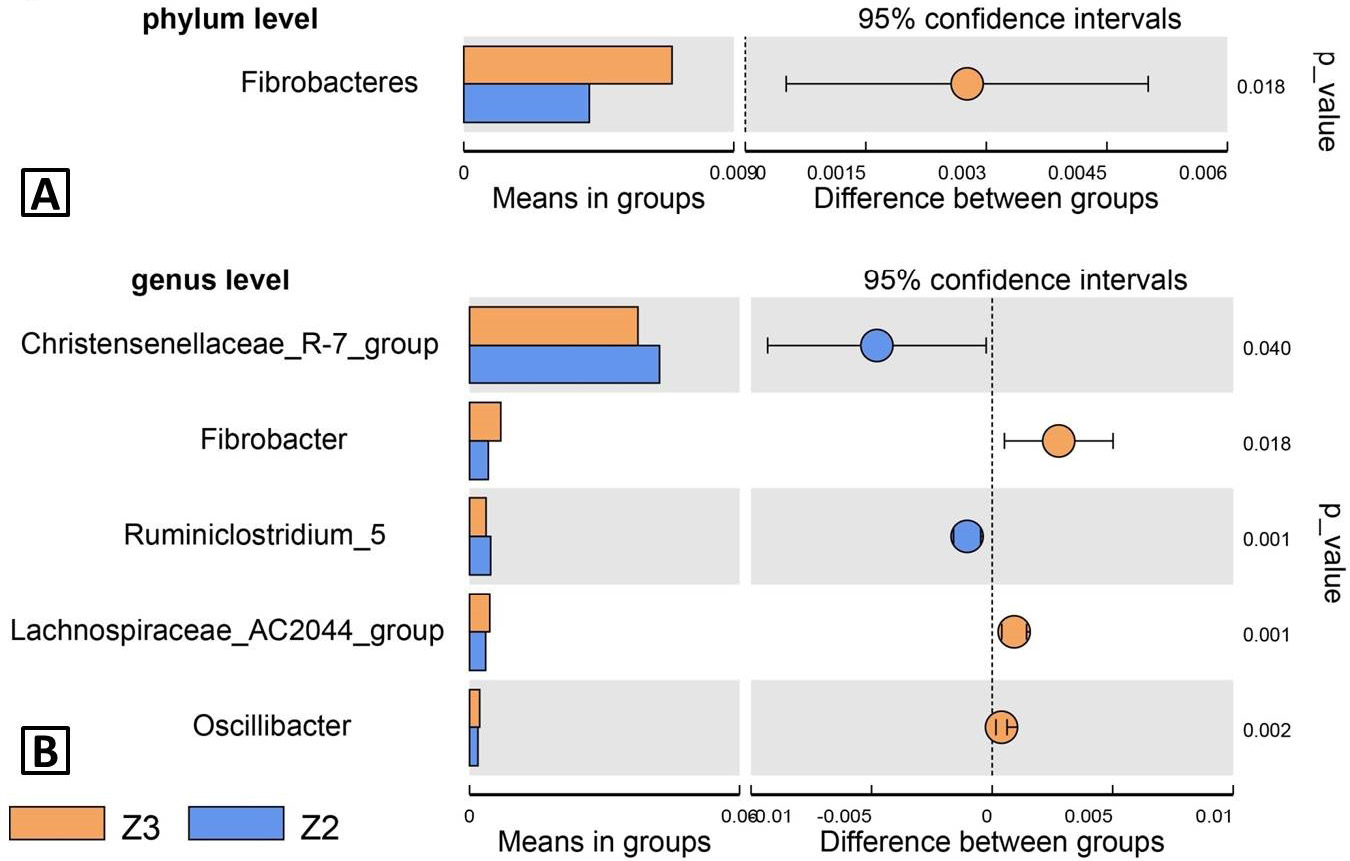
Species used to differentiate Z2 from Z3 by T-test. A, Bar plot of species with different abundance at phylum level; B, bar plot of species with different abundance at genus level. Each bar represented the mean value of relative abundance of specie. The right plot showed the confidence intervals of 95%, and the cycle whose colour represented the group was the average difference. The best values were p values. Z3, adult; Z2, sub-adults; Z1, infant.


