A Decade of Uni- Dimensional and Multidimensional Inequality: A Comparison between Irrigated and Barani Zones of Punjab, Pakistan


Research Article
A Decade of Uni- Dimensional and Multidimensional Inequality: A Comparison between Irrigated and Barani Zones of Punjab, Pakistan
Saima Asad1*, Irfan Ahmad Baig2, Abdul Saboor3 and Rashid Mahmood4
1Department of Economics, Pir Mehr Ali Shah Arid Agriculture University, Rawalpindi, Pakistan; 2Department of Social Sciences, MNAU-Multan, Pakistan; 3Department of Social Sciences, Pir Mehr Ali Shah Arid Agriculture University, Rawalpindi, Pakistan; 4Honeybee Research Institute, National Agricultural Research Centre, Islamabad, Pakistan.
Abstract | Current study is an attempt to evaluate inequality in uni-dimensional and multidimensional spectrum in agro-climatic zones of Punjab and their representative districts by using cross sectional data of HIES/PSLM of last 10 years from 2005-2006 to 2015-16. By developing an axiomatic framework 3 most widely used inequality measures (Gini-coefficient, Atkinson Measure and Generalized Entropy Index) have been estimated for uni-dimensional inequality while a single measure of Araar (2009) is used for the assessment of multidimensional inequality. Calculated outcomes shows that in a shorter span of time inequality shows fluctuating trend while in a longer span of time inequality marginally decline (increase) in zone I (Wheat/Rice Punjab), III (Cotton/Wheat Punjab), IV (lower Intensity Punjab) (II Mixed Punjab, V Rain fed/Barani Punjab). Similarly, outcomes of MDI shows consistence declining trend over time across all agro climatic zones of Punjab because a significant improvement in education and health sector has been observed over time and also population access toward basic housing services also increases that minimize the deprivation gap between upper and lower quintile population. Inequality in shorter span of time decline at minimal level but in longer span of time a substantial decline in is perceived. Finally, at districts level both uni-dimensional and multidimensional inequality declines in 2015-16 than it was in 2005-06 which indicates the decline of inequalities.
Received | November 08, 2019; Accepted | January 15, 2020; Published | April 17, 2020
*Correspondence | Saima Asad, Ph. d scholar, Department of Economics, Pir Mehr Ali Shah Arid Agriculture University, Rawalpindi, Pakistan; Email: asad.saima@ymail.com
Citation | Asad, S., I.A. Baig, A. Saboor and R. Mahmood. 2020. A decade of uni- dimensional and multidimensional inequality: a comparison between irrigated and barani zones of Punjab, Pakistan. Pakistan Journal of Agricultural Research, 33(2): 192-201.
DOI | http://dx.doi.org/10.17582/journal.pjar/2020/33.2.192.201
Keywords | Inequality, Uni-dimensional, Multidimensional, Agro-climatic zones and Punjab
Introduction
Few decades back development policy makers took keen interest to promote the living standard of messes residing in least developed economies through appropriate economic policies related to growth by reducing poverty and inequality. However, the linkages between growth, poverty and inequality are non-linear, complicated and path dependent as mentioned by Kuznets (1955) that initial stage of economic growth adversely affect the income disparities but later on, these disparities in income decline when higher economic growth makes economy stable. Bourguignon (2004) and Kakwani and Son (2008) stretched Kuznets’ views and further explored that particular decline in income disparities with higher growth causes the trickle down of growth benefits toward lower income groups that leads to decline in poverty.
In case of developing economies like Pakistan, Easterly (2003) highlighted the linkage between growth, poverty and inequality was under control and explained that except 1990s era, Pakistan achieved incredible growth performance in last five decades of the 20th century, but due to poor trickle down of growth benefits toward lower income groups, both poverty and inequality did not decline as much as plenteous growth, that’s why Pakistan is ranked poorly (144th on the HDI out of 178 countries) in UNDPs Human Development index 2018 report. Shorrocks and Van der Hoeven (2004) favored above views and stated that economic growth is blunt tool to reduce poverty and inequality if its benefits are penetrating in a few rich hands and do not deliver toward poor community. Furthermore, Kemal and Naseem (1994) argued that increase in unemployment, weaker government policies, poor tax collection method and wrong endowment of subsides to poor income quintiles are the reasonable causes of varying inequalities in least developed economies.
To stretch above views in wider sense, a stream of literature has been found in last five decades that explore phenomenal variation in inequality for Pakistan and its urban and rural regions. In the era of 1960s, a significant decline in inequality at national and regional level had been observed due to excellent economic growth, green revolution and advancement of technology in agriculture sector (Mahmood 1984; Kemal and Naseem, 1994; Anwar, 2007). Although, this decline in inequality was short lived and in next couple of decades (1970s and 1980s) an unpredicted increased in inequality at national and regional level had been perceived in spite of exceptional growth performance and up rise the inflow of money (Kemal and Nasseem 1994; Haq, 1999; Jamal, 2006). Kemal (2006) further explained in detailed that rise in growth and inflow of money boost employment and real wages in industrial as well as agriculture sector that lead to an increase in rate of inflation which ultimately raised the income disparities at national and regional level in Pakistan. However, next era of 1990s had shown minimal decline in inequality at national and regional level in Pakistan despite of various problems like poor economic growth, poor governance, and numerous droughts (Zakir and Idress, 2009; Ahmad, 2001). Finally, in the last decades of 2000s, although growth performance are still poor, but aggressive strategy of government as compared to 1990s cause fast trickle down of growth benefits from few rich hands to lower income quintile that ultimately leads to substantial decline in inequality (GoP, 2011; Rehman et al., 2015).
A long series of studies have been found that explore inequality in uni-dimensional perspective by using various inequality approaches and consumption expenditure as a basic indicator as use by Mahmood (1984) who had calculated inequality in 1970s era in Pakistan and its representative regions by employing various data sets of from Federal Bureau of Statistics along with most widely used measures like Gini-coefficient, Standard deviation of log income, coefficient of variation, Atkinson and Theil’s index. Results of the study concluded that at national and regional level in Pakistan inequality increased from 1971 to 1979. De Kruijk et al. (1985) examined inequality in Pakistan and its representative regions by using two survey data sets of 1970 and 1979. For the assessment of results all possible measures of income inequality (Gini-coefficient, Theil’s Coefficient, Coefficient of Variation and Standard Deviation of Log) were used. Results of the study are consistence with Mahmood (1984) paper which suggested that in a given period of time at national and regional level in Pakistan inequality increased. Kemal and Naseem (1994) discussed the trend of inequality in Pakistan and its rural and urban regions in the era of 1980s. Given study calculated results by using all available data set of PIHS for discussed era. Similar to preceding discussions, a well-known index of Gini-Coefficient was used to measure the extent of problem. Results of the study concluded that inequality showed fluctuating trend from one year to next at national and regional level in Pakistan in a discussed era while overall scenario evaluated that since 1981 to 1990 inequality decline in Pakistan from 42.80 percent to 40.70 percent. After a wider description of uni-dimensional inequality, it has been witnessed that inequality is not a single dimensional issue rather it is a multidimensional concept but according to the importance of multidimensional issue no special focus has been gained by inequality like poverty that’s why internationally and nationally a very scare literature has been found that explored inequality in multidimensional perspective. Outcomes revealed that inequality is sensitive to aversion parameter and with increase the value of aversion parameter inequality increased. Rohde and Guest (2013) examined multidimensional inequality in US from 1990 to 2007 by using three basic dimensions health, education and income and Maasoumi (1986) indexing approach. Calculated measures revealed that inequality showed increasing trend in study area over time. While nationally, Khalid et al. (2017) analyzed uni-dimensional and multidimensional inequalities at national, sub national and regional level in Pakistan between 1998-99 and 2013-14 by using Arrar (2009) methodology and concluded that uni-dimensional (multidimensional) inequality is purely urban (rural) phenomena for Pakistan however, over the period of time declining trend of inequality had been noticed for both measures. After a comprehensive description, it is observed that no study has precisely found, that explains the issue of uni-dimensional and multidimensional inequality in agro-climatic zones of Punjab and its districts by using HIES data of last 10 years, that’s why the research questions of what is the situation of uni-dimensional and multidimensional inequality in irrigated and Barani (agro-climatic) zones of Punjab in last 10 years is yet required to be addressed. Therefore, novelty of current study is that it made special effort to bridge up above discussed gap by answering the particular question under the light of three basic objectives; first, this study accesses the uni-dimensional inequality through three well-known measures namely Gini-coefficient, Atkinson measure and Theil’s Index in last 10 years. Second, this study measures the multidimensional inequality through Arrar (2009) methodology in last 10 years. Third, this study draws a suitable policy matrix under the light of estimated outcomes that helps to reduce current issue in study area.
Table 1: Arrangements of Irrigated and Barani (Agro-climatic) Zones along with Districts in Punjab.
| Sr. No. | Agro-climatic zones | Districts |
| I | Wheat/Rice Punjab | Sialkot, Gujrat, Gujranwala, Lahore, Kasur, Sheikupura, Narowal*, Mandi Bahauddin*, Hafizabad* and Nankana Sahib* |
| II | Mixed Punjab | Sargodha, Khushab, Jhang, Faisalabad, T.T. Singh, Okara and Chiniot* |
| III | Cotton Wheat Punjab |
Sahiwal, Bahawalnagar, Bahawalpur, Rahim Yar Khan, Multan, Vehari, Khanewal, Lodhran, Pakpatan |
| IV |
Lower Intensity Punjab |
D.I. Khan, Rajanpur, Muzaffagarh, Layyah, Mianwali, Bhakkhar and D.G. Khan. |
| V |
Rainfed/Barani Punjab |
Attock, Rawalpindi, Jehlum, Chakwal* and Islamabad |
In a table districts with * are newly created from 1989-2010 (Pinckney and Pinckney, 1989).
Table 2: An overview of dimensions and sub-dimensions for problem under discussion.
| Dimensions | Sub-dimensions |
|
Yd= Expenditure |
Per head consumption expenditure for Uni-dimensional inequality |
| Education | Highest Years of Education |
| Can a person Read and write in any language? | |
| Can a person solve simple sums? | |
| Health | Purity of Water |
| Pre-natal | |
| Immunization of the children | |
| Post-natal | |
| Housing and Services | Occupancy Status |
| Electricity | |
| Gas | |
| Telephone | |
| Safe Sanitation system |
Material and Methods
For the measurement of appropriate outcomes, problem under study utilized well-accepted cross-sectional data of HIES/PSLM from 2010-11 to 2015-16 i.e. collected from Pakistan Bureau of Statistics (PBS). Problem under discussion has been done in two steps, initially, uni- dimensional inequality is measured and per head consumption expenditure is taken as a welfare indicator that is calculated by dividing total expenditure over adult equivalent household’s size.
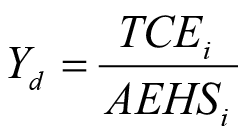
In an equation above ‘Yd’ signifies the households per individual consumption expenditure while “TCEi” represents households overall consumption expenditure that are calculated by taking the expenses on all purchase apart from taxes, mirage, fines and expenses on durable goods. Finally, “AEHSi” represents adult equivalent household size that is intended by accommodating the nutrients requirements of family members, which assign the weight of 0.8 (1) to less (greater) than 18 years old (CPRSPD, 2008).
In a second step, issue of inequality has been addressed in multidimensional spectrum by involving a series of dimensions and sub dimensions. The detail description of particular dimensions and sub-dimensions is as follow.
Uni-dimensional inequality
Traditionally, inequality is describes as a single dimension concept and Gini-coefficient, Atkinson and Generalized entropy index are widely known measures are used as an indexing approach along with per head consumption expenditure as a welfare indicator to calculate it. Generally, Gini-Coefficient deals with how much inequality exists in the economy under consideration and explains as “the ratio of the area between the Lorenz Curve and the line of equality, to the area of triangle below the line”. Statistically, Gini-coefficient is written as:
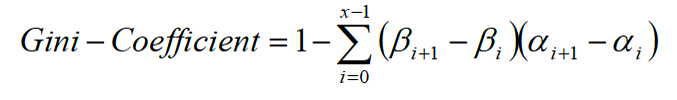
In an equation ‘βi’ is the cumulative population share while ‘αi’ is the cumulative consumption expenditure share. However, the value of Gini-coefficient varies from 0 to 1. ‘0’ represents perfect equality while ‘1’ represents perfect inequality (Asad and Ahmad, 2011).
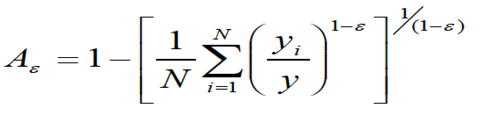
Atkinson measure
Like Gini-coefficient, Atkinson (1970) presented another class of inequality that explore current issue in more practical ways by using sensitivity parameter epsilon (ɛ) which varies from 0.5 to 2. Current measure mostly describes the sensitivity of inequality among lower income groups and if inequality increased with varying value of epsilon it means inequality is much sensitive toward lower income group which simple means inequality is getting worsen among lower income groups with varying value of epsilon.
Generalized entropy index
Atkinson (1970) and Maio (2007) presented another class of inequality known as generalized entropy index that also estimates inequality in uni-dimensional spectrum by using sensitivity parameter theta (α). Particular class of inequality has advantage that it explores the sensitivity of inequality among upper income group. Commonly, generalized entropy index takes value 0 and 1. The value ‘0’ symbolizes mean log deviation or Theil’s L index while the value ‘1’ demonstrates the Theil’s T index. However, it has been noted that if the value of inequality increased with varying value of theta it means inequality become sensitive to upper income group which simply describes that inequality deteriorate among upper income group with varying value of theta.
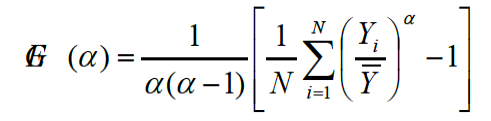
In an equation, ‘N’ and ‘Yi’ shows the total population and per head consumption expenditure while ‘α’ the weighted parameter with value ‘0’ and ‘1’ represents Theil’s L and Theil’s T measures.
Multidimensional inequality
Hicks (1997) calculated inequality in multidimensional spectrum by employing inequality adjusted human development index, commonly known as welfare index which is statistically written as:
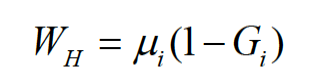
Here WH is the representative of Welfare index while ‘µi’ is the arithmetic means and ‘Gi’ is the Gini-coefficient across each dimension. In the assessment of multidimensional inequality given measure is considered as a very simple measure because it does not involve any sensitivity parameter ‘α’ and substitution parameter ‘β’. Due to these major disadvantages given measure is unable to predict actual situation of multidimensional inequality among the discuss population. To overcome above discuss disadvantages current study used more modified version of multidimensional inequality assessment index presented by Arrar (2009). Particular index is statistically explore as:
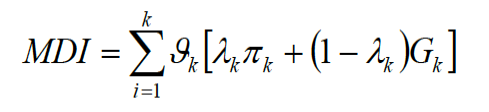
In an equation ‘K’ is the representative of total number of dimensions used in the study, ‘ϑk’ is the weight that has been given to each dimension, ‘πk’ and ‘Gk’ are the Gini-coefficient and concentration indices of ‘k’ dimensions in both relative and absolute term, Finally ‘λk’ is the sensitivity parameter which takes value from 0 to 1. The value ‘0’ represents that discuss dimensions are perfect substitute to each other while value ‘1’ represents that these values are perfect complement to each other.
Results and Discussions
The situation of uni-dimensional inequality in Irrigated and Barani (agro-climatic) zones of Punjab (Table 1) for last 10 years from 2005-06 to 2015-16, calculated measures show that since 2005-06 to 2015-16 with little span of time especially gap of year or two inequality show fluctuating trend over time across all agro-climatic zones of Punjab. However, with the wider gap of 10 year, numerical measures of all zones ( I, II, III, IV and V) expresses that inequality was 25.90%, 25.10%, 27.10%, 22.70% and 21.90% in 2005-06 while 23.90%, 27.50%, 24.30%, 22.30% and 25.90% in 2015-16 these measures reveal that since 2005-06 to 2015-16 inequality is marginally declined in zone I, III and IV while in zone II and V increase in inequality has been observed which means during the growth process trickle down of growth benefits toward lower income group has been taken place in zone I, III and IV while in zone II and V despite of positive economic growth inequality has been worsen which means growth benefits are distributed among upper income groups and nothing trickle down toward lower income groups. Finally, comparative measures of all the zones show that in 2005-06 households of cotton wheat zone (III) are harshly effected with uni-dimensional inequality while households of Barani zone (V) were least affected with inequality. Similarly, in 2015-16 comparative measures show that households of mixed Punjab (II) are harshly affected with inequality while households of lower intensity Punjab (IV) are least affected with inequality (Table 3).
Like above, trend of inequality across the Irrigated and Barani (agro-climatic) zones of Punjab is remained almost similar for Atkinson and Generalized Entropy measure over time. However, outcomes of Atkinson measure for zone I, II, III, IV and V in 2005-06 reveals that with epsilon (0.5) inequality was 5.80%, 5.5%, 6.20%, 4.40% and 4.10% which increase to 10.60%, 9.90%, 11.40%, 8.20% and 7.60% with epsilon measure (1) and further increase to 18.40%, 16.90%, 20.20%, 14.60% and 13.50% with epsilon measure (2). It has been observed that in 2005-06 with varying value of epsilon from 0.5 to 2 inequality increase which means inequality is sensitive toward lower income groups and with increase in income/ expenditure inequality get deteriorates among the population of lower income group. Similarly, for year 2015-16 with epsilon (0.5) inequality is 4.50%, 6.60%, 5.00%, 4.10% and 6.00% in zone I, II, III, IV and V which increase to 8.70%, 11.80%, 9.10%, 7.70% and 10.60% with epsilon measure (1) and further increase to 15.90%, 19.90%, 15.70%, 13.70% and 17.80% with epsilon measure (2). It has also shown that with varying value of epsilon from 0.5 to 2 inequality has been increased which means in 2015-16 inequality is also sensitive to lower income groups and with varying income/expenditure inequality get worsens among population of lower income groups. Finally, it has been noticed that like Gini-coefficient, outcomes of Atkinson measure also show that in zone I, III and IV inequality has been declined while in zone II and V inequality has been increased from 2005-06 to 2015-16.
Table 3: Uni-dimensional Outcomes of Inequality for last 10 years in Irrigated and Barani (agro-climatic) Zones of Punjab.
| Years | Zones | Gini- Coeff. |
Aε (0.5) |
Aε(1) |
Aε(2) |
GE(0) | GE(1) |
| 2005-06 | I | 0.259 | 0.058 | 0.106 | 0.184 | 0.112 | 0.131 |
| II | 0.251 | 0.055 | 0.099 | 0.169 | 0.104 | 0.123 | |
| III | 0.271 | 0.062 | 0.114 | 0.202 | 0.121 | 0.136 | |
| IV | 0.227 | 0.044 | 0.082 | 0.146 | 0.085 | 0.096 | |
| V | 0.219 | 0.041 | 0.076 | 0.135 | 0.079 | 0.089 | |
| 2007-08 | I | 0.271 | 0.060 | 0.112 | 0.195 | 0.118 | 0.130 |
| II | 0.261 | 0.057 | 0.106 | 0.187 | 0.112 | 0.127 | |
| III | 0.266 | 0.065 | 0.113 | 0.185 | 0.120 | 0.154 | |
| IV | 0.253 | 0.057 | 0.102 | 0.174 | 0.109 | 0.129 | |
| V | 0.235 | 0.047 | 0.087 | 0.153 | 0.091 | 0.103 | |
| 2010-11 | I | 0.229 | 0.043 | 0.081 | 0.147 | 0.085 | 0.092 |
| II | 0.270 | 0.063 | 0.114 | 0.194 | 0.120 | 0.147 | |
| III | 0.261 | 0.056 | 0.104 | 0.182 | 0.110 | 0.123 | |
| IV | 0.239 | 0.048 | 0.089 | 0.156 | 0.092 | 0.103 | |
| V | 0.243 | 0.053 | 0.095 | 0.165 | 0.100 | 0.122 | |
| 2011-12 | I | 0.232 | 0.043 | 0.082 | 0.150 | 0.085 | 0.089 |
| II | 0.247 | 0.050 | 0.093 | 0.166 | 0.098 | 0.108 | |
| III | 0.238 | 0.046 | 0.087 | 0.154 | 0.092 | 0.110 | |
| IV | 0.223 | 0.040 | 0.076 | 0.138 | 0.080 | 0.085 | |
| V | 0.247 | 0.053 | 0.097 | 0.168 | 0.102 | 0.119 | |
| 2013-14 | I | 0.253 | 0.055 | 0.101 | 0.174 | 0.106 | 0.123 |
| II | 0.233 | 0.045 | 0.085 | 0.152 | 0.088 | 0.096 | |
| III | 0.247 | 0.051 | 0.094 | 0.168 | 0.099 | 0.111 | |
| IV | 0.260 | 0.055 | 0.102 | 0.182 | 0.108 | 0.116 | |
| V | 0.278 | 0.065 | 0.118 | 0.199 | 0.125 | 0.145 | |
| 2015-16 | I | 0.239 | 0.045 | 0.087 | 0.159 | 0.091 | 0.097 |
| II | 0.275 | 0.066 | 0.118 | 0.199 | 0.126 | 0.151 | |
| III | 0.243 | 0.050 | 0.091 | 0.157 | 0.096 | 0.110 | |
| IV | 0.223 | 0.041 | 0.077 | 0.137 | 0.080 | 0.087 | |
| V | 0.259 | 0.060 | 0.106 | 0.178 | 0.113 | 0.137 |
Table 4: Multidimensional Outcomes of Inequality for last 10 years in Irrigated and Barani (agro-climatic) Zones of Punjab.
| Years | Zo-nes | λ=0 | λ=0.1 | λ=0.5 | λ=0.9 | λ=1 | Dimensional Contribution (λ=0) | ||
| D1 | D2 | D3 | |||||||
| 2005-06 | I | 0.159 | 0.168 | 0.208 | 0.249 | 0.260 | 49.83 | 32.66 | 17.51 |
| II | 0.170 | 0.181 | 0.221 | 0.261 | 0.271 | 40.68 | 38.49 | 20.83 | |
| III | 0.173 | 0.182 | 0.223 | 0.262 | 0.273 | 40.95 | 30.11 | 28.95 | |
| IV | 0.177 | 0.189 | 0.232 | 0.276 | 0.287 | 41.06 | 35.00 | 23.94 | |
| V | 0.189 | 0.198 | 0.243 | 0.287 | 0.298 | 33.04 | 48.40 | 18.55 | |
| 2007-08 | I | 0.154 | 0.163 | 0.201 | 0.237 | 0.246 | 51.12 | 32.19 | 16.70 |
| II | 0.161 | 0.170 | 0.207 | 0.243 | 0.252 | 46.30 | 38.73 | 14.97 | |
| III | 0.160 | 0.170 | 0.211 | 0.252 | 0.262 | 46.13 | 27.86 | 26.01 | |
| IV | 0.170 | 0.180 | 0.216 | 0.252 | 0.263 | 46.10 | 28.56 | 25.33 | |
| V | 0.165 | 0.177 | 0.223 | 0.268 | 0.280 | 33.89 | 49.65 | 16.46 | |
| 2010-11 | I | 0.145 | 0.154 | 0.191 | 0.229 | 0.238 | 46.53 | 35.09 | 18.38 |
| II | 0.149 | 0.158 | 0.191 | 0.225 | 0.233 | 41.29 | 37.83 | 20.87 | |
| III | 0.144 | 0.153 | 0.188 | 0.224 | 0.234 | 36.94 | 37.78 | 25.28 | |
| IV | 0.150 | 0.160 | 0.195 | 0.231 | 0.240 | 40.32 | 42.28 | 17.40 | |
| V | 0.161 | 0.171 | 0.212 | 0.254 | 0.264 | 35.61 | 50.73 | 13.65 | |
| 2011-12 | I | 0.135 | 0.144 | 0.179 | 0.213 | 0.222 | 53.57 | 30.80 | 15.63 |
| II | 0.142 | 0.151 | 0.188 | 0.225 | 0.234 | 51.54 | 27.34 | 21.12 | |
| III | 0.141 | 0.150 | 0.185 | 0.220 | 0.230 | 45.43 | 31.60 | 22.98 | |
| IV | 0.149 | 0.158 | 0.193 | 0.229 | 0.237 | 48.09 | 31.18 | 20.73 | |
| V | 0.151 | 0.163 | 0.200 | 0.240 | 0.249 | 49.08 | 36.35 | 14.57 | |
| 2013-14 | I | 0.136 | 0.145 | 0.184 | 0.222 | 0.231 | 47.41 | 29.21 | 23.38 |
| II | 0.148 | 0.157 | 0.195 | 0.232 | 0.241 | 41.49 | 33.61 | 24.90 | |
| III | 0.146 | 0.155 | 0.193 | 0.230 | 0.240 | 44.68 | 25.38 | 29.94 | |
| IV | 0.147 | 0.154 | 0.190 | 0.225 | 0.234 | 48.96 | 26.10 | 24.94 | |
| V | 0.153 | 0.163 | 0.202 | 0.240 | 0.250 | 38.47 | 36.38 | 25.15 | |
| 2015-16 | I | 0.138 | 0.147 | 0.184 | 0.222 | 0.230 | 46.86 | 36.86 | 16.28 |
| II | 0.146 | 0.155 | 0.192 | 0.230 | 0.238 | 44.46 | 38.70 | 16.85 | |
| III | 0.142 | 0.151 | 0.188 | 0.225 | 0.234 | 40.70 | 38.90 | 20.40 | |
| IV | 0.153 | 0.163 | 0.199 | 0.236 | 0.244 | 47.12 | 37.29 | 15.60 | |
| V | 0.147 | 0.155 | 0.190 | 0.227 | 0.235 | 34.84 | 49.72 | 15.44 | |
D1: Education; D2: Health and D3: Housing Services.
Final measure of generalized entropy index reveals a similar trend of inequality like above, outcomes shows that with a little span of time one or two year inequality show fluctuating trend over time while with the wider of gap of 10 year such measure also shows that zone I, II and IV shows declining trend of inequality while on the contrary, zone II and V shows increasing trend of inequality over time. Numerical measure for year 2005-06 reveals that in all five zone inequality was 11.20%, 10.40%, 12.10%, 8.50% and 7.90% when theta is (0) while such measure increases to 13.10%, 12.30%, 13.60%, 9.60% and 8.90% when theta is (1). It shows that inequality is also sensitive to upper income group in 2005-06 because with varying value of theta from 0 to 1 inequality increases which means increase in income/ expenditure of households of upper income group worsens the inequality in all five agro-climatic zones of Punjab. However, outcomes of year 2015-16 also show similar trend of inequality and with varying value of theta from 0 to 1 inequality has been worsen across all the zone from 9.10% to 9.70%; 12.60% to 15.10%; 9.60% to 11%; 8.00% to 8.70 and 11.30% to 13.70% respectively which means in 2015-16 inequality is also sensitive to upper income group and any increase in income/expenditure deteriorates the inequality among population of higher income group.
Furthermore, zones have been categories into their representative districts and in these districts uni-dimensional inequality are spatially presented (Figure 2). Measurement explores that over the time almost all districts in the maps changes their color with different pattern few districts changes their color from lighter to darker that represents the worsen of uni-dimensional inequality while some of them changes their color from darker to lighter that represents the decline of inequality in these districts Figure 1. However, overall measurement of districts represents that since 2005-06 to 2015-16 darker color becomes lighter in maximum number of districts which means positive growth benefits trickle down toward lower income groups in an appropriate manner that causes significant decline in uni-dimensional inequality with the passage of time.
Arrar (2009) explains that inequality is not a uni-dimensional phenomenon rather it is multidimensional concept because a single dimension of income/expenditure is unable to predict the actual picture of any economy that’s why current study not only highlighted inequality in uni-dimensional spectrum but also discusses it in multidimensional perspective by using three very important dimensions of education, health and housing services. Results of multidimensional inequality (MDI) in Table 4 demonstrates that over the time since 2005-06 to 2015-16 inequality shows consistence declining trend across all the agro-climatic zones of Punjab. However, such decline in inequality with little span of time especially the gap of year of two was too minor but with the gap of 10 year significant decline in inequality has been observed in all the zones of study area. Resulted measure reveal that in zone I, II, III, IV and V inequality was 15.90%, 17.00%, 17.30%, 17.70% and 18.90% in 2005-06 which decline to 13.80%, 14.60%, 14.20%, 15.30% and 14.70% in 2015-16 with lambda is 0. However, it has also been noted that inequality get worsen with varying value of lambda from 0.1 to 1 in all the study year from 2005-06 to 2015-16, it means calculated outcomes confirms the sensitivity of MDI indices to the adopted properties that MDI indices must obey Arrar (2009). Finally, dimensional contribution shows in a study period education and health are the major contributor to the issue of MDI which means population of upper quintiles has higher education and advance health facilities while population of lower quintiles are deprived in education and health facilities while in case of housing series contribution is significant smaller than health and education which means lower quintiles population is less deprived in housing services or has easy access to these services as upper quintile population as compared to health and education. Numerical description of results shows that in year 2005-06 in zone I, II, III, IV and V education contribution to MDI was 49.83%, 40.68%, 40.95%, 41.06% and 33.04% while contribution of health was 32.66%, 38.49%, 30.11%, 35.00% and 48.40% and contribution of housing services was 17.51%, 20.83%, 28.95%23.94% and 18.55% respectively when lambda is equal to zero however, with varying value of lambda contribution of all the dimensions increase across all the zones in all the study years that cause the worsen of inequality as mention above. Figures 3, 4, 5 and 6 presents the contribution of all dimensions at lambda is equal to 0.1, 0.5, 0.9 and 1 that validates the above views that with varying value of lambda from 0.1 to 1 contribution of all dimensions fluctuates (either increase or decrease) which ultimately cause the increases of MDI measure as mention by Arrar (2009). Similarly, contribution of education to MDI in 2015-16 in all above mention zones is 46.86%, 44.46%, 40.70%, 47.12% and 34.84% (Figure 7) while contribution of health is 36.86%, 38.70%, 38.90%, 37.29% and 49.72% and contribution of housing services is 16.28%, 16.85%, 20.40%, 15.60% and 15.44% respectively. By summing up overall discussion it has been noticed that over the time in health and education sector situation of inequality get marginally worsen between upper and lower quintile population while on the contrary, in case of housing services situation of inequality get significantly better and the gap between upper and lower quintile population has been declined. Significant improvement in housing service dimension over time counterbalance the little bit deteriorate impact of health and education dimension which ultimately leads to significant decline in MDI between 2005-06 to 2015-16.
However, in multidimensional spectrum again zones have also been categories into their representative districts and in these districts MDI is presented spatially (Figure 3). Measurement explores that over the time almost all districts in the maps changes their color with different pattern few districts changes their color from lighter to darker that represents the worsen of MDI while some of them changes their color from darker to lighter that represents the decline of MDI in these districts over time. However, overall measurement of districts represents that since 2005-06 to 2015-16 darker color becomes lighter in maximum number of districts which means significant decline in MDI has been taken place with the passage of time.
EDU: Education; HEA: Health and HS: Housing Services.
Conclusion and Recommendations
This study calculated the uni-dimensional and multidimensional inequality in Irrigated and Barani (agro-climatic) zones of Punjab and their representative districts using HIES/ PSLM data of last 10 years from 2005-06 to 2015-16. Initially, measurement of uni-dimensional inequality has been done through Gini-Coefficient, Atkinson measure and Generalized Entropy Index. Calculated outcomes reveals that since 2005-06 to 2015-16 with short span of time inequality show fluctuating trend across all the measures and all the Irrigated and Barani (agro-climatic) zones of Punjab. However, in a longer span of time with the gap of 10 years consumption inequality shows marginally declining (increasing) trend in zone I, III, IV (II, V) across all the measures. In case of Atkinson (Generalized Entropy) index with varying value of Epsilon (theta) inequality has been increase among lower (upper) income groups that reveals sensitivity of inequality with varying value of epsilon (theta). Similarly, spatial measures at district level reveals that over the time inequality shows fluctuating trend, since 2005-06 to 2010-11 inequality get worsen in maximum number of districts while from 2011-12 to 2015-16 inequality declines in a maximum number of districts in agro-climatic zones of Punjab as shown through darker (lighter) color of map in 2010-11 (2015-16) as compared to 2005-06. Finally, with a longer span of time especially the gap of 10 years a significant decline in inequality has been noted because the color of the maps in 2015-16 is lighter than 2005-06. Outcomes of the current study reveal a declining trend of MDI across all the Irrigated and Barani (agro-climatic) zones along with their representative districts in both shorter and longer period of time since 2005-06 to 2015-16. However, with varying value of lambda from 0.1 to 1 dimensional contribution fluctuate and inequality become worsens that confirm the sensitivity of MDI indices to the adoptive properties Finally, relative contributions of dimensions show that education and health is the major contributor to MDI as compared to housing services. In order to decline MDI, government should focus on the provision of education and health facilities at their door step to the population of backward districts as enjoying by residence of advance districts. Particular step are quite helpful to decline MDI in agro-climatic zones of Punjab.
Acknowledgements
This humbal contribution is hereby highly acknowledged the profound guidance and support by my worth supervisor Dr. Irfan Ahmad Baig and my committee members Dr. Abdul Saboor for his valuable addition in this regards. Last but not least I am really grateful contribution by my students Adil Hameed and Muhammad Waqas for their time devotion in this analysis.
Author’s Contribution
Saima Asad: Conceived the idea and carried out the research and wrote the manuscript.
Irfan Ahmad Baig: Supervised the whole research work and gave technical input in write up and analysis.
Abdul Saboor: Gave technical input in write up and analysis.
Rashid Mahmood: Drafting the manuscript.
Conflict of interest
No conflict of interest.
References
Ahmad, M., 2001. Estimation of distribution of income among various occupations/professions in Pakistan. Pak. Econ. Soc. Rev. 39(2):119-134
Ali, I., and A. Saboor. 2010. Cross sectional trends and dynamics of economic inequality in Pakistan. Pak. J. Agric. Sci, 47(3): 303-308.
Anwar, T., 2005. Long-term changes in income distribution in Pakistan: Evidence based on consistent series of estimates. CRPRID, Islamabad. (Discussion PaperNo. 3).
Anwar, T., 2007. Growth and sectoral inequality in Pakistan: 2001-02 to 2004-05. Pak. Econ. Soc. Rev. pp. 141-154.
Araar, A., 2009. The hybrid multidimensional index of inequality. CIRPEE working paper 09-45. https://doi.org/10.2139/ssrn.1496505
Arshad, H., and M. Idrees. 2008. Trends in polarisation in Pakistan. Pak. Econ. Soc. Rev. 47(2): 153-167. https://doi.org/10.30541/v47i2pp.153-167
Atkinson, A., 1970. On the Measurement of Economic Inequality. J. Econ. Theo. 2(3): 244-263. https://doi.org/10.1016/0022-0531(70)90039-6
CPRSPD, 2008. Poverty indices based on PSLM 2005-06 data. Methodology/ Background and Poverty Estimates for 2005-06. Centre Poverty Reduction Soc. Policy Dev. Plann. Comm., Islamabad.
De Kruijk, H., M. Van Leeuwen and A.R. Kemal. 1985. Changes in poverty and income inequality in Pakistan during the 1970s [with Comments]. Pak. Econ. Soc. Rev. 24(3/4): 407-422. https://doi.org/10.30541/v24i3-4pp.407-422
Easterly, W., 2003. The political economy of growth without development: A case study of Pakistan. In In D. Rodrik (Ed.), In search of Chapter. 14: 439-472. https://doi.org/10.1515/9781400845897-016
Haq, R., 1999. Income inequality and economic welfare. A decomposition analysis for the household sector in Pakistan Working papers (No. 1999: 170). Pak. Inst. Dev. Econ., Islamabad.
Hicks, D.A., 1997. The inequality-adjusted human development index: a constructive proposal. World Dev. 25(8): 1283-1298. https://doi.org/10.1016/S0305-750X(97)00034-X
Jamal, H., 2006. Does inequality matter for poverty reduction? Evidence from Pakistan’s poverty trends. Pak. Dev. Rev. 45(3): 439-459. https://doi.org/10.30541/v45i3pp.439-459
Kakwani, N., and H.H. Son. 2008. Poverty equivalent growth rate. Rev. Income Wealth. 54(4): 643-655. https://doi.org/10.1111/j.1475-4991.2008.00293.x
Kemal, A.R., and S.M. Naseem. 1994. Structural adjustment, employment, income distribution and poverty [with Comments]. Pak. Dev. Rev. 33(4): 901-914. https://doi.org/10.30541/v33i4IIpp.901-914
Khalid, M.W., J. Zahid, M. Ahad, A.H. Shah and F. Ashfaq. 2017. Dynamics of unidimensional and multidimensional inequality in Pakistan: Evidence from regional and provincial level study. Int. J. Soc. Econ. 46(2): 170-181. https://doi.org/10.1108/IJSE-07-2017-0278
Kuznets, S., 1955. Economic growth and income inequality. Am. Econ. Rev. 45(1): 1-28.
Lugo, M.A., 2004. On multivariate distributions of well-being: The case of Argentine provinces in the 1990s. In general conference of IARIW, Cork, Ireland.
Maasoumi, E., 1986. The measurement and decomposition of multi-dimensional inequality. Econometrica. J. Econ. Soc. 54(4): 991-997. https://doi.org/10.2307/1912849
Mahmood, Z., 1984. Income inequality in Pakistan: an analysis of existing evidence [with comments]. Pak. Dev. Rev. 23(2-3): 365-379. https://doi.org/10.30541/v23i2-3pp.365-379
Maio, D.F.G., 2007. Income inequality measures. J. Epidem. Comm. Health. 61(10): 849-852. https://doi.org/10.1136/jech.2006.052969
Pinckney, E.R., and Pinckney, C. 1989. Unnecessary Measures: Physicians are relying too heavily on medical tests. Sci. 29: 21-27.
Rehman, T.U.M., Mustafa, U., and H. Rashid. 2015. Trends of income inequality and polarisation in Pakistan for the period 1990-2008. Pak. Dev. Rev. 54(4): 447-466. https://doi.org/10.30541/v54i4I-IIpp.447-467
Rohde, N., and R. Guest. 2013. Multidimensional racial inequality in the United States. Soc. Indic. Res. 114(2): 591-605. https://doi.org/10.1007/s11205-012-0163-0
Shorrocks, A., and R. Van der Hoeven. 2004. Growth, inequality, and poverty: Prospects for pro-poor economic development. OUP Oxford, Londan. https://doi.org/10.1093/0199268657.001.0001
Tsui, K.Y., 1995. Multidimensional generalizations of the relative and absolute inequality indices: the Atkinson-Kolm-Sen approach. J. Econ. Theo. 67(1): 251-265. https://doi.org/10.1006/jeth.1995.1073