Research Article · Volume 14, Issue 11, 19 October 2026 · Open Access
Linking DGAT1 Polymorphism with Immunometabolic Profiles and Meat Quality across Contrasting Rearing Systems in Garut Sheep
· ·
Affiliations & Notes ⌄
1Laboratory of Animal Genetics and Biometrics, Department of Animal Production, Faculty of Animal Husbandry, University of Padjadjaran, Campus Jatinangor, Jl. Ir. Soekarno, Bandung- Sumedang KM.21, Jatinangor-Sumedang 45363 Indonesia
2Animal Physiology and Biochemistry, Department of Animal Nutrition and Feed Technology, Animal Husbandry Faculty, University of Padjadjaran, Campus Jatinangor, Jl. Ir. Soekarno, Bandung- Sumedang KM. 21, Jatinangor-Sumedang 45363, Indonesia *Correspondence | Dudi, Laboratory of Animal Genetics and Biometrics, Department of Animal Production, Faculty of Animal Husbandry, University of Padjadjaran, Campus Jatinangor, Jl. Ir. Soekarno, Bandung- Sumedang KM.21, Jatinangor-Sumedang 45363 Indonesia
DGAT1 polymorphisms identified in the Garut sheep dataset were primarily associated with fat deposition, TG levels, and DGAT1 expression.
The intensive system showed higher growth and fat deposition, with more pronounced inflammatory and oxidative profiles.
Most genotype × system interactions were non-significant; however, interactions regarding total protein and WBC counts warranted simple effect analysis, and these results do not confirm that genetic and environmental contributions are entirely additive.
Selected from the article's own text.
Abstract
This study aims to evaluate the association between diacylglycerol O-acyltransferase 1 (DGAT1) polymorphism and immunometabolic profiles, carcass characteristics, and meat quality in Garut sheep under contrasting rearing systems. A total of 90 sheep were grouped into intensive, semi-intensive and extensive systems (n=30 each). We determined the DGAT1 genotype by PCR amplification and electrophoresis pattern analysis, and analysed DGAT1, NFKB1 and NFE2L2 (Nrf2) expression by RT-qPCR. The parameters observed included growth performance, carcass characteristics and selected meat quality, energy-lipid metabolites, immune-inflammatory indicators, and antioxidant status. Three DGAT1 genotypes, namely AA, AG, and GG, were identified with frequencies of 0.467, 0.400, and 0.133, respectively, and the population is in Hardy-Weinberg equilibrium. The rearing system influences final body weight, daily body weight gain, dry matter consumption, feed efficiency, carcass characteristics, intramuscular fat, and most indicators of lipid metabolism. The intensive system resulted in higher fat deposition and DGAT1 expression, but was accompanied by increases in IL-6, TNF-α, haptoglobin, serum amyloid A, MDA, and NF-κB. In contrast, semi-intensive and extensive systems showed higher antioxidant capacity, marked by increases in SOD, GPx, T-AOC, and Nrf2. DGAT1 genotype was mainly associated with fat deposition and DGAT1 expression, whereas genotype × system interactions were relatively limited. Correlation analysis and exploratory PCA described associations between DGAT1, lipid metabolism, inflammation, redox status, and meat quality. These results indicate that the phenotypic profiles of Garut sheep reflect contributions from genetic factors and the rearing environment. The mean difference between intensive and extensive systems was 5.5 kg for final weight and 0.81 percentage points for IMF. Most interactions were not significant, except for total protein and WBC; the limited number of GG restricted interpretation of interactions.
The Garut sheep is a local Indonesian livestock genetic resource characterised by high economic value, strong adaptability to tropical environments, and significant potential for meat production. Improving sheep productivity depends not only on rearing systems and nutritional adequacy but also on genetic variation that regulates tissue deposition, energy metabolism, and carcass characteristics. Intensive, semi-intensive, and extensive rearing systems differ in physical activity, feed intake patterns, energy utilisation, and environmental exposure, ultimately shaping distinct growth phenotypes and meat quality profiles. In sheep, grazing-based and indoor housing systems elicit different responses in body weight gain, blood metabolites, carcass traits, and various meat characteristics . Recent literature confirms that rearing systems and feeding regimens can alter growth, carcass characteristics, intramuscular fat deposition, colour, and meat tenderness ; ; ; .
DGAT1 encodes an enzyme that catalyses the final step of triacylglycerol synthesis by esterifying diacylglycerol with acyl-CoA, making it a relevant candidate marker for fat deposition. Associations between DGAT1 variations and carcass characteristics, as well as fatty acid components, have been reported in Indonesian sheep, whereas in Southdown sheep, this gene is associated with loin meat yield ; . This biochemical role provides a basis for evaluating the relationship between genotype and lipid phenotypes, though it does not in itself prove a causal link within the populations studied ; .
DGAT1 associations are specific to the locus, population, and measured traits. In Indonesian sheep, the g.8539 C>T variant has been reported to associate with several carcass traits as well as flavour and odour components, but not consistently with non-carcass traits, cholesterol levels, or meat mineral content , b). In Garut sheep, previous research has also linked rearing systems to haematological status, meat quality, and DGAT1 variation . Therefore, assessments of genotype-phenotype associations must consider environmental context and should not assume that effects observed in other populations will be identical in Garut sheep.
Lipid metabolism and meat quality are also inextricably linked to immune-inflammatory regulation and redox balance. Shifts in energy substrate utilisation can alter NEFA, BHBA, triglyceride, leptin, and insulin concentrations. At the same time, inflammatory states and oxidative stress are reflected in cytokine, acute-phase protein, and MDA levels, as well as antioxidant system activity. Consequently, differences in rearing systems may modify the relationships among DGAT1 genotype, DGAT1 expression, intramuscular fat deposition, and meat quality. An approach integrating genetic variation with metabolic phenotypes is crucial, as other candidate genes in Indonesian sheep have also shown associations linking genetic variation, gene expression, carcass characteristics, and meat chemical quality . This relationship is significant because antioxidant and inflammatory statuses can shift in conjunction with nutritional patterns, activity levels, and lipid deposition, ultimately influencing muscle and meat quality ; ; ; ; .
Research on DGAT1 in sheep has predominantly focused on its associations with carcass traits, fat deposition, fatty acid composition, or sensory attributes in isolation. Information linking DGAT1 polymorphism and expression to immunometabolic regulation, oxidative status, and meat quality in Garut sheep raised under contrasting management systems remains limited. Therefore, this study aims to evaluate DGAT1 polymorphism and its associations with growth performance, carcass characteristics, selected meat quality traits, energy-lipid metabolism, immune-inflammatory responses, and antioxidant status in Garut sheep reared under intensive, semi-intensive, and extensive systems. This approach is expected to elucidate how genetic factors and rearing environments interact to shape the immunometabolic phenotype and meat quality of Garut sheep. An integrative approach combining candidate genes, metabolism, immune-redox responses, and meat phenotypes is increasingly supported by metabolomic and transcriptomic studies in sheep ; ; ; . This study hypothesises that intensive systems are associated with greater growth and fat deposition, as well as more pronounced inflammatory and oxidative stress profiles, than systems that allow higher activity. DGAT1 variation is expected to be primarily associated with fat deposition and DGAT1 expression; the magnitude of this association is hypothesised to differ across rearing systems. The direction of the difference between alleles has not yet been determined, as the molecular identity of the A and G alleles requires further confirmation.
MATERIALS AND METHODS
Animals, research design, and rearing systems
The research used 90 Garut sheep with relatively uniform physiological conditions and ages. Animals were allocated into three rearing systems, namely intensive, semi-intensive and extensive, 30 animals each. Intensive systems involve full confinement with cut-and-carry feed and minimal physical activity; semi-intensive systems combine indoor housing with controlled access to the paddock/activity; while the extensive system provides grazing/paddock access with higher physical activity. Drinking water is available ad libitum.
Measurement of performance, carcass, and meat quality
We recorded body weight at the beginning and end of the study period and calculated average daily gain (ADG) as the change in body weight divided by the experimental period. We calculated dry matter consumption from the difference between the given and remaining feed on a dry-matter basis. In contrast, we calculated feed conversion ratio as dry matter intake per unit body weight gain. After slaughter, we recorded hot and cold carcass weights, dressing percentage, loin eye area, and backfat thickness. We used longissimus thoracis et lumborum muscle samples to determine intramuscular fat (IMF), 24-hour pH, drip loss, and Warner-Bratzler shear force, following standard meat quality analysis procedures consistent across all samples.
Blood sampling and analysis of metabolites, immune-inflammatory, and oxidative status
We collected blood samples from the jugular vein before morning feeding. We collected some blood into EDTA tubes for haematological analysis, while other samples were collected into tubes without anticoagulant, allowed to clot, and then centrifuged to obtain serum. We analysed glucose, NEFA, BHBA, triglycerides, total cholesterol, HDL, LDL, total protein, and albumin using colourimetric/enzymatic methods with commercial kits, following the manufacturer’s instructions. We analysed leptin, adiponectin, insulin, IgG, IgM, IL-1β, IL-6, TNF-α, IL-10, TGF-β, haptoglobin, and serum amyloid A using ovine-specific ELISA. We evaluated redox status using MDA, SOD, GPx, CAT, and T-AOC with appropriate spectrophotometric kits. We analysed all samples in duplicate and performed readings at the recommended wavelengths for each kit.
DNA extraction, DGAT1 amplification, and genotyping
We isolated genomic DNA from 200 µL of EDTA-anticoagulated blood using a silica-column-based extraction kit (Thermo Fisher). The extraction procedure involved cell lysis, protein digestion with proteinase K, DNA binding to the membrane, washing, and elution in 50–100 µL of nuclease-free solution. We assessed DNA concentration and purity spectrophotometrically using A260/A280 and A260/A230 ratios, and evaluated integrity by 1% agarose gel electrophoresis. DNA was stored at −20 °C until amplification.
We amplified a DGAT1 fragment of approximately 309 bp using the primers listed in Table 1, and verified the sequence against the Ovis aries reference. The 25 µL PCR reaction contained 1× PCR master mix, 0.2 µM of each primer, and 25–50 ng of DNA. Amplification began with denaturation at 95 °C for 3 min, followed by 35 cycles of denaturation at 95 °C for 30 s, primer annealing at an optimised temperature for 30 s, and extension at 72 °C for 30 s, with a final extension at 72 °C for 5 min. A no-template control was included in each batch of analyses. We analysed PCR products on a 2% agarose gel alongside a 100 bp DNA marker using a gel documentation system.
Genotypes were determined via Sanger sequencing. We purified PCR products and sequenced them in both directions; we then examined chromatograms and aligned sequences against the reference sequence. We determined genotypes based on the nucleotides at the variant positions, and we reanalysed ambiguous results. We mapped the codes AA, AG, and GG to verified alleles; we did not use the presence of a PCR band alone to assign genotypes.
RNA extraction and gene expression analysis with RT-qPCR
We collected longissimus thoracis et lumborum muscle samples immediately after slaughter from a standardised anatomical location using RNase-free instruments. Tissues were immediately snap-frozen in liquid nitrogen and stored at −80 °C. We isolated total RNA from 20–30 mg of tissue using a (brand and manufacturer) kit, which involved homogenization, lysis, RNA binding, washing, and elution. We treated samples with DNase I to eliminate genomic DNA contamination.
We assessed RNA concentration and purity spectrophotometrically. We used RNA samples meeting quality criteria for cDNA synthesis. We reverse-transcribed a total of 500 ng of RNA in 20 µL using a cDNA Synthesis kit, following the recommended incubation conditions. We included a no-reverse-transcriptase control to assess residual genomic DNA. cDNA was uniformly diluted and stored at −20 °C until analysis.
We analysed DGAT1, NFKB1, and NFE2L2 expression by SYBR Green RT-qPCR, with primers listed in Table 1. GAPDH was used as the reference gene after validating the stability of its expression across rearing systems and genotypes. The 20 µL reactions contained 1× SYBR Green master mix, 0.3 µM of each primer, and 2 µL of cDNA at a uniform dilution. Amplification involved initial activation at 95 °C according to the reagent instructions, followed by 40 cycles of denaturation at 95 °C for 10–15 seconds and annealing/extension at an optimised temperature for 30 seconds.
We analysed each sample in technical triplicates, with no-template and no-reverse-transcriptase controls. Inter-plate calibrator samples were used when analyses spanned multiple plates. We verified amplification specificity via melting curves and evaluated primer efficiency using a cDNA dilution series. Acceptance criteria included specific products, no target amplification in negative controls, 90–110% efficiency, and a standard curve coefficient of determination (R²) ≥0.99. We re-analysed reactions that failed to meet these criteria.
Table 1: Primer sequences used for genotyping and RT-qPCR.
Target
Application
Forward (5'-3')
Reverse (5'-3')
Amplicon
DGAT1
PCR/ genotyping
GCATGTTCCGCCTCTGG
GGAGTCCAACACCCCTGA
309 bp
DGAT1
RT-qPCR
CGCGCCAACAGACTACAAAG
AGGTGCCACTCTACGTACCA
126 bp
NFKB1
RT-qPCR
CAAGCACAAGAAGGCAGCACAAC
CAGCCATCAGCAGCAGCAGAC
113 bp
NFE2L2 (Nrf2)
RT-qPCR
TGTGGAGGAGTTCAACGAGC
CGCCGCCATCTTGTTCTTG
88 bp
GAPDH
Reference
GGGTCATCATCTCTGCACCT
GGTCATAAGTCCCTCCCACGA
176 bp
NFKB1—Zhang et al. (2022b); NFE2L2 (Nrf2)—Gang et al. (2025).
Table 2: DGAT1 genotype distribution and genetic diversity in Garut sheep.
Item
AA
AG
GG
Allele A
Allele G
Overall count
42
36
12
Overall frequency
0.467
0.400
0.133
0.667
0.333
Observed heterozygosity
Expected heterozygosity
PIC
Hardy-Weinberg equilibrium
Value/Statistic
0.400
0.444
0.346
χ²=0.900; P=0.343
Genotype codes (AA, AG, and GG) follow the coding used in this study and require mapping to verified nucleotide variants; PIC = polymorphic information content. The Hardy–Weinberg test was performed on the pooled sample and did not demonstrate randomisation or representativeness of the source population.
We calculated relative expression using the 2-ΔΔCq method when target and reference gene efficiencies were comparable, with ΔCq representing the difference between target and reference Cq values and ΔΔCq representing the difference between the sample ΔCq and the calibrator ΔCq. If efficiencies differed, we used a calculation that accounted for amplification efficiency. We summarised technical replicates into a single value per animal; we used ΔCq values or log-transformed expression data for statistical testing after assumption checks. We interpret NFKB1 and NFE2L2 expression as transcript abundance, not a direct measure of NF-κB and Nrf2 protein activation.
Statistical analysis
Data were tested for normality and homogeneity of variance before parametric analysis. The effects of DGAT1 genotype, rearing system, and their interaction were analysed using a two-way general linear model: Yijk = μ + Gi + Rj + (G × R)ij + eijk, with Gi as the genotype effect, Rj as the rearing system effect, and G × R as the interaction. Effects were significant; we compared means using Tukey’s test at the 5% level. We calculated genotype and allele frequencies directly; we evaluated heterozygosity, polymorphic information content (PIC), and Hardy-Weinberg equilibrium to characterise the population. We analysed relationships between variables using Pearson correlation and used principal component analysis to evaluate integrated phenotypic patterns. Table data are presented as mean ± standard deviation, and differences were considered significant at P < 0.05. The system mean values presented in Tables 3–6 are descriptive summaries; means for individual genotypes are not shown. Significant interactions regarding total protein and WBC must be followed up with a simple effects analysis before concluding main effects.
RESULTS AND DISCUSSION
DGAT1 polymorphism and genetic diversity in Garut sheep
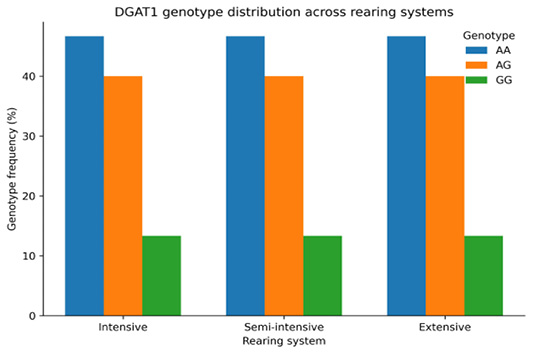
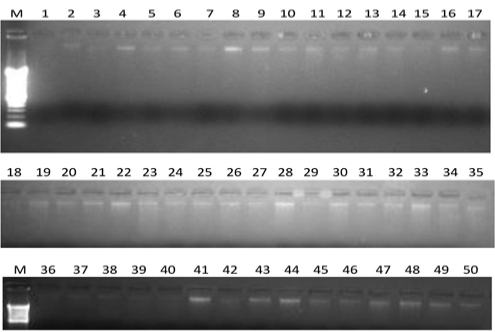
A total of 90 Garut sheep were classified into three DGAT1 genotype classes, namely AA, AG, and GG. The genotype frequencies were 0.467, 0.400, and 0.133, respectively, with A allele frequency 0.667 and G allele frequency 0.333 (Table 2). Observed and expected heterozygosities were 0.400 and 0.444, respectively, and the PIC value was 0.346. The population did not deviate from Hardy-Weinberg equilibrium (χ² = 0.900; P = 0.343). Figure 1 shows the distribution of the three genotypes in each rearing system, and Figure 2 presents the electrophoresis results of DGAT1 amplification products.
Table 3: Growth performance and carcass traits by rearing system, with tests of DGAT1 genotype and genotype × rearing system interaction
Parameter
Intensive
Semi-intensive
Extensive
P(R)
P(G)
P(G × R)
Initial body weight (kg)
23.8 ± 1.7a
23.9 ± 1.7a
24.1 ± 1.6a
0.827
0.556
0.731
Final body weight (kg)
44.9 ± 2.5a
43.7 ± 3.2a
39.4 ± 3.1b
<0.001
0.954
0.970
Average daily gain (kg/day)
0.177 ± 0.020a
0.166 ± 0.018a
0.127 ± 0.020b
<0.001
0.984
0.963
Dry matter intake (kg/day)
1.200 ± 0.100a
1.120 ± 0.100b
0.981 ± 0.080c
<0.001
0.101
0.993
Feed conversion ratio
6.89 ± 0.71b
6.96 ± 0.75b
7.77 ± 1.02a
<0.001
0.235
0.767
Hot carcass weight (kg)
21.9 ± 1.3a
20.9 ± 1.8b
18.3 ± 1.3c
<0.001
0.322
0.933
Cold carcass weight (kg)
21.5 ± 1.3a
20.4 ± 1.8b
17.9 ± 1.3c
<0.001
0.330
0.938
Dressing percentage (%)
48.9 ± 1.7a
47.7 ± 1.8b
46.6 ± 2.0c
<0.001
0.058
0.568
Loin eye area (cm2)
17.1 ± 1.0a
16.3 ± 0.9b
15.0 ± 1.0c
<0.001
0.243
0.430
Back fat thickness (mm)
3.86 ± 0.46a
3.14 ± 0.50b
2.68 ± 0.46c
<0.001
<0.001
0.934
Values are mean ± SD (n = 30 per rearing system). Different superscript letters within a row indicate significant differences among rearing systems (Tukey test, P < 0.05). P-values are from a two-way ANOVA for rearing system, DGAT1 genotype, and their interaction (G×R). ADG = average daily gain; FCR = feed conversion ratio; G = genotype; R = rearing system. Means per genotype are not presented; the SD represents variation among animals, not uncertainty in the estimation of model effects.
The detected DGAT1 diversity indicates that this locus possesses genetic variation that can be utilised to examine genotype-phenotype relationships in Garut sheep. The PIC value of 0.346 indicates a moderate level of informativeness, while the Hardy-Weinberg equilibrium indicates that the genotype distribution in the observed population does not deviate significantly. These results are consistent with reports of DGAT1 polymorphism in several Indonesian sheep populations, although genotype types and frequencies can differ between populations ; . Dai et al. (2022) also showed that ovine DGAT1 variation is breed-specific and can be associated with certain carcass traits. Therefore, interpreting the influence of DGAT1 in Garut sheep requires considering the population’s genetic background and rearing system as sources of environmental variation. These results align with the use of DGAT1 variation as a candidate marker. DGAT1 has been characterised for production traits in various sheep populations and other ruminants , although associations can be population- and locus-specific ; ; .
Growth performance, carcass traits, and selected meat quality characteristics across rearing systems and DGAT1 genotypes
The rearing system significantly affected most growth and carcass parameters (Table 3). Final body weight and daily weight gain were higher in the intensive and semi-intensive systems than in the extensive system (P<0.001). At the same time, dry matter intake decreased gradually from intensive to extensive (P<0.001). Hot and cold carcass weights, carcass percentage, loin eye area, and backfat thickness were also highest in the intensive system and lowest in the extensive system (P<0.001). The genotype effect was primarily seen in backfat thickness (P<0.001), while the genotype × rearing system interaction was not significant for this parameter. For selected meat qualities (Table 4), intramuscular fat (IMF) was highest in the intensive system and lowest in the extensive system (P<0.001), with a highly significant genotype effect (P<0.001). WBSF values were higher in the extensive system (P<0.001), while pH24 and L* did not differ significantly. The a*redness value indicated a genotype effect (P=0.010), and the semi-intensive system had the lowest drip loss (P= 0.005).
The performance advantages of intensive and semi-intensive systems likely relate to more controlled nutrient availability and lower energy requirements for activity than in extensive systems. This pattern aligns with reports that concentrate-based systems increase ADG and loin thickness compared with grazing ; . Higher backfat thickness and IMF in intensive systems suggest that excess energy is directed more toward lipid deposition. Conversely, physical activity in extensive systems can increase energy substrate utilisation and reduce fat accumulation, resulting in leaner carcasses. Studies using varying grazing durations also indicate that indoor feeding increases fat deposition and can alter meat physical characteristics . Experimental evidence suggests that grazing systems, supplementation during grazing, and stall feeding produce different trade-offs among growth, carcass, and meat quality ; ; ; ; .
Interestingly, the effect of DGAT1 genotype was more pronounced on backfat and IMF than on growth. This finding supports a DGAT1 function more closely related to triacylglycerol synthesis and lipid deposition than to general body growth. Associations of DGAT1 with carcass and fatness traits have been reported in Indonesian sheep ; , and ovine DGAT1 variation was also associated with loin meat yield in Southdown . However, these associations were population-specific: in Pasundan cattle, the K232A DGAT1 polymorphism was detected but not significantly associated with backfat thickness, longissimus dorsi area, rump area, or IMF . Most G × R interactions were not significant; however, this interpretation should consider the small number of GG individuals and the significant interactions observed for total protein and WBC. Metabolomic and transcriptomic approaches have also shown that IMF affects colour, flavour precursors, muscle fibre structure, and tenderness in lamb , while variation in sheep interbreeding remains an important source of carcass heterogeneity and meat quality .
Table 4: Selected meat-quality characteristics by rearing system, with tests of DGAT1 genotype and genotype × rearing system interaction.
Parameter
Intensive
Semi-intensive
Extensive
P(R)
P(G)
P(G × R)
Intramuscular fat (%)
3.76 ± 0.50a
3.34 ± 0.58b
2.95 ± 0.55c
<0.001
<0.001
0.341
pH at 24 h
5.63 ± 0.08a
5.60 ± 0.08a
5.59 ± 0.07a
0.096
0.611
0.670
L* (lightness)
38.7 ± 1.6a
38.3 ± 1.5a
38.3 ± 1.5a
0.578
0.500
0.654
a* (redness)
17.3 ± 1.0a
17.6 ± 1.1a
17.8 ± 1.0a
0.090
0.010
0.664
Warner-Bratzler shear force (kg)
3.41 ± 0.37b
3.26 ± 0.34b
3.70 ± 0.33a
<0.001
0.502
0.811
Drip loss (%)
2.51 ± 0.32a
2.19 ± 0.38b
2.41 ± 0.39ab
0.005
0.850
0.563
Values are mean ± SD (n = 30 per rearing system). Different superscript letters within a row indicate significant differences among rearing systems (Tukey test, P < 0.05). P-values are from a two-way ANOVA for rearing system, DGAT1 genotype, and their interaction (G×R). IMF = intramuscular fat; WBSF = Warner–Bratzler shear force; L* = lightness; a* = redness. pH was measured 24 hours post-slaughter; means per genotype are not presented.
Table 5: Energy and lipid metabolic profile by rearing system, with tests of DGAT1 genotype and genotype × rearing system interaction.
Parameter
Intensive
Semi-intensive
Extensive
P(R)
P(G)
P(G × R)
Glucose (mg/dL)
63.6 ± 3.9a
61.8 ± 4.4a
58.7 ± 5.1b
<0.001
0.296
0.285
NEFA (mmol/L)
0.289 ± 0.040b
0.290 ± 0.050b
0.342 ± 0.040a
<0.001
0.967
0.144
BHBA (mmol/L)
0.442 ± 0.050b
0.481 ± 0.050a
0.512 ± 0.050a
<0.001
0.455
0.712
TG (mg/dL)
55.2 ± 5.9a
44.4 ± 6.6b
37.3 ± 5.7c
<0.001
<0.001
0.134
TC (mg/dL)
79.6 ± 8.0a
74.8 ± 5.9b
65.7 ± 7.3c
<0.001
0.491
0.157
HDL (mg/dL)
39.9 ± 4.3b
39.8 ± 4.0b
43.3 ± 3.9a
0.002
0.908
0.635
LDL (mg/dL)
28.5 ± 9.1a
26.2 ± 5.9a
17.4 ± 6.0b
<0.001
0.980
0.517
Total protein (g/dL)
6.81 ± 0.29a
6.72 ± 0.32a
6.64 ± 0.35a
0.096
0.012
0.009
Albumin (g/dL)
3.33 ± 0.18a
3.34 ± 0.26a
3.32 ± 0.20a
0.940
0.985
0.166
Leptin (ng/mL)
3.56 ± 0.35a
3.15 ± 0.52b
2.95 ± 0.49b
<0.001
0.015
0.654
Adiponectin (µg/mL)
8.80 ± 0.92a
8.95 ± 0.97a
9.08 ± 0.69a
0.477
0.982
0.196
Insulin (µIU/mL)
8.95 ± 1.31a
8.58 ± 1.09ab
7.90 ± 1.14b
0.003
0.078
0.633
DGAT1 relative expression (2^-ΔΔCt)
1.170 ± 0.190a
1.080 ± 0.170a
0.960 ± 0.180b
<0.001
<0.001
0.976
Values are mean ± SD (n = 30 per rearing system). Different superscript letters within a row indicate significant differences among rearing systems (Tukey test, P < 0.05). P-values are from two-way ANOVA for rearing system, DGAT1 genotype, and their interaction (G×R); TG=Triglycerides; TC=Total Cholesterol; HDL=High-density lipoprotein; LDL=Low-density lipoprotein NEFA = non-esterified fatty acids; BHBA = β-hydroxybutyrate; TG = triglycerides; DGAT1 = diacylglycerol O-acyltransferase 1; means per genotype are not presented.
DGAT1-associated energy and lipid metabolism under contrasting rearing systems
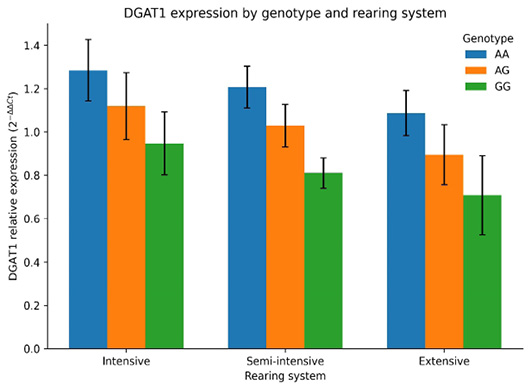
Energy and lipid profiles differed across rearing systems (Table 5). Glucose concentrations were higher in intensive and semi-intensive systems than in extensive systems (P<0.001), while NEFA and BHBA tended to be higher in extensive sheep (P<0.001). Triglycerides decreased from intensive to semi-intensive to extensive systems (P<0.001) and were also influenced by DGAT1 genotype (P<0.001). Total cholesterol and LDL were higher in intensive systems, while HDL was highest in extensive systems. Leptin was highest in intensive systems (P<0.001), while insulin was lower in extensive systems (P=0.003). Rearing system and genotype influenced relative DGAT1 expression (both P<0.001), but there was no G×R interaction (P=0.976; Figure 3).
The increase in NEFA and BHBA in the extensive system indicates greater lipid mobilisation and oxidation, consistent with increased energy requirements for activity. Conversely, higher triglycerides, cholesterol, leptin, and DGAT1 expression in the intensive system reflect conditions that favour lipid synthesis and storage. This pattern aligns with the higher IMF and backfat in the intensive system (Tables 3 and 4). Sadrarhami et al. (2022) also reported differences in blood metabolites, including lipids and BHBA, between grazing and concentrate-fed systems, showing that the rearing environment can shift energy utilisation priorities. This pattern is consistent with changes in energy metabolism in sheep facing different activity levels and feeding strategies, including changes in plasma lipids , BHBA, and IMF deposition ; ; .
The association of genotypes with TG and DGAT1 expression is consistent with DGAT1’s role in triacylglycerol synthesis, but it does not prove that the variants under study alter enzyme activity. The non-significant interaction for DGAT1 expression (P= 0.976) indicates insufficient statistical evidence of differences in associations between systems, limited by the precision of the GG group.
These results also confirm that candidate gene effects do not necessarily affect all components of meat quality; in Indonesian sheep, DGAT1 has been reported to be associated with some carcass and flavour characteristics, but not consistently with cholesterol or all meat traits , b). Recent findings also suggest that energy substrate manipulation can improve IMF by altering the lipid metabolism regulatory network. Still, they may also increase the risk of oxidative stress, suggesting that the DGAT1–lipid–redox relationship should be viewed as a single biological system .
Immune-inflammatory and oxidative responses associated with dgat1 polymorphism and rearing systems
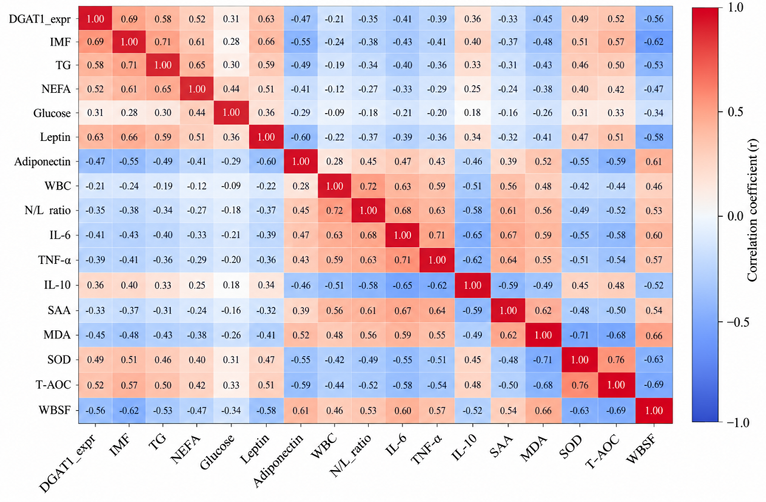
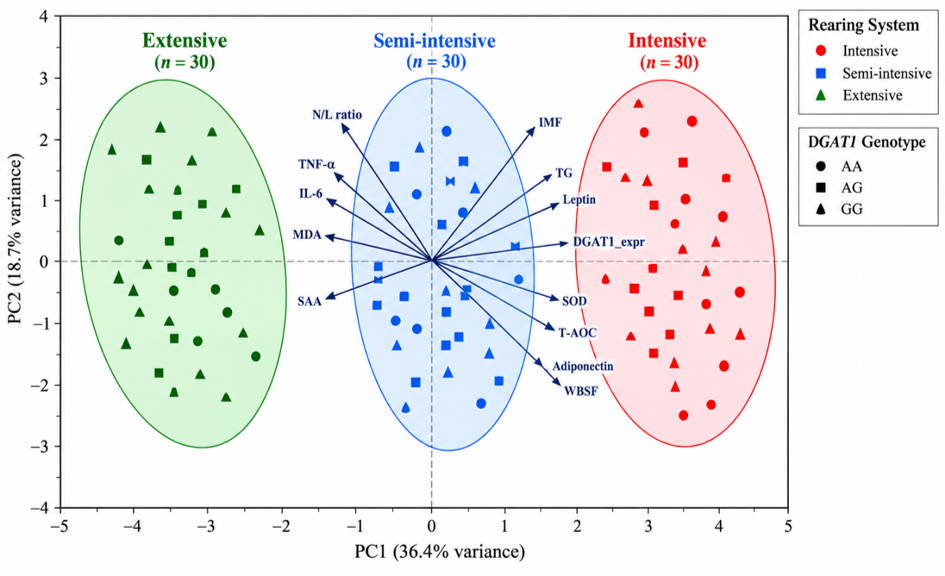
The rearing system primarily influenced immune-inflammatory responses and redox status (Table 6). IgG levels were highest in the semi-intensive system (P=0.005), as were IgM levels (P<0.001). IL-6 and TNF-α concentrations were higher in the intensive system than in the semi-intensive and extensive systems (P=0.002 and P<0.001, respectively), whereas IL-1β, IL-10, and TGF-β did not differ significantly. Haptoglobin and SAA levels also varied across systems, with the lowest values observed in the semi-intensive system. The intensive system showed the highest MDA levels, with relatively lower SOD, GPx, CAT, and T-AOC activities. NFKB1 expression was highest in the intensive system, while Nrf2 expression was higher in the semi-intensive and extensive systems (P<0.001). Pearson correlation analysis (Figure 4) reveals associations between DGAT1 expression and IMF with lipid, inflammatory, and antioxidant profiles, as well as WBSF. Furthermore, PCA (Figure 5) shows integrated phenotypic separation by rearing system, indicating that metabolic, immune, and redox responses along with meat quality are not isolated phenomena.
Elevated levels of IL-6, TNF-α, haptoglobin, SAA, MDA, and NF-κB in the intensive system indicate a more pro-inflammatory and pro-oxidative physiological environment. Concurrently, lower levels of SOD, GPx, T-AOC, and Nrf2 suggest a relatively limited antioxidant defence capacity. Conversely, the semi-intensive system exhibited higher IgG and IgM levels, lower acute-phase protein levels, and superior antioxidant status.
Table 6: Immune-inflammatory and oxidative responses by rearing system, with tests of DGAT1 genotype and genotype × rearing system interaction.
Parameter
Intensive
Semi-intensive
Extensive
P(R)
P(G)
P(G × R)
WBC (10³/µL)
9.46 ± 1.19a
9.27 ± 0.87a
9.63 ± 0.97a
0.335
0.516
0.002
Neutrophils (%)
41.2 ± 4.4a
40.4 ± 3.1a
40.2 ± 3.2a
0.531
0.152
0.339
Lymphocytes (%)
53.8 ± 4.4a
54.5 ± 3.7a
54.3 ± 3.9a
0.782
0.618
0.469
N/L ratio
0.774 ± 0.100a
0.743 ± 0.070a
0.745 ± 0.080a
0.295
0.319
0.646
IgG (mg/L)
13.5 ± 1.3b
14.6 ± 1.2a
14.1 ± 1.2ab
0.005
0.837
0.184
IgM (mg/L)
1.74 ± 0.18b
1.88 ± 0.20a
1.70 ± 0.18b
<0.001
0.126
0.333
IL-1β (pg/mL)
23.1 ± 2.9a
21.7 ± 2.7a
21.9 ± 2.2a
0.093
0.424
0.425
IL-6 (pg/mL)
14.2 ± 1.7a
12.8 ± 1.7b
12.8 ± 1.5b
0.002
0.431
0.821
TNF-α (pg/mL)
19.1 ± 2.0a
17.6 ± 2.0b
17.3 ± 1.5b
<0.001
0.401
0.525
IL-10 (pg/mL)
10.7 ± 1.2a
11.1 ± 0.9a
10.8 ± 1.1a
0.284
0.307
0.155
TGF-β (pg/mL)
31.2 ± 2.4a
31.9 ± 3.4a
31.1 ± 3.1a
0.495
0.237
0.669
Haptoglobin (g/L)
0.392 ± 0.050a
0.326 ± 0.070b
0.364 ± 0.050a
<0.001
0.461
0.934
SAA (mg/L)
7.73 ± 1.01a
6.69 ± 1.17b
7.16 ± 1.23ab
0.003
0.953
0.244
MDA (nmol/mL)
2.80 ± 0.31a
2.24 ± 0.29c
2.47 ± 0.33b
<0.001
0.279
0.303
SOD (U/mL)
79.3 ± 5.8b
83.7 ± 5.2a
83.6 ± 5.2a
0.002
0.106
0.762
GPx (U/mL)
64.5 ± 6.1b
70.3 ± 6.5a
73.6 ± 5.0a
<0.001
0.267
0.564
CAT (U/mL)
43.7 ± 3.8b
45.1 ± 3.9ab
47.3 ± 4.2a
0.003
0.949
0.431
T-AOC (mmol/L)
1.27 ± 0.12b
1.49 ± 0.13a
1.48 ± 0.15a
<0.001
0.058
0.794
NFKB1 relative expression (2^-ΔΔCt)
1.190 ± 0.110a
0.938 ± 0.130b
0.991 ± 0.110b
<0.001
0.143
0.591
NFE2L2 (Nrf2) relative expression (2^-ΔΔCt)
0.873 ± 0.100b
1.080 ± 0.160a
1.150 ± 0.120a
<0.001
0.131
0.579
Values are mean ± SD (n = 30 per rearing system). Different superscript letters within a row indicate significant differences among rearing systems (Tukey test, P < 0.05). P-values are from a two-way ANOVA for rearing system, DGAT1 genotype, and their interaction (G×R). WBC = white blood cells; N/L = neutrophil-to-lymphocyte ratio; IgG/IgM = immunoglobulin G/M; IL = interleukin; TNF-α = tumour necrosis factor-α; TGF-β = transforming growth factor-β; SAA = serum amyloid A; MDA = malondialdehyde; SOD = superoxide dismutase; GPx = glutathione peroxidase; CAT = catalase; T-AOC = total antioxidant capacity; NFKB1 dan NFE2L2 = target transkrip terkait NF-κB dan Nrf2.
These patterns suggest that controlled physical activity and moderate environmental exposure can foster a more favourable immunometabolic balance compared to either highly intensive conditions or the higher activity levels associated with extensive systems. The relationship between nutritional environment, inflammation, and antioxidant defence in sheep has been documented through changes in IL-1β/IL-6, immunoglobulins, MDA, SOD, GPx, CAT, T-AOC, and immune-related transcriptomic pathways ; ; . Other studies indicate that enhanced antioxidant capacity can coincide with improvements in meat stability or quality ; ; ; .
The heatmap in Figure 4 illustrates a positive association between DGAT1 expression and IMF, TG, leptin, SOD, and T-AOC, alongside a negative association with WBSF and several inflammatory markers. This pattern represents a descriptive relationship rather than evidence of causality. Mean differences between systems may influence combined correlations and do not necessarily reflect relationships within each system. The direction of correlations with inflammatory and antioxidant markers also warrants scrutiny, as they do not entirely align with the system mean patterns shown in Tables 5–6. The separation observed in the PCA (Figure 5) summarises variation among the analysed variables but does not provide independent evidence that the rearing system caused phenotypic differentiation. Integrating genetic and phenotypic information remains relevant, as demonstrated by research on candidate genes in Indonesian sheep .
Overall, the findings indicate that DGAT1 plays a primary role in the lipid phenotype, whereas the rearing system establishes the metabolic, immune, and redox context in which that phenotype is expressed. Thus, the multivariate interpretation in this study aligns with the direction of modern research, which positions meat quality as the outcome of interactions between genetics, lipid metabolism, antioxidant status, and the rearing environment ; ; ; . Study limitations include potential confounding among feed composition, physical activity, environmental exposure, and husbandry systems. Without details on allocation and pen/paddock replication, the specific contribution of each factor cannot be disentangled. The GG genotype comprised only 12 animals in total, potentially limiting the precision of interaction estimates; non-significant interactions do not prove equivalence across systems. Testing multiple biomarkers increases the risk of false-positive findings and necessitates adjustments for multiple comparisons. Furthermore, mRNA expression does not directly measure protein activity, and PCA and correlation analyses are exploratory. Practical findings support evaluating the balance between production, fat deposition, and physiological status; however, using DGAT1 for selection requires variant validation and replication in independent populations. Generalizability is limited to the specific animals and research conditions actually included in the study.
CONCLUSION
DGAT1 polymorphisms identified in the Garut sheep dataset were primarily associated with fat deposition, TG levels, and DGAT1 expression. In contrast, the rearing system was associated with variations in performance, carcass characteristics, metabolism, inflammation, and antioxidant status. The intensive system showed higher growth and fat deposition, with more pronounced inflammatory and oxidative profiles. Most genotype × system interactions were non-significant; however, interactions regarding total protein and WBC counts warranted simple effect analysis, and these results do not confirm that genetic and environmental contributions are entirely additive. DGAT1 shows potential as a candidate marker for lipid phenotypes, provided that variant identity, genotyping validity, study design structure, and the consistency of analytical outputs are confirmed. Its application in selection and generalisation across populations requires independent validation.
ACKNOWLEDGEMENTS
The authors thank the Rector of Universitas Padjadjaran for funding this research through the Universitas Padjadjaran Research Grant (HRU) under the RPLK scheme.
NOVELTY STATEMENT
Novelty Statement: This research focuses on an integrative approach that does not position DGAT1 solely as a candidate gene for fat deposition or carcass traits. The study links DGAT1 variation and expression with contrasting rearing systems, energy-lipid metabolism, immune-inflammatory responses, NF-κB/Nrf2 balance, antioxidant status, and carcass and meat quality endpoints within a single biological framework in Garut sheep. This genotype-by-environment approach provides a basis for understanding how DGAT1 genetic variation translates into meat phenotypes through an immunometabolic context and rearing environment.
AUTHOR’S CONTRIBUTION
All authors listed in this article contributed equally, including planning, investigation, formal analysis, validation, data curation, implementation, and writing.
Ethical approval
The Ethical Review Committee for Animal Experiments, Directorate of Research and Technology, DRT-Indonesia, reviewed and approved all procedures of this study under number 3922/An.Res.ER /07/2025.
Generate AI and AI-assisted technology statement
The authors did not use AI applications or similar technology when preparing the article.
Conflicts of interest
The authors have declared no conflicts of interest.
Figures
Figure 1:.
Distribution of DGAT1 genotypes across contrasting rearing systems. Total n= 90; n= 30 for each system. Based on the proportions shown, the counts for each system are AA = 14, AG= 12, and GG = 4.
Figure 2:.
Electrophoresis results of DGAT1 amplification products in Garut sheep samples. M = DNA marker; lanes 1–50 = individual samples. Forty other samples are not shown due to inadequate image quality. This image shows amplification products and does not independently confirm the AA, AG, and GG genotypes.
Figure 3:.
DGAT1 relative expression according to genotype and rearing system (mean ± SD).
Principal component analysis of the integrated phenotype. The colours red, blue, and green represent intensive, semi-intensive, and extensive systems, respectively; the circle, square, and triangle symbols represent the AA, AG, and GG genotypes. Each point represents an individual animal, with n = 30 per system as indicated in the figure labels. Arrows depict variable loadings on the PC1–PC2 plane.
References
Amri F, Gunawan A, Sumantri C (2023a). Effect of DGAT1 gene on hot and cold carcass, neck, and non-carcass traits in Indonesian sheep. J. Anim. Prod. Sci. Technol., 11(1): 48-53 https://doi.org/10.29244/jipthp.11.1.48-53.[CrossRef]
Amri F, Harahap RS, Sumantri C, Inounu I, Depison, Alwi Y, Gunawan A (2023b). Association of DGAT1 gene related to flavour, odour, cholesterol, and minerals in Indonesian Sheep. J. Anim. Vet. Sci., 28(2): 122-128. https://doi.org/10.14334/jitv.v28i2.3152[CrossRef]
An Y, Wang H, Gao A, Li S, Yang J, Li B, Lu H (2024). Effects of Sophora alopecuroides in a high-concentrate diet on the liver immunity and antioxidant function of lambs according to transcriptome analysis. Animals, 14(2): 182. https://doi.org/10.3390/ani14020182[CrossRef]
Begenova A, Nurgulsim K, Otepova G, Bekenova A, Bissengaliyev R, Baibolin Z, Kulmagambetov T (2026). Detection of the DGAT1 gene variation and its association with growth traits in Degeres sheep. Animals, 16(16): 2583. https://doi.org/10.3390/ani16162583[CrossRef]
Chen G, Harwood JL, Lemieux MJ, Stone SJ, Weselake RJ (2022). Acyl-CoA: diacylglycerol acyltransferase: Properties, physiological roles, metabolic engineering and intentional control. Progress in Lipid Research. 88:101181. https://doi.org/10.1016/j.plipres.2022.101181[CrossRef]
Dai R, Zhou H, Fang Q, Zhou P, Yang Y, Jiang S, Hickford JGH (2022). Variation in ovine DGAT1 and its association with carcass muscle traits in Southdown sheep. Genes, 13(9): 1670. https://doi.org/10.3390/genes13091670[CrossRef]
Dudi D, Hilmia N, Khaerunnisa I, Mushawwir A (2023). DGAT1 gene polymorphism and its association with fat deposition and carcass quality in Pasundan cattle of Indonesia. Biodiversitas, 24(7): 4202-4208. https://doi.org/10.13057/biodiv/d240765[CrossRef]
Gang G, Gao R, Li R, Jin X, Xing Y, Yan S, Xu Y, Shi B (2025). Study on the regulatory effect of water extract of Artemisia annua L. on antioxidant function of mutton sheep via the Keap1/Nrf2 signalling pathway. Antioxidants, 14(7): 885. https://doi.org/10.3390/antiox14070885[CrossRef]
Gunawan A, Harahap RS, Listyarini K, Sumantri C (2019). Identifikasi keragaman gen DGAT1 serta asosiasinya terhadap karakteristik karkas dan sifat perlemakan domba. J. Ilmu Teknol. Petern. Trop., 6(2): 259–266. https://doi.org/10.33772/jitro.v6i2.7141[CrossRef]
Harahap RS, Gunawan A, Endrawati YC, Darusman HS, Andersson G, Noor RR (2024). A comprehensive study of CYP2E1 and its role in carcass characteristics and chemical lamb meat quality in different indonesian sheep breeds. PLoS One, 19: e0310336. https://doi.org/10.1371/journal.pone.0310336[CrossRef]
Huang Y, Liu L, Zhao M, Zhang X, Chen J, Zhang Z, Cheng X, Ren C (2023). Feeding regimens affecting carcass and quality attributes of sheep and goat meat: A comprehensive review. Anim. Biosci., 36(9): 1314-1326. https://doi.org/10.5713/ab.23.0051[CrossRef]
Jin Y, Zhou Y (2022). Effects of Concentrate level and chromium-methionine supplementation on the performance, nutrient digestibility, rumen fermentation, blood metabolites, and meat quality of tan lambs. Anim. Biosci., 35(5): 677-689. https://doi.org/10.5713/ab.20.0802[CrossRef]
Ke T, Zhao M, Zhang X, Cheng Y, Sun Y, Wang P, Ren C, Cheng X, Zhang Z, Huang Y (2023). Review of feeding systems affecting production, carcass attributes, and meat quality of ovine and caprine species. Life, 13(5): 1215. https://doi.org/10.3390/life13051215[CrossRef]
Khan MZ, Ma Y, Ma J, Xiao J, Liu Y, Liu S, Khan A, Khan IM, Cao Z (2021). Association of DGAT1 with cattle, buffalo, goat, and sheep milk and meat production traits. Front. Vet. Sci., 8: 712470. https://doi.org/10.3389/fvets.2021.712470[CrossRef]
Li B, Li X, Cheng L, Li J, Liu Q, Duan G, Yan Y, Xu Y, Zhao J, Wang B, Zhang C (2026). Impact of dietary selenium supplementation on growth performance, rumen fermentation, antioxidant profiles, and meat quality in lambs on a high-concentrate diet. Anim. Feed Sci. Technol., 333: 116614. https://doi.org/10.1016/j.anifeedsci.2025.116614[CrossRef]
Li Q, Wu Y, Qi X, Liu Z, Wang C, Ma X, Ma Y (2024). Effects of prickly ash seed dietary supplementation on meat quality, antioxidative capability, and metabolite characteristics of hu lambs. Foods, 13(21): 3415. https://doi.org/10.3390/foods13213415[CrossRef]
Liang Y, Shi J, Cheng X, Feng M, Jiao D, Du X, Ji K, Hu S, Dong Q, Yang G (2026). Integrative transcriptomics and metabolomics analyses reveal changes in meat quality and muscle lipid metabolism in sheep supplemented with rumen-protected glucose. Meat Sci., 238: 110110. https://doi.org/10.1016/j.meatsci.2026.110110[CrossRef]
Mayahi S, Chaji M, Shojaeian K, Jalilvand G (2025). Effect of portulaca oleracea on carcass traits, fatty acid composition, meat quality and oxidative stability of Arabi lambs. Vet. Med. Sci., 11(2): e70224. https://doi.org/10.1002/vms3.70224[CrossRef]
Permana R, Yamin M, Priyanto R, Gunawan A, Astuti DA (2021). The effects of exercise models on haematological profile and meat physical quality in Garut sheep. J. Kedokteran Hewan, 14(4): 103-107. https://doi.org/10.21157/j.ked.hewan.v14i4.16035[CrossRef]
Permana R (2022). Status hematologi, kualitas daging dan potensi polimorfisme gen DGAT1 Domba Garut yang Dipelihara Menurut Prinsip Pertanian Organik. IPB University. https://repository.ipb.ac.id/handle/123456789/112176 (PERLU LENGKAPI jenis karya dari metadata repositori.)
Pethick DW, Hocquette JF, Scollan ND, Dunshea FR (2021). Review: Improving the nutritional, sensory and market value of meat products from sheep and cattle. Animal, 15 (Suppl 1):100356. https://doi.org/10.1016/j.animal.2021.100356[CrossRef]
Prache S, Schreurs N, Guillier L (2022). Review: Factors affecting sheep carcass and meat quality attributes. Animal, 16(Suppl 1): 100330. https://doi.org/10.1016/j.animal.2021.100330[CrossRef]
Redoy MRA, Shuvo AAS, Cheng L, Al-Mamun M (2020). Effect of herbal supplementation on growth, immunity, rumen histology, serum antioxidants and meat quality of sheep. Animal, 14(11): 2433-2441. https://doi.org/10.1017/S1751731120001196[CrossRef]
Sadrarhami I, Alikhani M, Ghasemi E, Mahdavi AH, Soltanizadeh N, Font-i-Furnols M, Hosseini Ghaffari M (2022). Effects of nomadic grazing systems and indoor concentrate feeding systems on performance, behaviour, blood parameters, and meat quality of finishing lambs. PLoS One, 17(12): e0278669. https://doi.org/10.1371/journal.pone.0278669[CrossRef]
Song P, Huo G, Feng J, Zhang W, Li X, Zhao J (2023). Intramuscular vitamin an injection in newborn lambs enhances antioxidant capacity and improves meat quality. Front. Vet. Sci., 10: 1272874. https://doi.org/10.3389/fvets.2023.1272874[CrossRef]
Suliman GM, Al-Owaimer AN, El-Waziry AM, Hussein EOS, Abuelfatah K, Swelum AA (2021). A Comparative study of sheep breeds: Fattening performance, carcass characteristics, meat chemical composition and quality attributes. Front. Vet. Sci., 8: 647192. https://doi.org/10.3389/fvets.2021.647192[CrossRef]
Tanuwiria UH, Mushawwir A, Zain M, Despal D (2023). Impact of protein source from legume forages on lipid regulation and growth on native ram lambs reared extensively in the south coast of West Java, Indonesia. Biodiversitas, 24(7): 4183–4192. https://doi.org/10.13057/biodiv/d240763[CrossRef]
Valadez-García KM, Avendaño-Reyes L, Díaz-Molina R, Mellado M, Meza-Herrera CA, Correa-Calderón A, Macías-Cruz U (2021). Free ferulic acid supplementation of heat-stressed hair ewe lambs: Oxidative status, feedlot performance, carcass traits and meat quality. Meat Sci., 173: 108395. https://doi.org/10.1016/j.meatsci.2020.108395[CrossRef]
Wang B, Wang Y, Zuo S, Peng S, Wang Z, Zhang Y, Luo H (2021a). Untargeted and targeted metabolomics profiling of muscle reveals enhanced meat quality in artificial pasture grazing tan lambs via rescheduling the rumen bacterial community. J. Agric. Food Chem., 69(2): 846-858. https://doi.org/10.1021/acs.jafc.0c06427[CrossRef]
Wang B, Wang Z, Chen Y, Liu X, Liu K, Zhang Y, Luo H (2021b). Carcass traits, meat quality, and volatile compounds of lamb meat from different restricted grazing time and indoor supplementary feeding systems. Foods, 10(11): 2822 https://doi.org/10.3390/foods10112822.[CrossRef]
Wang W, Zhang X, Wei H, Wang S, Ye Y, He L, Zhang K, Lu Y, Zhang Z, Huang Y (2024). Effects of feeding systems on the growth performance, carcass characteristics, and meat quality in sheep: A meta-analysis. Animals, 14(18): 2738. https://doi.org/10.3390/ani14182738[CrossRef]
Wang Z, Guo L, Ding X, Li F, Xu H, Li S, Wang X, Li K, Yue X (2023). Supplementation of chestnut tannins in diets can improve meat quality and antioxidant capability in hu lambs. Meat Sci., 206: 109342. https://doi.org/10.1016/j.meatsci.2023.109342[CrossRef]
Zhang L, Zhang T, Yang Z, Cai C, Hao S, Yang L (2022b). Expression of nuclear factor kappa b in ovine maternal inguinal lymph nodes during early pregnancy. BMC Vet. Res., 18: 266. https://doi.org/10.1186/s12917-022-03373-7[CrossRef]
Zhang X, Liu C, Kong Y, Li F, Yue X (2022a). Effects of intramuscular fat on meat quality and its regulation mechanism in tan sheep. Front. Nutr., 9: 908355. https://doi.org/10.3389/fnut.2022.908355[CrossRef]
Zhang X, Zhang Z, Sun Y, Liu Y, Zhong X, Zhu J, Yu X, Lu Y, Lu Z, Sun X, Han H, Wang M (2023). Antioxidant capacity, inflammatory response, carcass characteristics and meat quality of hu sheep in response to dietary soluble protein levels with decreased crude protein content. Antioxidants, 12(12): 2098. https://doi.org/10.3390/antiox12122098[CrossRef]