Research Article · Volume 13, Issue 1, 28 February 2025 · Open Access
Association of DGAT1 and CAPN1 Gene Polymorphisms with Fatty Acid Composition in Local and Imported Veal
· · ·
Affiliations & Notes ⌄
- 1Department of Animal Production, College of Agriculture, University of Basrah, Iraq
- 2Agriculture Department of Basrah, Basrah, Iraq. *Correspondence | Muntaha Y. Yousief, Department of Animal Production, College of Agriculture, University of Basrah, Iraq
- 3Email: muntaha.yousief@uobasrah.edu.iq
Article Info ⌄
- Journal:
- Journal of Animal Health and Production
- Published:
- 28 February 2025

From the article
- Notably, the AA genotype of the DGAT1 gene was associated with higher levels of unsaturated fatty acids in meat.
- This makes it a potential genetic marker for breeding programs aimed at improving the fatty acid profile of meat.
- Furthermore, the study revealed high heritability estimates for saturated, monounsaturated, and total unsaturated fatty acids.
- This suggests a strong genetic influence on these traits, allowing for direct genetic improvement through selection of animals with favourable genotypes.
Selected from the article's own text.
Abstract
INTRODUCTION
Although there is evidence that red meat is one source of cardiovascular diseases because of saturated fatty acids, it is a rich source of essential nutrients (protein, minerals) . Additionally, a scientific report by the Advisory Committee on Dietary Guidelines suggests that dietary patterns with lower saturated fat content and higher trans-fat content are helpful in reducing the risk of cardiovascular disease .
The fatty acid (FA) composition in beef is less diet-dependent than that of non-ruminant meat. It is largely determined by essential lipid enzymes in FA synthesis pathways . Diacylglycerol acyltransferase 1 (DGAT1) encodes a microsomal enzyme, and its polymorphism has been shown to affect muscle fat in beef as well as fatty acid absorption, transport, and metabolism . The DGAT1 gene contains 17 exons and 16 introns and is located on chromosome 14 in cattle (Yousief et al., 2024).
In terms of improving meat quality, several research studies have been conducted to identify single nucleotide polymorphisms (SNPs) as they have been widely applied as genetic markers in livestock-based industries, including breeding and improvement programs ; . μ- Calpain is a key protein enzyme that plays an important role in the process of meat tenderization , thereby increasing meat tenderness. The CAPN1 gene, present on chromosome 29, consists of 21 exons and 20 introns in its underlying genetic structure ; .
The genetic trend is used to modify the FA composition in calf adipose tissue through moderate to high estimates of genotype replication, and the identification of mutations in genes that encode key enzymes involved in FA metabolism may help understand the genetic variation underlying beef ; ; . Manipulation of the composition of cattle fat is important in reducing saturated fatty acids, that contribute to cardiovascular diseases in human, secondly, the contribution of certain fatty acids to beef flavor traits; and finally, the difference in fat ductility . The latter characteristic can have different impacts on meat quality.
Several studies have dealt with the association of genes polymorphisms and different Iraqi animal performance ; . The main differences among the individuals within the breed or species is determined by genetic diversity. Analysis of heredity data by different statistical programs provide different measurements that determined the diversity between individuals within the same breed or between breeds of the same species .
Therefore, this study was conducted to assess the genetic diversity of the breeds available in Iraq based on two genetic loci, the DGAT1 and CAPN1 genes. The aim of this study was to evaluate the association between polymorphisms in the DGAT1 and CAPN1 genes and the fatty acid profile in both Iraqi local and imported cattle.
MATERIALS AND METHODS
Ethical Approval
The study has been approved by the animal ethics committee of the Department of Animal Production, College of Agriculture, University of Basrah, Basrah, Iraq.
Animals
This study included both a biochemical and a genetic component. The biochemical estimation, including the analysis of fatty acids in milk, was conducted at the Ministry of Science and Technology, Department of Environment and Water. The genetic part was carried out in the genetic engineering laboratory of the Department of Animal Production, College of Agriculture, University of Basrah In this study, 150 calves (75 local and 75 imported from Colombia) from various local breeders in Basrah Governorate were used.
Determination of Fatty Acids in Meat
Fatty acids were extracted in the central chromatography laboratory of the Department of Environment and Water, Ministry of Science and Technology. The fatty acids in veal meat (from the dorsal muscle, longissimus dorsi) were estimated using HPLC and GC-MS according to the method of Murrieta et al. (2003).
Genetic Tests
This part of the study was conducted in the molecular genetics’ laboratory of the College of Agriculture, University of Basrah. The procedure included denaturation at 95°C for 5 minutes, denaturation at 95°C for 10 seconds, annealing at 55-60°C for 20 seconds, and extension at 72°C for 10 seconds (35 cycles). For the CAPN1 primer, the sequences used were: forward 5’-AGG GTG TGA GTT GCA AAC AG-3’ and reverse 5’-AGA AGG CCA GGA AGG CTA AC-3’ . For the DGAT1 primer, the PCR cycling conditions were 94°C for 5 minutes, followed by 40 cycles of 92°C for 15 seconds, 60°C for 1 minute, and extension at 72°C for 10 seconds, with the primer sequences being F5’-CGC TTG CTC GTA GCT TTG G–3’ and R5’- CGC GGT AGG TCA GGT TGT C–3’ .
Genetic formations were determined through sequencing of the nitrogenous bases of the gene fragments. Samples of 10 microliters were sent to the Korean company Macrogen to obtain sequences of the nitrogenous bases for the required gene fragments. Sequencing was performed for the DNA strands of both the forward and reverse primers for both genes.
The PopGene program was used to estimate F statistics, genetic diversity, fixation index, and expected and observed heterozygosity. The POPGENE statistical program for population inheritance was used to perform genetic analysis of the studied populations (local and imported Colombian breeds). This included allele and genotype frequencies, genetic composition, Hardy-Weinberg equilibrium test, heterozygosity ratio, and calculation of genetic variation statistics ; such as the effective number of alleles , Shannon Index , and FIS Fixation and Statistics Index ; . All these calculations were done within POPGENE program.
Statistical Analysis
Phenotypic traits of each genotype were statistically analyzed using the SPSS statistical program (2019). Breeding values, dominant deviations, average dominance, average gene replacement effect and their variation were estimated as reported by Falconer (1981).
RESULTS AND DISCUSSION
Allele and Genotype Frequency of DGAT1 and CAPN1 Gene
Table 1 shows the frequency of alleles A and B with three genotypes (AA, AB, BB) of the DGAT1 gene and two alleles, C and G, with three genotypes (GG, CG, CC) of the CAPN1 gene. The frequency of the AA, AB, and BB genotypes of the DGAT1 gene was 0.73, 0.00, and 0.27 respectively in the local breed, and 0.33, 0.40, and 0.27 respectively in the imported breed. The frequency of alleles A and B was 0.73 and 0.27 in the local breed, and 0.53 and 0.47 in the imported breed, respectively. The distribution of genotypes differed between the two breeds, with the local breed characterized by the absence of the heterozygous genotype and a high frequency of the AA genotype, while its frequency decreased in the imported breed (Table 1).
The frequency of the CC, CG, and GG genotypes of the CAPN1 gene was 0.40, 0.27, and 0.33 respectively in the local breed, and 0.40, 0.33, and 0.27 respectively in the imported breed. The frequency of alleles C and G was 0.67 and 0.33 in the local breed, and 0.57 and 0.43 in the imported breed, respectively. The distribution of genetic structures between the two breeds showed that both the local and imported breeds had an equal frequency of the dominant genotype (CC), with a higher frequency of the GG genotype in the local breed compared to the imported breed.
Statistical analysis of the distribution of numbers according to different genetic types indicated that the local breed was not in Hardy-Weinberg equilibrium, while the imported breed was, according to the chi-square values of 16.37 and 1.90 for the two breeds, respectively, for the DGAT1 gene. For the CAPN1 gene, both breeds were in Hardy-Weinberg equilibrium, with chi- square values of 3.74 and 3.73 for the local and imported breeds, respectively.
Table 1: Allele and genotypes frequencies of DGAT1 and CAPN1 genes in the studied sample.
| Gene | Genotypes | Local | Imported | Allele frequency (local) | Allele frequency imported | ||||
| No | Frequency | No | Frequency | A | B | A | B | ||
| DGAT1 | AA | 55 | 0.73 | 25 | 0.33 | 0.73 | 0.27 | 0.53 | 0.37 |
| AB | 0 | 0 | 30 | 0.46 | X2 for local breed =16.37 (P<0.05)* | X2 for imported breed =1.90 (P>0.05)NS | |||
| BB | 20 | 0.27 | 20 | 0.27 | |||||
| Total | 75 | 1 | 75 | 1 | |||||
| CAPN1 | CC | 30 | 0.40 | 30 | 0.40 | 0.67 | 0.33 | 0.57 | 0.43 |
| CG | 20 | 0.27 | 25 | 0.33 | X2 for local breed =3.74 (P>0.05)NS | X2 for imported breed =3.73 (P>0.05)NS | |||
| GG | 25 | 0.33 | 20 | 0.27 | |||||
| Total | 75 | 1 | 75 | 1 | |||||
* Significant at P<0.05; NS: non-significant at P>0.05.
Table 2: Number of observed alleles (na), number of effective alleles (ne) and Genetic variation criteria associated with the DGAT1 and CAPN1 genes.
| Parameter | DGAT1 | CAPN1 | ||||
| Imported | Local | Both breeds | Imported | Local | Both breeds | |
| Number of observed alleles (na) | 2.0 | 2.0 | 2.0 | 2.0 | 2.0 | 2.0 |
| Effective alleles (ne) | 1.961 | 1.800 | 1.8967 | 1.9912 | 1.9912 | 1.9912 |
| Shannon Index (I) | 0.6365 | 0.6365 | 0.6657 | 0.6909 | 0.6909 | 0.6909 |
| Observed heterozygosity (Ho)% | 33.33 | 0.000 | 0.1667 | 26.67 | 26.67 | 26.67 |
| Expected heterozygosity (He)% | 50.80 | 45.98 | 48.08 | 51.49 | 51.49 | 50.62 |
Number of Observed Alleles (na) and Number of Effective Alleles (ne) and Shannon Index
When analysing the genetic variation resulting from the distribution of the genetic structures of the DGAT1 and CAPN1 genes (Table 2) in both the local and imported breeds, it was found that the two breeds were similar in the number of observed alleles for both genes. The number of effective alleles ne was calculated using the method of Kimura and Crow (1964). The local breed showed a decrease in the number of effective alleles by 1.800 compared to the imported breed 1.9651 for the DGAT1 gene. The number of effective alleles of the CAPN1 gene for the local and imported breeds was equal at 1.9912. The effective number of alleles indicates the number needed to achieve Hardy- Weinberg equilibrium, reflecting the requirement for a close number of alleles to achieve equilibrium in the two groups of animals studied. Effective allele number is a significant measure, takes into account allele frequencies rather than just counting alleles. Population with highly skewed allele frequency (extremely one allele abundant) have low effective allele number . Effective number is a key predictor of genetic diversity, as well as, higher value reflects higher heterozygosity, balance allele frequency and better adaptation, in contrary low value produce allele fixation, losing heterozygosity and enhance extinction risk .
The Shannon index (I), one of the diversity indicators used to measure frequency in ordinal data , was slightly higher in the imported calf’s group (0.6842) for the DGAT1 gene, while the Shannon index (I) of the CAPN1 gene was similar for both local and imported calves, reaching 0.6909. These results are not consistent with Alfonso et al. (2012), who found that the value of the Shannon index in American Suez cattle was 0.3762.
The Shannon Information Index (I) indicates the probability of uniformity to distinguish individual differences . The Shannon-Weiner Index is a useful tool for estimating genetic diversity in many studies. It can describe differences at various levels of genetic organization, ranging from polymorphism to single nucleotides, and has been widely used in studies related to tribal genetics and genomics programs. Studies on genetic diversity and variation quickly adopted the Shannon Index ;. Paetkau et al. (1995) demonstrated that the index considers all species present in an ecosystem, regardless of the total number, and whether it can differentiate between places dominated by a single species, a few species, or a few dominant species. The Shannon test could also be used in botanical and ecological studies to determine the degree of variance.
Percentage of Observed and Expected Heterozygosity
As for the observed heterozygosity, which indicates mating between unrelated individuals or between males and females from different herds, there was a significant increase in heterozygosity compared to homozygosity . The imported breed was characterized by a high percentage (33.33%) compared to the local breed (0.00), which showed no allelic heterozygosity for the DGAT1 gene. However, the difference was in the percentage of expected allelic mixing between the two breeds, with values of 50.80% and 45.98%.
The heterozygosity rate in the local breed is low, indicating a high presence of homologous genetic structures, suggesting that relatives are mating within the same herd, which increases the proportion of pure genetic structures. The heterozygosity rate reflects the range of gene flow, with a value of 0.00% indicating a decrease in the presence of genetic structures from outside the studied herd, especially in the local breed (Fis = 0.4643), where there is a high percentage of relative mating. The observed heterozygosity for the CAPN1 gene in both the local and imported breeds was similar (26.67%). The expected heterozygosity was also similar (51.49%).
The observed heterozygosity values are higher than the expected heterozygosity values in both the imported and local calf groups for both genes. This indicates a high genetic variation among individuals within the populations.
Inbreeding and Gene Flow
Table 3 shows the index of individual fixation (Fis) within the population for the DGAT1 and CAPN1 genes (0.4643 and 0.6437, respectively). These positive values indicate the presence of inbreeding. Our results differ from those of Golijow et al. (1999), who reported negative values of -0.027 and -0.081 and FST values of 0.006 and 0.036 for Argentine Holstein and Creole cattle breeds, respectively.
Table 3: Inbreeding Coefficient and Gene Flow of DGAT1 and CAPN1 Genes.
| Locus | Fis | Fit | Fst | Nm |
| DGAT1 | 0.6437 | 0.6475 | 0.0106 | 23.3889 |
| CAPN1 | 0.6437 | 0.6475 | 0.0106 | - |
| Mean | 0.5512 | 0.5535 | 0.0052 | 48.2778 |
*Nm: Gene flow estimated from; Fst: 0.25(1 - Fst) *Fst.-1
The Fis values (or expected inbreeding within the local and imported calves) are greater than zero, indicating inbreeding between animals. This is further supported by the observed decrease in heterozygosity compared to the expected heterozygosity for the breed. The average fixation index reflects the accumulation of genetic variation at specific sites and breed equilibrium. Balanced populations tend to have a low fixation index.
Breeding Values and Dominant Deviations of DGAT1 Gene
Positive breeding values were observed for genotypes AB, BB (imported breed), and AA (local breed) for saturated fatty acids (Table 4). These values were 0.206, 1.754, and 0.583, respectively. In contrast, the AA genotype in the imported breed and BB genotype in the local breed had negative breeding values (-1.342 and-1.575, respectively). Similar trends were observed for monounsaturated fatty acids. Here, genotypes AB and BB (imported breed) and AA (local breed) had positive breeding values (0.055, 0.470, and 0.155, respectively), while the BB genotypes in both breeds had negative values (- 0.360 and -0.132). Interestingly, poly- and total unsaturated fatty acids showed an opposite trend compared to saturated and monounsaturated fatty acids. The AA genotype of the imported breed appears favorable for improving polyunsaturated fatty acid production. The AB genotype in the imported breed displayed negative dominance for saturated, polyunsaturated, and total unsaturated fatty acids (-0.047, -0.103, and -1.02, respectively).
Table 4: Genetic value, the average gene effect substitution α, breeding value BV, and dominant deviation of DGAT1 gene, in local and imported calves’ meat
| Breed | Genotypes | G | α | BV | D |
| Saturated fatty acids | |||||
| Imported | AA | -1.563 | - 1.550 | -1.342 | 0.036 |
| AB | -0.096 | 0.206 | -0.047 | ||
| BB | 1.563 | 1.754 | 0.062 | ||
| Local | AA | 1.079 | - 1.079 | 0.583 | 0.00 |
| BB | -1.079 | -1.575 | 0.00 | ||
| Mono-unsaturated | |||||
| Imported | AA | -0.415 | - 0.415 | -0.360 | -0.00037 |
| AB | 0.001 | 0.055 | 0.00049 | ||
| BB | 0.415 | 0.470 | -0.00064 | ||
| Local | AA | 0.287 | - 0.287 | 0.155 | 0.00 |
| BB | -0.287 | -0.132 | 0.00 | ||
| Poly-unsaturated fatty acids | |||||
| Imported | AA | -0.415 | 0.551 | 0.477 | 0.078 |
| AB | 0.001 | -0.073 | -0.103 | ||
| BB | 0.415 | -0.623 | 0.134 | ||
| Local | AA | 0.287 | 0.224 | -0.121 | 0.00 |
| BB | -0.287 | 0.103 | 0.00 | ||
| Total unsaturated fatty acids | |||||
| Imported | AA | 0.523 | 0.135 | 0.117 | 0.078 |
| AB | -0.209 | -0.018 | -0.102 | ||
| BB | -0.523 | -0.153 | 0.133 | ||
| Local | AA | -0.224 | -0.063 | -0.029 | 0.00 |
| BB | 0.224 | 0.034 | 0.00 | ||
α: The average gene effect substitution; BV: Breeding value; D: Dominance deviation; G: genetic value of Gene (DGAT1).
Similarly, the homozygous genotypes (AA and BB) in the imported breed had negative values (-0.00037 and -00064, respectively). Most other genotypes showed positive dominance effects in both breeds for all fatty acids. In conclusion, this gene appears to have both additive and dominant effects. Allele A has a positive additive effect, while some genotypes exhibit dominant effects, all of which can contribute to improved meat quality. This information can be valuable for breeding programs aiming to enhance fatty acid profiles in meat. When a population in Hardy- Weinberg equilibrium there is a positive correlation between breeding value and dominant deviation a cross QTL unless there is a directional selection .
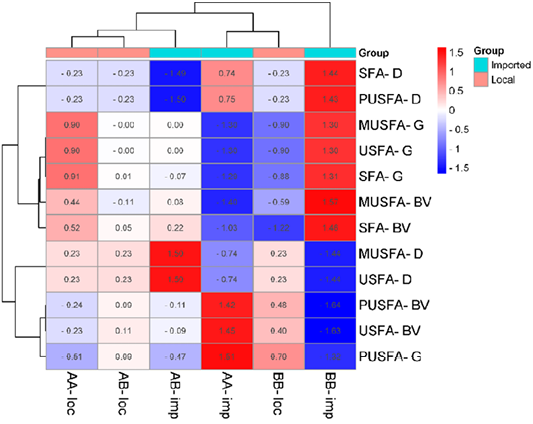
Figure 1 shows that the BB genotype of the DGAT1 gene of the imported animals shows positive values ranging from 1.30 to 1.57 for both the dominance deviations of saturated and polyunsaturated fatty acids and the genetic values of saturated, monounsaturated and total fatty acids as well as the breeding values of saturated and monounsaturated fatty acids. On the other hand, the same structure showed negative values for both the dominance deviations of monounsaturated and total fatty acids and the educational values of polyunsaturated and total fatty acids and the genetic values of polyunsaturated fatty acids (-1.32 to -1.64). While the same genotype (BB) of the same gene (DGAT1) in the local breed behaved oppositely in local animals compared to imported animals. Also, the genotype AA of imported animals behaved oppositely to that of local animals, as imported animals showed negative values for the genotype AA for both the genetic values of monounsaturated and total unsaturated fatty acids and saturated acids, as well as the breeding values of monounsaturated and saturated unsaturated acids and the dominance deviations for monounsaturated and total unsaturated acids and positive values in the rest of the traits (dominance deviations for saturated and polyunsaturated fatty acids and the breeding values for both polyunsaturated and total unsaturated fatty acids and the genetic value of polyunsaturated fatty acids) in contrast to the local breed. As for the hybrid genotype (AB) of the local and imported breeds, the values behaved similarly in most traits for both breeds together.
Table 5: Genetic value, the average gene effect substitution α, breeding value BV, and dominant deviation of CAPN1 Gene for local and imported calves’ meat.
| Breed | Genotypes | G | α | BV | D |
| Saturated fatty acids | |||||
| imported | CC | -1.499 | -1.459 | -0.539 | -0.107 |
| CG | -0.289 | 0.204 | -0.142 | ||
| GG | 1.499 | 1.663 | -0.188 | ||
| Local | CC | -1.840 | -1.982 | -1.308 | 0.091 |
| CG | 0.417 | 0.674 | 0.185 | ||
| GG | 1.840 | 2.656 | -0.375 | ||
| Mono- Unsaturated fatty acids | |||||
| Imported | CC | -0.382 | -0.384 | -0.142 | 0.005 |
| CG | 0.013 | 0.054 | 0.006 | ||
| GG | 0.382 | 0.438 | 0.008 | ||
| Local | CC | -1.162 | -1.148 | -0.757 | -0.009 |
| CG | -0.042 | 0.390 | -0.019 | ||
| GG | 1.162 | 1.538 | 0.038 | ||
| Poly-unsaturated fatty acids | |||||
| Imported | CC | 0.498 | 0.528 | 0.195 | -0.080 |
| CG | -0.218 | -0.074 | -0.107 | ||
| GG | -0.498 | -0.602 | -0.141 | ||
| Local | CC | 0.397 | 0.388 | 0.256 | 0.006 |
| CG | 0.027 | -0.132 | 0.012 | ||
| GG | -0.397 | -0.520 | -0.024 | ||
| Total unsaturated fatty acids | |||||
| Imported | CC | 0.116 | 0.145 | 0.053 | -0.076 |
| CG | -0.204 | -0.020 | -0.100 | ||
| GG | -0.116 | -0.165 | -0.133 | ||
| Local | CC | -0.765 | 0.760 | 0.501 | -0.003 |
| CG | -0.015 | -0.258 | -0.007 | ||
| GG | 0.765- | -0.018 | 0.014 | ||
α =The average gene effect substitution, BV= Breeding value, D= Dominance deviation, G= Genetic value of gene (CAPN1).
Table 5 reveals that the dominant CC genotype in both imported and local breeds exhibits negative breeding values for monounsaturated fatty acids (- 0.539, -1.308) and conversely, positive values for polyunsaturated and total unsaturated fatty acids (0.195, 0.256, 0.053, and 0.501 for the two breeds and fatty acid types, respectively).
In simpler terms, animals with the CC genotype tend to have lower levels of monounsaturated fatty acids but higher levels of polyunsaturated and total unsaturated fatty acids compared to the herd average. This suggests that selecting individuals with the CC genotype could be beneficial for breeding programs aiming to increase the production of polyunsaturated fatty acids in meat.
It’s important to note that most dominance deviations for the CAPN1 gene were negative across fatty acid types and breeds. This requires further investigation to understand the complete picture of gene dominance for this particular gene.
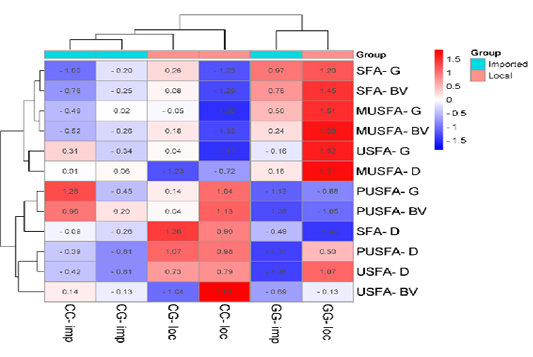
Figure 2 shows the relationship between the genetic structures of the CAPN1 gene and the genetic and breeding values and dominance deviations of the imported and local strains. The genetic structure GG of the local strain showed positive values in most of the traits ranging from 0.50 to 1.71 except for some that had negative values, which are the genetic value of unsaturated fatty acids, the breeding values of polyunsaturated and total fatty acids, and dominance deviations of saturated fatty acids. As for the imported animals, they behaved similarly in most of the traits and different in others. As for the genetic structure CC of the local animals, half of the traits had positive values (the genetic value of polyunsaturated fatty acids, dominance deviations of saturated, polyunsaturated and total fatty acids, and genetic values of total unsaturated acids) and the rest of the traits had negative values. As for the imported animals, most of the traits had negative values. The genetic composition CG of the two strains (local and imported) had opposite behaviors in all traits.
Heritability of Fatty Acids
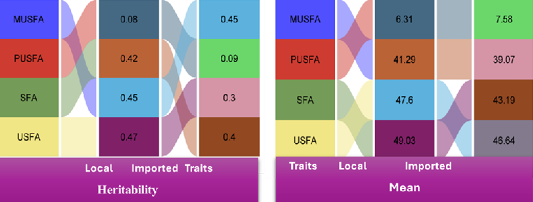
Studies examining fatty acid composition in veal reveal variations in heritability. Figure 3 shows heritability estimates for various fatty acids in local and imported veal breeds, ranging from 0.09 to 0.47. This indicates a moderate to high genetic influence on most fatty acids. However, polyunsaturated fatty acids have a significantly lower heritability (0.08), suggesting a stronger environmental impact. This aligns with research indicating cattle primarily obtain polyunsaturated fats from their feed ; .
These high values of heritability differ from what is found in different studies because there are many environmental factors, the method of calculation and different breeds. Inoue et al. (2011) estimated heritability for individual fatty acids to be 0.65- 0.82. Whereas, Oka et al. (2002) estimated lower heritability (0.14 C 0.21) in Japanese beef cattle. Differences in these estimates are difficult to reconcile because they include different breeds and production systems.
The composition of fatty acids is associated with flavor and taste of cattle meat . Thus, meat fatty acids are one of the most important factors affecting the quality of beef. Fatty acid composition is influenced by sex, diet, and age ; ; .
Estimates of phenotypic and genetic parameters of total fatty acid ratio of cows have been previously reported . To find out the genetic variation in fatty acid content in beef, studies of genetic parameters have been estimated where these parts are known to be derived from different biological pathways and feed sources .
In general, heritability of short to medium-chain fatty acids that included 14:0 to 18:1 carbon atom was ranging from 0.32 to 0.64. This is likely due to an increased genetic contribution to the total variation of the synthesis of fatty acids through the FASN, which produces mainly 16:0 and 14:0 carbon atoms . The same study also concluded that with increasing obesity, an increasing number of biological pathways are likely to be involved in the regulation of adipose tissue formation, leading to a higher genetic equivalent. For fatty acid classes, SFA showed a heritability higher than 0.50, with MUFA showing 0.46. While lower heritability estimate of fatty acids were found by Inoue et al. (2011); Nogi et al. (2011); Saatchi et al. (2013).
CONCLUSIONS AND RECOMMENDATIONS
This study identified polymorphisms in two genes, each with two alleles and several genotypes. Notably, the AA genotype of the DGAT1 gene was associated with higher levels of unsaturated fatty acids in meat. This makes it a potential genetic marker for breeding programs aimed at improving the fatty acid profile of meat. Furthermore, the study revealed high heritability estimates for saturated, monounsaturated, and total unsaturated fatty acids. This suggests a strong genetic influence on these traits, allowing for direct genetic improvement through selection of animals with favourable genotypes.
ACKNOWLEDGEMENTS
The authors acknowledge the support of staff of Department of Animal Production, College of Agriculture, University of Basrah for conducting the research work.
NOVELTY STATEMENTS
This study is the first to investigate the association between **DGAT1 and CAPN1 gene polymorphisms* and *fatty acid composition* in both *local and imported veal*. While previous research has examined these genes in relation to meat quality, our work uniquely compares genetic influences across different veal sources, providing new insights into how genetic variation affects fatty acid profiles in diverse production systems. These findings contribute to a better understanding of genetic markers for meat quality improvement and nutritional value
AUTHOR’S CONTRIBUTIONS
B.F.Z. meat samples collection, statistical analysis and writing part of the manuscript.
M.Y.Y. meat samples collection, suggest a title of the manuscript and writing part of the manuscript.
E.H.M. laboratory methodology
H.A.A. Evaluation and writing part of the manuscript.
Conflict of Interest
The authors declare that they have no conflict of interests.
Figures

The relationship between genetic value, breeding value (BV), dominant skewness and genotypes of DGAT1 gene in local and imported veal meat.

The relationship between genetic value, breeding value (BV), dominant skewness and genotypes of CAPN1 gene in local and imported veal meat.

Genetic equivalent and average saturated and unsaturated fatty acids for local and imported veal meat.
References
- Alfonso E, Rojas R, Herrera JG, Ortega, ME, Lemus C, Cortez C, Gómez H (2012). Polymorphism of the prolactin gene (PRL) and its relationship with milk production in American Swiss cattle. Afr. J. Biotech., 11: (29).
- Anton I, Kovács K, Holló G, Farkas V, Lehel L, Hajda Z, Zsolnai A (2011). Effect of leptin, DGAT1 and TG gene polymorphisms on the intramuscular fat of Angus cattle in Hungary. Livestock Sci., 135: 300-303. https://doi.org/10.1016/j.livsci.2010.07.012[CrossRef]
- Ayied AY, Zaqeer BF (2018). Relationship between ND5 genetic polymorphism and milk production and the growth of lambs before weaning of Awassi sheep. Int. J. Sci. Res., 8: 810-814.
- Bartoň L, Bureš D, Kott T, Řehák D (2016). Associations of polymorphisms in bovine DGAT1, FABP4, FASN, and PPARGC1A genes with intramuscular fat content and the fatty acid composition of muscle and subcutaneous fat in Fleckvieh bulls. Meat Sci., 114: 18-23. https://doi.org/10.1016/j.meatsci.2015.12.004[CrossRef]
- Bigornia SJ, Noel SE, Porter C, Zhang X, Talegawker SA, Carithers T, Correa A, Tucker KL (2022). Red meat consumption, incident CVD and the influence of dietary quality in the Jackson Heart Study. Pub. Health Nutr., 26: 1–10. https://doi.org/10.1017/S1368980022001434[CrossRef]
- Casas E, White SN, Wheeler TL, Shackelford SD, Koohmaraie M, Riley DG, Smith TPL (2006). Effects of beef cattle on tenderness traits. J. Anim. Sci., 84(3): 520-525. https://doi.org/10.2527/2006.843520x[CrossRef]
- Chen D, Wang X, Guo Q, Deng H, Luo J, Yi K, Sun A, Chen K, Shen Q (2022). Muscle fatty acids, meat flavor compounds and sensory characteristics of Xiangxi Yellow cattle in comparison to Aberdeen Angus. Anim. Sci., 12: 1161. https://doi.org/10.3390/ani12091161[CrossRef]
- Dar AH, Kumar S, Mukesh M, Ahmad SF, Singh DV, Sharma RK, Sodhi M (2020). Genetic characterization and population structure of different coat colour variants of Badri cattle. Mol. Bio. Rep., 47: 8485-8497. https://doi.org/10.1007/s11033-020-05890-w[CrossRef]
- Ekine-Dzivenu C, Chen L, Vinsky M, Aldai N, Dugan ME, McAllister TA, Li C (2014). Estimates of genetic parameters for fatty acids in brisket adipose tissue of Canadian commercial crossbred beef steers. Meat Sci., 96: 1517-1526. https://doi.org/10.1016/j.meatsci.2013.10.011[CrossRef]
- Falconer DS, (1981). Introduction to quantitative genetics. 2ed. Longman, UK.
- Felsenstein J (1975). The Genetic Basis of Evolutionary Change, Evol., 29: 587–590. https://doi.org/10.1111/j.1558-5646.1975.tb00851.x[CrossRef]
- Golijow CD, Giovambattista G, Rípoli MV, Dulout FN, Lojo MM (1999). Genetic variability and population structure in loci related to milk production traits in native Argentine Creole and commercial Argentine Holstein cattle. Gen. Mole. Bio., 22: 395-398. https://doi.org/10.1590/S1415-47571999000300018[CrossRef]
- Huerta-Leidenz NO, Cross HR, Savell JW, Lunt DK, Baker JF, Smith SB (1996). Fatty acid composition of subcutaneous adipose tissue from male calves at different stages of growth. J. Anim. Sci., 74: 1256. https://doi.org/10.2527/1996.7461256x[CrossRef]
- Inoue K, Kobayashi M, Shoji N, Kato K (2011). Genetic parameters for fatty acid composition and feed efficiency traits in Japanese Black cattle. Anim. Sci., 5: 987-994. https://doi.org/10.1017/S1751731111000012[CrossRef]
- Jakaria JJ, Ulum MF, Lestari D, Akwila S, Sihite DE, Priyanto R, Sumantri C (2020). Investigating new SNPs of CAST, CAPN and SCD genes in 5’UTR of Bali cattle. Biodiver. J. Bio. Diver., 21(7). https://doi.org/10.13057/biodiv/d210713[CrossRef]
- Kelly MJ, Tume RK, Newman S, Thompson JM (2013). Genetic variation in fatty acid composition of subcutaneous fat in cattle. Anim. Prod. Sci., 53:129–133. https://doi.org/10.1071/AN12154[CrossRef]
- Kimura M, Crow JF (1964). The number of alleles that can be maintained in a finite population. Genetics., 49: 725-731. https://doi.org/10.1093/genetics/49.4.725[CrossRef]
- Lu W, Wang J, Li C, Sun M, Hu R, Wang W (2018). A novel mutation in 5’-UTR of makorin ring finger 3 gene associated with the familial precocious puberty. Acta Biochim. Biophys. Sic. 50: 1291-1293. https://doi.org/10.1093/abbs/gmy124[CrossRef]
- McGuire S (2016). Scientific report of the 2015 dietary guidelines advisory committee. Washington, DC: US Departments of Agriculture and Health and Human Services, 2015. Adv. Nutr., 7(1):202. https://doi.org/10.3945/an.115.011684[CrossRef]
- Mnati AA (2023). Using the pop-gene program to study two genetic sites of the growth hormone gene in Iraqi local sheep. Iraqi J. Vet. Sci., 37: 37- 41. https://doi.org/10.33899/ijvs.2023.1403990.3044[CrossRef]
- Murrieta CM, Hess BW, Rule DC (2003). Comparison of acidic and alkaline catalysts for preparation of fatty acid methyl esters from ovine muscle with emphasis on conjugated linoleic acid. Meat Sci., 65: 523-529. https://doi.org/10.1016/S0309-1740(02)00244-9[CrossRef]
- Nei M (1973). Analysis of gene diversity in subdivided populations. Proceedings of the Natl. Acad. Sci., 70(12), 3321-3323. https://doi.org/10.1073/pnas.70.12.3321[CrossRef]
- Nogi T, Honda T, Mukai F, Okagaki T, Oyama K (2011). Heritabilities and genetic correlations of fatty acid compositions in longissimus muscle lipid with carcass traits in Japanese Black cattle. J. Anim. Sci., 89: 615-621. https://doi.org/10.2527/jas.2009-2300[CrossRef]
- Nowak D (2011). Enzymes in tenderization of meat-the system of calpains and other systems-a review. Polish J. Food and Nutrition Sci., 61(4). 231- 237 https://doi.org/10.2478/v10222-011-0025-5[CrossRef]
- Oka A, Iwaki F, Dohgo T, Ohtagaki S, Noda M, Shiozaki T, Ozaki M (2002). Genetic effects on fatty acid composition of carcass fat of Japanese Black Wagyu steers. J. Anim. Sci., 80: 1005-1011. https://doi.org/10.2527/2002.8041005x[CrossRef]
- Paetkau D, Calvert W, Stirling I, Strobeck C (1995). Microsatellite analysis of population structure in Canadian polar bears. Mol. Ecol., 4: 347- 354. https://doi.org/10.1111/j.1365-294X.1995.tb00227.x[CrossRef]
- Peakall RO, Smouse PE (2006). GENALEX 6: genetic analysis in Excel. Population genetic software for teaching and research. Mol. Ecol. 6: 288-295. https://doi.org/10.1111/j.1471-8286.2005.01155.x[CrossRef]
- Pitchford WS, Deland MP, Siebert BD, Malau-Aduliand AE, Bottema CD (2002). Genetic variation in fatness and fatty acid composition of crossbred cattle. J. Anim. Sci., 80: 2825- 2832. https://doi.org/10.2527/2002.80112825x[CrossRef]
- Saatchi M, Garrick DJ, Tait RG, Mayes MS, Drewnoski M, Schoonmaker J, Reecy JM (2013). Genome-wide association and prediction of direct genomic breeding values for composition of fatty acids in Angus beef cattle a. BMC Genomics., 14: 1-15. https://doi.org/10.1186/1471-2164-14-730[CrossRef]
- Shafee T, Lowe R (2017). Eukaryotic and prokaryotic gene structure. W. J. Medic., 4(1):2. https://doi.org/10.15347/wjm/2017.002[CrossRef]
- SPSS (2019). IBM Statistics 26 step by step.16th Edition.
- Touma ZA, Ayied AY, Makki GA (2022). Genetic Polymorphisms of The DNMT3b Gene In Local And Imported Calves. J. Pharmac. Neg. Res., 1739-1745. https://doi.org/10.47750/pnr.2022.13.S08.210[CrossRef]
- Wood JD, Enser M, Fisher AV, Nute GR, Sheard PR, Richardson RI, Whittington FM (2008). Fat deposition, fatty acid composition and meat quality: Areview. Meat sci., 78: 343. https://doi.org/10.1016/j.meatsci.2007.07.019[CrossRef]
- Xiang T, Christensen OF, Vitezica ZG, Legarra A (2018). Genomic Model with Correlation Between Additive and Dominance Effects. Genetics., 209: 711–723. https://doi.org/10.1534/genetics.118.301015[CrossRef]
- Xie YR, Busboom JR, Gaskins CT, Johnson KA, Reeves JJ, Wright RW, Cronrath JD (1996). Effects of breed and sire on carcass characteristics and fatty acid profiles of crossbred Wagyu and Angus steers. Meat Sci., 43: 167-177. https://doi.org/10.1016/0309-1740(96)84588-8[CrossRef]
- Xu S (2022). Quant. Genet., 1-406. https://doi.org/10.1109/CAC57257.2022.10056023[CrossRef]
- Yousief MY, Al-Galbi H A, Al-Bataat HA (2024). The relationship of DGAT1 polymorphisms and milk fatty acids production of cows bred in Iraq (Local, cross and Holstein-Friesen). Iraqi J. Vet. Sci., 38: 7- 14. https://doi.org/10.33899/ijvs.2023.139337.2929[CrossRef]
- Yousief MY, Owaid JM, Mohsin RH (2023). Relationship Between Growth Hormone Gene Polymorphism with Milk Production and Its Components in Black Iraqi Goat. Basrah J. Agri. Sci., 36: 285-299. https://doi.org/10.37077/25200860.2023.36.2.22[CrossRef]
- Zhang S, Knight TJ, Reecy JM, Beitz DC (2008). DNA polymorphism in bovine fatty acid synthase are associated with beef fatty acid composition. Anim. Gen., 39: 62–70. https://doi.org/10.1111/j.1365-2052.2007.01681.x[CrossRef]
Services
Article usage statistics
Loading…