Research Article · Volume 14, Issue 11, 17 October 2026 · Open Access
Linking Housing Systems to Reproductive-Metabolic Regulation and Egg Production in Sentul Chicken
· · ·
Affiliations & Notes ⌄
1Faculty of Animal Science, Padjadjaran University, Jalan Ir. Soekarno Km. 21 Jatinangor, Sumedang 45363, West Java, Indonesia. *Correspondence | Wiwin Tanwiriah, Animal Production Department, Faculty of Animal Science, Padjadjaran University, Jalan Ir. Soekarno Km. 21 Jatinangor, Sumedang 45363, West Java, Indonesia
The slat-plus-litter system was associated with higher values for certain lipid indicators and egg yolk precursors than the slat-only system; however, FSH, LH, and ApoB levels did not differ significantly in the initial analysis.
The higher FCR observed in the slat-plus-litter system does not support recommending it as the most efficient system.
Selected from the article's own text.
Abstract
This study evaluated the relationship between housing floor systems and production performance, egg quality, and reproductive and metabolic biomarkers in Sentul chickens. We randomly assigned 150 12-week-old hens to three rearing systems litter, slat + litter, and slat with five replicate pens per system and 10 birds per pen. The pen served as the experimental unit for production measurements. Parameters included production performance, egg physical characteristics and composition, reproductive hormones, plasma lipid profiles, yolk precursors, and the expression of apoptosis-related transcripts in blood cells. We analysed data using one-way ANOVA and Tukey’s test, along with Pearson correlation and exploratory path modelling. Results showed that egg weight was higher in the litter and slat + litter systems than in the slat system, whereas the feed conversion ratio was highest in the slat + litter system (5.97), followed by the slat (5.21) and litter (5.08) systems. Egg quality differences were primarily observed in albumen characteristics, shell weight, crude protein, and total lipids. The slat + litter system showed higher concentrations of vitellogenin and ApoVLDL-II than the slat system, while FSH, LH, and ApoB levels did not differ significantly among treatments. BAX and caspase-3 expression in blood cells was higher in the slat system, though this could not be interpreted as direct evidence of ovarian apoptosis. Correlation analysis revealed a positive association between yolk precursors and production, and a negative association between apoptosis-related transcripts and production. We used path modelling to formulate hypotheses about relationships between parameters, without establishing mediation or causality. Overall, housing systems were associated with variations in biomarker profiles and certain egg characteristics; the higher yolk precursor profile observed in the slat + litter system was accompanied by lower feed efficiency.
Housing systems provide a physical environment that influences laying hens’ activity, substrate contact, and performance. These relationships depend on factors such as strain, age, environmental conditions, and management practices. Reviews by Pires et al. (2021) and studies by Sharma et al. (2022), Erek and Matur (2024), and Shoji et al. (2025) indicate that the advantages of a particular system vary across production, feed efficiency, egg quality, and physiological responses.
Previous research has evaluated egg quality, behaviour, welfare, and physiology across various laying hen housing systems ; ; . While these studies provide a basis for phenotypic comparison, they do not imply that the relationship between flooring types and the full range of biomarkers measured in Sentul chickens has remained uninvestigated. This study evaluates production parameters and blood biomarkers across three housing systems within a single population of Sentul chickens.
The Sentul chicken represents an Indonesian local chicken genetic resource. Mushawwir et al. (2025a) provide context on production and physiological variation in Sentul chickens under different agroclimatic conditions. Because agroclimatic differences are not equivalent to housing floor treatments, that research contextualises environmental sensitivity rather than demonstrating mechanisms specific to flooring types.
FSH and LH are associated with reproductive function, whereas VTG and ApoVLDL-II indicate yolk precursors. Cui et al. (2020) described the link between sexual maturation and the liver blood ovary axis in chickens. The reported target identity of KISS1R requires verification, as evolutionary variation in the kisspeptin system and its receptors limits the applicability of mammalian interpretations to birds . This target is treated as an exploratory signal rather than validated evidence of reproductive pathway activation in chickens.
BAX and caspase-3 expression levels were measured in peripheral blood cells; thus, they cannot serve as direct measures of ovarian apoptosis or follicular integrity. While simultaneous measurement of lipid indicators and yolk precursors can illustrate patterns of systemic association, confirming the underlying mechanisms requires tissue-level measurements and appropriate time-series data.
This study aimed to compare production performance, egg quality, and biomarkers including reproductive hormones, lipids, blood gene expression, and yolk precursors across litter, slat-plus-litter, and slat housing systems. We used correlation analyses and path modelling to explore relationships among these parameters. The study was not designed to demonstrate mediation, assess follicular integrity, or determine the optimal housing system based solely on biomarkers.
MATERIALS AND METHODS
Animals and experimental design
The study utilised 150 female Sentul chickens aged 12 weeks, randomly allocated to three flooring treatments litter, slat, and slat + litter with five replicate pens of 10 birds each per treatment. Each pen served as an experimental unit and measured 1.5 m long by 1 m wide. The basal diet contained 17% crude protein, 4% crude fat, 6% crude fibre, 13.5% ash, 3.2% calcium, 0.9% phosphorus, and 2,850 kcal/kg of metabolizable energy. Ingredients included corn meal, rice bran, fish meal, soybean meal, coconut meal, coconut oil, and shell meal. We provided feed and water ad libitum; we offered feed in the morning and afternoon. We administered no vaccinations or medical treatments during the study.
We defined sexual maturity as the age at the first egg laid; we recorded body weight and the weight of the first egg at that time. We recorded daily egg counts at the pen level, along with egg weight, total egg mass, feed offered, and feed residue. We calculated Feed Conversion Ratio (FCR) as feed consumption divided by egg mass for the same observation period. We provided nest boxes measuring 35 × 25 cm and collected eggs every morning. We evaluated fresh, intact eggs from each experimental unit on the day of collection. We measured specific gravity, shape index, Haugh unit, albumen weight and index, shell weight and thickness, and yolk weight using standard egg quality procedures, including calculating Haugh units . We analysed crude protein and total lipid content in whole eggs according to AOAC International (2019) standards, and we analysed egg cholesterol using an enzymatic-colourimetric method.
Blood sampling and sample analysis
We collected blood samples from the brachial vein using a sterile 3 mL syringe and a 23 G needle. We transferred approximately 3 mL of blood into a sterile EDTA tube and mixed it by gentle inversion. We kept samples cool during transport and processed them immediately. Plasma was separated by centrifugation at 3,000 × g for 15 minutes at 4 °C, then transferred to labelled microtubes without disturbing the cell layer and stored at −80 °C. We used the blood cell/buffy coat fraction for RNA isolation.
We analysed plasma FSH, LH, VTG, ApoVLDL-II, and ApoB using a chicken-specific ELISA according to the Biosource (USA) kit protocol. We loaded standards and samples in duplicate into antibody-coated wells, then incubated, washed, and added enzyme conjugate, substrate, and stop solution. We measured absorbance at 450 nm and calculated concentrations from a standard curve. APO responses were expressed in arbitrary units (AU) relative to the calibrator. We analysed total cholesterol, TAG, HDL, LDL, and NEFA using enzymatic-colourimetric kits at manufacturer-specified wavelengths, following Randox (UK) kit procedures.
Relative expression of BAX, caspase-3, and the target identified as KISS1R was analysed in the blood cell/buffy coat fraction using reverse transcription quantitative polymerase chain reaction (RT-qPCR). We isolated total RNA using a silica-column-based RNA extraction kit. To minimise genomic DNA contamination, we performed DNase treatment if specified in the extraction procedure. We assessed RNA concentration and purity using a microvolume spectrophotometer (Scitek, SP-MUV1000I type), based on absorbance at 260 nm and the A260/A280 and A260/A230 ratios. We checked RNA integrity by electrophoresis or, where applicable, with an RNA analysis instrument. RNA was stored at −80°C until used for cDNA synthesis.
We performed cDNA synthesis using a reverse transcription kit (Thermo Scientific, Catalogue Number K1612), with an equal amount of RNA for all samples (500 ng per reaction). Reactions used random hexamer and/or oligo(dT) primers, according to the kit composition, with incubation temperatures and times following the manufacturer’s instructions. We uniformly diluted the resulting cDNA before using it as an RT-qPCR template.
We performed amplification using SYBR Green master mix on a real-time PCR instrument (QuantStudio 7 Pro, from Thermo Fisher Scientific). As an example of initial conditions requiring optimisation, the reaction volume may be set at 20 µL, comprising 10 µL of 2× master mix, forward and reverse primers at a final concentration of 0.3 µM each, 2 µL of cDNA, and nuclease-free water to reach the final volume. The amplification program followed the master mix specifications; for example, a two-step program involved initial activation according to the manufacturer’s instructions, followed by 40 cycles of denaturation at 95°C for 15 seconds and annealing/extension at 60°C for 60 seconds. We determined the annealing temperature by optimising each primer pair. We analysed each sample in duplicate (technical replicates), without increasing biological replicates.
We assessed amplification specificity via melt curve analysis after amplification. A single melting peak served as an initial indicator of specificity but was not considered sole evidence of target identity. We used a no-template control to detect reagent contamination or primer-dimer formation and, where applicable, a no-reverse transcriptase control to evaluate genomic DNA contamination. Forward and reverse primer sequences, target sequence accession numbers, amplicon sizes, and annealing temperatures must be reported based on the primers actually used. We evaluated the amplification efficiency of each primer pair using a standard curve derived from a cDNA dilution series, where applicable. Efficiency was calculated based on the slope of the curve plotting Ct values against the logarithm of template concentration, using the equation E = (10^(−1/slope) − 1) × 100%. We report efficiency values, coefficients of determination, and dilution ranges based on the test results rather than expected values.
β-actin was used as the reference gene. We evaluated its stability across treatments before normalisation; we acknowledge this lack of validation as a limitation. We calculated relative expression using the 2^−ΔΔCt method , where ΔCt is the difference between the target Ct and the β-actin Ct, and ΔΔCt is the difference between the sample ΔCt and the mean ΔCt of the litter group (the calibrator). This method requires adequate and comparable amplification efficiencies for both the target and reference genes. Results are expressed as fold change relative to the litter group and represent peripheral blood cell transcripts, rather than ovarian tissue expression or caspase-3 protein activity.
Statistical analysis
The experiment comprised three housing treatments with five replicate pens per treatment. We analysed pen-level production responses, using each pen as the experimental unit. Each response variable was analysed independently by one-way ANOVA in a completely randomised design. When the treatment effect was significant, we compared means using Tukey’s honestly significant difference test (α = 0.05). Data are presented as mean±standard deviation (SD). Distributional and residual patterns were examined to assess model suitability, and P<0.05 was considered statistically significant.
Pearson correlation coefficients were calculated for reproductive, metabolic, apoptosis, yolk-synthesis, and production variables in the biomarker dataset. The correlation matrix was visualised as a heatmap to show the direction and strength of pairwise relationships. Correlation magnitude was interpreted conservatively because clustered treatment differences and the limited sample size can inflate apparent associations .
A composite-based exploratory pathway model was constructed to organise the hypothesised biological sequence from housing system to reproductive signalling, metabolic regulation, apoptosis/follicular integrity, yolk synthesis, and egg-production performance. KISS1R, FSH, and LH formed the reproductive-signalling construct; HDL, LDL, cholesterol, TAG, NEFA, and APO formed the metabolic regulation construct; BAX and caspase-3 formed the apoptosis construct; VTG, ApoVLDL-II, and ApoB formed the yolk synthesis construct; and egg weight, egg production, and reverse-coded FCR represented production performance. Standardised path coefficients (β) indicated direction and magnitude, and R² indicated variance explained in endogenous constructs. We treated the analysis as exploratory composite/path modelling following PLS-SEM principles . Interpretation therefore emphasised biological consistency, coefficient direction, and explanatory patterns rather than confirmatory model fit or population-level causal inference.
RESULTS AND DISCUSSION
Housing systems altered sexual maturity and productive performance.
Table 1 contains figures that cannot be interpreted without verification. The age at sexual maturity (1,162.28–1,168.00 days) and production rate (2,230.26–3,606.84 eggs/bird/week) suggest errors in the figures or units; egg mass values are also inconsistent across treatments. We did not establish substitute figures in the absence of original records. Consequently, we did not use the rankings for age at sexual maturity, egg count, and egg mass as a basis for conclusions. Egg weights for the litter and slat + litter systems were nearly identical (44.03 and 43.97 g) and shared the same comparison letter in the initial analysis.
Small numerical differences in body weight or egg weight cannot be directly equated to biological benefits. Groups sharing the same Tukey letter were not considered significantly different. After correcting age and production figures, we assessed biological relevance based on the magnitude of the difference, confidence intervals (CI), production duration, and feed costs. The energy trade-off between growth and reproduction remains a hypothesis, as we did not measure individual energy consumption or activity levels.
Abo Ghanima et al. (2020) and Sharma et al. (2022) reported variations in laying hen performance across different rearing environments. While these findings support evaluations that consider strain and management conditions, they do not prove that flooring type accounts for all the variation observed in the present study. Undocumented differences in lighting, stocking density, or microclimate may also contribute to the observed responses.
Mushawwir et al. (2025a) provide relevant context regarding environmental responses in Sentul chickens. However, this study did not use agroclimatic comparisons to substantiate the effects of flooring type or as a substitute for measuring the housing environment itself.
The FCR for the slat-plus-litter system (5.97) was higher than that for the litter system (5.08) and the slat system (5.21). By definition, a higher FCR indicates greater feed consumption per unit of egg mass. Higher yolk precursor levels did not offset this efficiency disadvantage. Because neither activity nor energy expenditure was measured, the underlying causes of these FCR differences including the potential influence of activity levels could not be determined ; .
Egg quality and nutrient composition reflect selective housing responses
Preliminary analysis indicates variations in albumen weight, albumen index, shell weight, crude protein, and total lipids; however, specific gravity, shape index, Haugh unit, shell thickness, yolk weight, and cholesterol levels did not differ significantly (Table 2). Non-significant results do not demonstrate biological equivalence. Recheck the Table 2 completeness against the submission PDF, and update inferences after verifying the unit of analysis and multiple testing.
The variation in egg quality responses across parameters aligns with findings reported by Pires et al. (2021), Racevičiūtė-Stupelienė et al. (2023), and Sharma et al. (2022). Because egg components form through distinct processes, changes in albumen weight do not necessarily reflect changes in Haugh units or shell thickness. However, as this study did not measure oviduct protein synthesis, egg transit time, or nutrient allocation, these processes cannot be confirmed as the underlying causes of the observed results.
The reduced albumen weight observed with the slatted flooring coincided with lower egg weight. This relationship represents a phenotypic observation rather than evidence of altered oviduct metabolism. Findings from dietary intervention studies in sheep, broilers, or ducks were not used to establish the physiological mechanisms at play in Sentul chickens within this housing comparison.
Table 1: Sexual maturity and productive performance of Sentul hens under different housing systems.
Parameter
Litter
Slat + Litter
Slat
P value
Age at sexual maturity (days)
1162.28 ± 0.873b
1164.00 ± 2.01b
1168.00 ± 2.05a
<0.0001
Body weight at sexual maturity (g)
1164.00 ± 4.16b
1161.00 ± 4.09b
1171.99 ± 4.37a
0.0004
First egg weight (g)
43.00 ± 4.14a
41.00 ± 4.09a
39.00 ± 4.14a
0.5867
Egg weight (g)
44.03 ± 0.895a
43.97 ± 0.89a
41.680 ± 0.85b
0.0001
Egg production (eggs/bird/week)
3606.84 ± 0.37a
2230.26 ± 0.23c
2690.21 ± 0.27b
<0.0001
Total egg weight (g)
4112.53 ± 0.13a
353.34 ± 7.38b
4035.780 ± 5.39a
0.0002
Feed conversion ratio
5.08 ± 0.29b
5.97 ± 0.334a
5.210 ± 0.292b
0.0001
Values are presented as mean ± SD. Within a row, different superscript letters indicate nominal Tukey comparisons (P < 0.05).
Table 2: Egg quality and nutrient traits of Sentul hens under different housing systems.
Parameter
Litter
Slat + Litter
Slat
P value
Specific gravity
1.09 ± 0.02a
1.087 ± 0.02a
1.09 ± 0.01a
0.1094
Form index (%)
79.69 ± 0.92a
78.42 ± 1.44a
78.82 ± 1.44a
0.1954
Haugh unit
86.53 ± 2.19a
87.47 ± 2.22a
86.37 ± 2.19a
0.6094
Albumen weight (g)
24.57 ± 0.88a
25.44 ± 0.90a
23.34 ± 0.83b
0.0010
Albumen index
0.08 ± 0.02ab
0.09 ± 0.01a
0.08 ± 0.01b
0.0380
Shell weight (g)
5.36 ± 0.13ab
5.43 ± 0.14a
5.20 ± 0.13b
0.0148
Shell thickness (mm)
0.42 ± 0.08a
0.42 ± 0.01a
0.42 ± 0.01a
0.7040
Egg yolk weight (g)
13.11 ± 0.40a
13.10 ± 0.40a
13.15 ± 0.40a
0.9697
Egg crude protein (%)
12.35 ± 0.27ab
12.46 ± 0.17a
12.02 ± 0.37b
0.0228
Egg total lipid (%)
10.50 ± 0.40ab
10.85 ± 0.41a
10.20 ± 0.26b
0.0129
Egg cholesterol (mg/dg)
376.13 ± 18.38a
382.89 ± 20.63a
364.08 ± 22.72a
0.2517
Values are presented as mean ± SD. Within a row, different superscript letters indicate nominal Tukey comparisons (P < 0.05).
Table 3: Reproductive–metabolic, apoptosis, and yolk-related biomarkers of Sentul hens.
Parameter
Litter
Slat + Litter
Slat
P value
KISS1R (fold change)
0.98 ± 0.12ab
1.11 ± 0.09a
0.901 ± 0.12b
0.0085
FSH (ng/mL)
3.04 ± 0.27a
3.05 ± 0.40a
2.67 ± 0.37a
0.1033
LH (ng/mL)
2.44 ± 0.31a
2.48 ± 0.24a
2.16 ± 0.27a
0.0868
HDL (mg/mL)
90.65 ± 5.74ab
97.40 ± 7.64a
81.84 ± 6.60b
0.0015
LDL (mg/mL)
38.35 ± 2.82a
40.14 ± 3.90a
32.52 ± 4.27b
0.0032
Cholesterol (mg/mL)
163.74 ± 9.12ab
168.16 ± 12.31a
152.54 ± 7.23b
0.0221
TAG (mg/mL)
115.47 ± 15.46ab
130.06 ± 8.48a
108.76 ± 9.52b
0.0089
NEFA (mmol/L)
0.32 ± 0.03ab
0.37 ± 0.06a
0.30 ± 0.03b
0.0214
APO (AU)
1.01 ± 0.09a
1.08 ± 0.08a
0.89 ± 0.07b
0.0009
BAX (fold change)
0.99 ± 0.11b
0.91 ± 0.10b
1.29 ± 0.07a
<0.0001
caspase-3 (fold change)
0.96 ± 0.08b
0.91 ± 0.08b
1.17 ± 0.10a
0.0001
Vitellogenin (VTG) (mg/mL)
6.21 ± 0.39a
6.79 ± 0.41a
5.51 ± 0.54b
0.0002
ApoVLDL-II (AU)
0.98 ± 0.11ab
1.10 ± 0.14a
0.86 ± 0.10b
0.0058
ApoB (mg/dL)
72.52 ± 4.44a
76.79 ± 9.54a
68.10 ± 6.08a
0.0955
Values are presented as mean ± SD. Within a row, different superscript letters indicate nominal Tukey comparisons (P < 0.05).
The lack of significant differences in shell thickness during the initial analysis does not prove that environmental stress levels were identical or that uterine calcification remained undisturbed. Such conclusions would require environmental data, mineral status information, and measures of uncertainty. Consequently, we discuss the egg quality results as observed differences rather than as a basis for claims about welfare or the superiority of a specific housing system.
Reproductive and lipid biomarkers differed selectively among housing systems
In Table 3, FSH (P= 0.1033), LH (P= 0.0868), and ApoB (P = 0.0955) did not differ significantly in the initial analysis. The slat + litter group showed higher values for VTG, ApoVLDL-II, and several lipid indicators than the slat group; however, comparisons with the litter group were not consistently significant. Consequently, the term “highest reproductive activity” was not employed. The observed biomarker differences did not provide evidence of alterations in steroidogenesis or ovarian function. While Cui et al. (2020) provide biological context on egg yolk precursors, their findings do not replace the tissue measurements obtained in the present study.
The signal identified as KISS1R is an exploratory result pending verification of target identity, primer sequences, and amplicon specificity. Interspecies variations in the kisspeptin system limit the applicability of mammalian pathway interpretations to avian species . FSH and LH are nonetheless discussed as measured biomarkers, with the caveat that differences between housing systems were not significant.
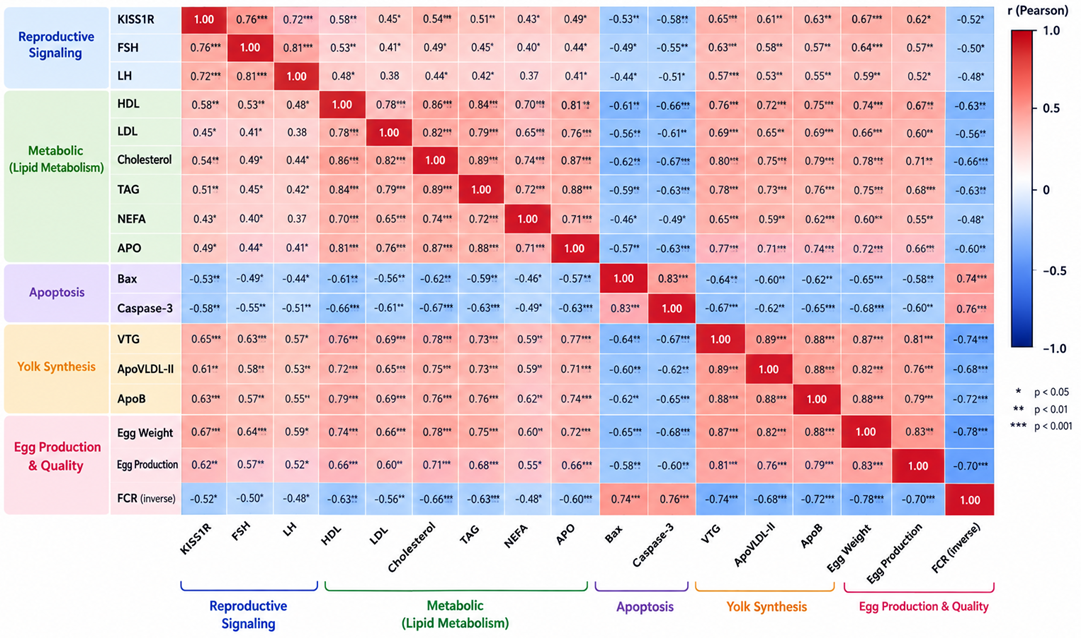
Figure 1 shows correlations between egg production and cholesterol (r= 0.71), TAG (r= 0.68), HDL (r= 0.67), and NEFA (r= 0.55). These values are transcribed from the original Figure 1 rather than derived from a re-analysis. While the pattern illustrates an association, it does not prove that increased lipid levels cause increased egg production. Statistical confirmation would require verification of paired data, production levels, confidence intervals (CI), and FDR correction.
The relationship between lipids and yolk precursors can be biologically contextualised within substrate transport during egg formation . However, this study did not directly measure lipid flux, hepatic metabolism, or transport to the follicles. Plasma concentrations alone cannot support conclusions about enhanced metabolic flexibility in the slat-plus-litter system.
Contact with litter may be a relevant variable for future research, yet this study measured neither the microbiome nor gut integrity; consequently, it did not establish either as a mediator. Future analyses should integrate measurements of environmental conditions, behaviour, and health status with validated biomarkers.
In the initial analysis, BAX and caspase-3 expression in blood cells were higher in the slat group, whereas VTG and ApoVLDL-II levels were lower than in the slat + litter group. Figure 1 shows correlations between egg production and BAX (r = −0.58) and caspase-3 (r = −0.60). Differences in sample compartments limit interpretation: blood transcript expression does not indicate the site of apoptosis, caspase enzyme activity, or ovarian follicle damage.
VTG and ApoVLDL-II are precursors or transport components of egg yolk, but their plasma concentrations do not equate to hepatic synthesis rates or deposition in oocytes. ApoB levels did not differ significantly between groups. Thus, these results indicate variations in circulating indicators rather than evidence of heightened activation across the liver–blood–ovary axis in the slat + litter group .
The negative correlation between blood transcripts and yolk precursors may reflect co-variation from treatments or other factors; this pattern does not prove opposing biological mechanisms. Follicle integrity was not measured; testing ovarian hypotheses requires histology, follicle counts, and appropriate tissue-based apoptosis markers.
Future research could assess BAX/Bcl-2 ratios, histology, follicle counts, and the longitudinal persistence of production. Because these parameters were not available in the current study, we did not use them to evaluate follicle health or predict long-term production stability. Welfare assessment also requires directly measured behavioural and health indicators.
The correlation structure describes exploratory associations among measured traits
Figure 1 illustrates a positive association between egg production and VTG (r = 0.81), ApoVLDL-II (r = 0.76), and ApoB (r = 0.79), as well as a negative association with BAX and caspase-3. The FSH–LH correlation (r = 0.81) does not imply that the two hormones differed significantly between treatments. Correlation values describe covariation, whereas ANOVA compares group means; the two address different questions. All values in the Figure 1 require verification against the raw data. Interpreting the matrix requires distinguishing correlations among individuals from correlations driven by differences in group means. For instance, two biomarkers might show the same direction of change within a specific housing system without a strong association within individual groups. A pooled correlation alone cannot distinguish between these scenarios. Analyses that account for group and housing unit are necessary, while acknowledging limitations regarding the number of housing units and sampled hens.
Furthermore, duplicate measurements represent technical assay replicates rather than additional individuals or experimental units; duplicates do not increase the biological sample size from 21 to 42. Associations between biomarkers and production also require a clearly defined observation period: blood values at a single time point cannot simply be assumed to represent the entire production cycle. Hen ID, housing unit ID, and sampling date must be available to trace these associations. Given these limitations, the matrix identifies relationships worthy of further testing, rather than ranking the superiority of housing systems or definitively establishing reproductive mechanisms.
Among the off-diagonal values in the Figure 1, the correlations for cholesterol–TAG and VTG–ApoVLDL-II are both r = 0.89, whereas LH–NEFA is r = 0.37. This comparison illustrates the range of associations within the initial matrix; however, the stability of these coefficients remains unknown because the analysis lacks confidence intervals or re-evaluations that account for the cage effect.
Associations between yolk precursors and production are suitable for formulating research questions, but they may reflect differences between cage groups. If cage-level production data is assigned to individual hens, the resulting correlations involve pseudoreplication. Before assessing individual-level relationships, analyses must be conducted at the appropriate level and control for treatment effects.
In Figure 1, the inverse FCR trait is negatively correlated with egg production (r= −0.70) and VTG (r= −0.74), and positively correlated with BAX (r= 0.74). This directionality contradicts the initial premise of a positive relationship between efficiency and productive traits. The definition and transformation of FCR require scrutiny, these data have not yet provided evidence of feed-efficiency coordination.
Key limitations include small sub-panels, the hierarchical structure of hens within cages, uncertainty about the link between production and biomarkers, and testing multiple pairs. Factors such as KISS1R identity, assay and reference-gene validation, undocumented lighting and stocking-density conditions, and the absence of ovarian histology and microbiome data constrain further interpretation. The lack of reported information does not imply that a procedure was not performed; however, researchers must clarify these details from research records before resubmission.
The exploratory path model supports a reproductive–metabolic route from housing to egg production
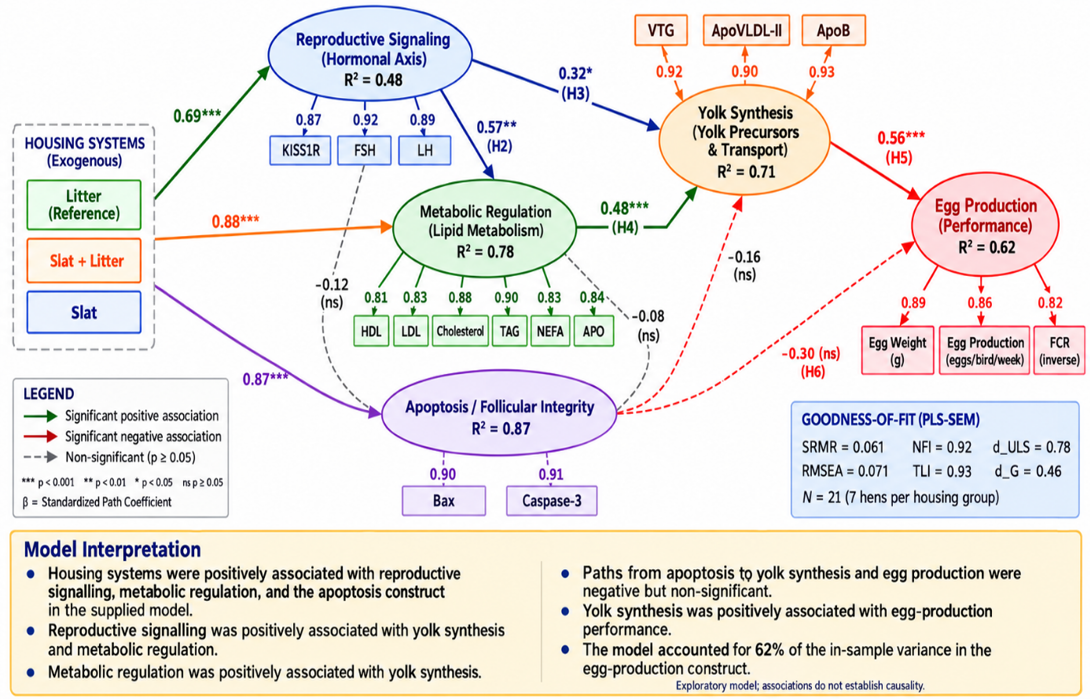
Figure 2 presents an initial model with R² values of 0.48 for the reproduction construct, 0.78 for metabolism, 0.87 for apoptosis-related transcripts, 0.71 for yolk precursors, and 0.62 for production. These figures reflect fit within the initial sample only and do not demonstrate predictive capability beyond that sample. Given the small sample size (n= 21), the inclusion of housing categories, and correlated indicators, overfitting and a lack of observational independence are major concerns. The model does not prove that housing affects production through specific mediators.
Consistency between coefficient directions and biological theory does not constitute validation of mediation. Temporal sequencing was not tested, and estimates of indirect effects along with their confidence intervals are not provided in the document. Before recalculating the model, verify the identity of KISS1R, the coding of housing categories, and the data level of the production data. The fit indices shown in the Figure 2 should not be used to accept the model or recommend a specific husbandry system. Constructing composite scores also requires clear justification. Lipid concentrations, hormone levels, and transcript expression levels differ in units and biological significance; combining them does not automatically yield a validated measure of physiological function. The standardisation and weighting of indicators as well as the handling of highly correlated indicators must be documented. High loading values in the Figure 2 do not substitute for an assessment of target validity or the independence of observations.
In production analysis, combining egg count, egg weight, and FCR requires consideration of the mathematical relationships between parameters and the directionality of the efficiency score. For the three housing categories, estimating a single combined coefficient necessitates transparent coding definitions; without this, a positive direction cannot be interpreted as a ranking of superiority among the litter, slat-plus-litter, and slat systems. Further model evaluation should start with data structure and variable definitions rather than trying to maintain specific fit indices. If the necessary data are unavailable, treat the model as a hypothetical illustration, and reconsider claims about the significance of its pathways. This stance does not negate the value of biomarker measurements but limits conclusions to what the available evidence supports.
Interpret R² separately from causal certainty and practical utility. High values may arise because indicators share between-group variance or because production scores incorporate interrelated information. Without independent test data, it remains unknown whether the observed pattern holds for other Sentul chicken populations. Re-modelling efforts should also report truly independent observations, how missing data are handled, and the rationale for indicator selection. Coefficient uncertainty must be explicitly stated rather than replaced by biological narratives. Consequently, the hypothesis regarding yolk precursor transport can still be discussed. At the same time, claims that the model explains the pathways of housing influence should be deferred until the necessary evidence becomes available.
The coefficient of β = 0.56 for the relationship between yolk precursors and production in the initial Figure 2 is consistent with an association but does not represent a validated mechanistic estimate. Existing literature on the liver–blood–ovary axis provides a rationale .
The Pathways linking apoptosis-related transcripts to yolk precursors (β = −0.16) and production (β = −0.30) were not statistically significant in the initial Figure 2; therefore, we cannot claim a proven inhibitory effect or predictive role. The negative directionality remains merely a hypothesis requiring tissue-level measurements and longitudinal data.
Erek and Matur (2024) and Shoji et al. (2025) emphasise that housing system evaluation involves multiple outcomes; however, this study did not measure welfare or activity levels. Blood biomarkers cannot directly substitute for assessments of behaviour, foot condition, plumage, or other health indicators.
Producer decisions should be based on daily records summarised weekly by housing unit of egg production, egg mass, and feed intake, alongside mortality rates and feed costs per unit of egg mass . Health and welfare indicators require direct monitoring. This study has not yet established validated composite weightings or biomarker thresholds for selecting a housing system. Recommendations must await production verification and economic analysis; the higher Feed Conversion Ratio (FCR) associated with the slat-plus-litter system represents a practical limitation, not a negligible factor.
CONCLUSION
The slat-plus-litter system was associated with higher values for certain lipid indicators and egg yolk precursors than the slat-only system; however, FSH, LH, and ApoB levels did not differ significantly in the initial analysis. The higher FCR observed in the slat-plus-litter system does not support recommending it as the most efficient system. Blood expression levels of BAX and caspase-3 did not indicate ovarian follicular impairment. Problematic production figures and the grouping of hens within the housing units require verification and re-analysis. The correlation and path models are exploratory in nature and do not demonstrate mediation. Selecting a housing system requires consistent evidence regarding production, feed costs, health, and welfare, as well as longitudinal validation.
ACKNOWLEDGEMENT
We express appreciation and gratitude to the Rector of Padjadjaran University, who provided a research grant (Academic Leadership Grant/ALG) to the authors through Padjadjaran University’s internal research funding in 2025. We also thank the laboratory and research assistants who helped during the field investigation.
NOVELTY Statement
This research contributes a joint presentation of cage production data and blood biomarker subpanels in Sentul chickens in three-floor systems. The combination of lipid indicators, egg yolk precursors and blood cell transcripts provides material to formulate a hypothesis of physiological relationships in local chickens. Novelty is limited to the context of the population and the combination of measurements, not to claims of discovery of a mechanism, proof of follicle integrity, or validation of a mediation model.
AUTHOR’S CONTRIBUTION
WT, ES, DG and TW contributed to the research and writing of this article, including conceptualisation, methodology, investigation, formal analysis, data validation, drafting, editing, and supervision.
Ethical approval
All procedures for the preparation and implementation of this research have been evaluated and assessed by the Animal Ethics Committee of the Directorate of Research License Management. The Animal Ethics Committee of the Directorate of Research License Management has declared that this research can be carried out without violating animal research ethics, as shown by certificate No. 5346/KEP.09/SK/011/2025.
Generate AI and AI-assisted technology statement
The authors did not use AI applications or similar technology in preparing the article.
Conflict of interest
The authors have declared no conflict of interest regarding data or any other aspects related to this publication.
Exploratory path analysis/PLS-SEM-style model linking housing systems with reproductive signalling, metabolic regulation, apoptosis/follicular integrity, yolk synthesis, and egg-production performance. Solid arrows indicate significant paths, and dashed arrows indicate nonsignificant paths in the supplied model.
References
Abo Ghanima MM, Alagawany M, Abd El-Hack ME, Taha A, Elnesr SS, Ajarem J, Allam AA, Mahmoud AM (2020). Consequences of various housing systems and dietary supplementation of thymol, carvacrol, and eugenol on performance, egg quality, blood chemistry, and antioxidant parameters. Poult. Sci., 99(9): 4384–4397. https://doi.org/10.1016/j.psj.2020.05.028[CrossRef]
Adriani L, Abun, Mushawwir A (2015). Effect of dietary supplementation of Jengkol (Pithecellobium jiringa) skin extract on broiler chicken’s blood biochemistry and gut flora. Int. J. Poult. Sci., 14: 407- 410. https://doi.org/10.3923/ijps.2015.407.410[CrossRef]
Adriani L, Latipudin D, Mayasari N, Mushawwir A, Kumalasari C, Nabilla TI (2024). Consortium probiotic fermented milk using Bifidobacterium sp. and Lactobacillus acidophilus protects against Salmonella typhimurium and repairs the intestine. Asian J. Dairy Food Res., 43: 216-218. https://doi.org/10.18805/ajdfr.DRF-326[CrossRef]
Alig BN, Malheiros RD, Anderson KE (2023). Evaluation of physical egg quality parameters of commercial brown laying hens housed in five production systems. Animals, 13(4): 716. https://doi.org/10.3390/ani13040716.[CrossRef]
AOAC International (2019). Official methods of analysis of AOAC international, 21st ed. AOAC International, Rockville, MD, USA.
Aritonang HN, Adriani L, Mushawwir A (2025). Effect of moringa leaves (Moringa oleifera) oil microcapsules (MOM) on growth and plasma metabolites related to inflammation in sentul chickens. Adv. Anim. Vet. Sci., 13: 835–842. https://doi.org/10.17582/journal.aavs/2025/13.4.835.842[Full text][CrossRef]
Aritonang HN, Mushawwir A, Adriani L, Puspitasari T (2024). Lipid regulation by early administration of irradiated chitosan and glutathione in heat-stressed broilers. IOP Conf. Ser. Earth Environ. Sci., 1292: 012011. https://doi.org/10.1088/1755-1315/1292/1/012011[CrossRef]
Aritonang HN, Mushawwir A, Susanti IS, Dityana AM (2026). Effects of a multi-component feed additive on performance and physiology of heat-stressed laying ducks reared without water play. Adv. Anim. Vet. Sci., 14(3): 480–488. https://doi.org/10.17582/journal.aavs/2026/14.3.480.488[Full text][CrossRef]
Cui Z, Amevor FK, Feng Q, Kang X, Song W, Zhu Q, Wang Y, Li D, Zhao X (2020). Sexual maturity promotes yolk precursor synthesis and follicle development in hens via the liver-blood-ovary signal axis. Animals, 10(12): 2348. https://doi.org/10.3390/ani10122348[CrossRef]
Dorkewitz K, Keppler C, Gieseke D, Horbach S, Knierim U (2026). Opportunities and challenges of modern mobile housing systems for providing hen welfare: An observational study. Poult. Sci., 105(8): 106992. https://doi.org/10.1016/j.psj.2026.106992[CrossRef]
Dudi D, Hilmia N, Khaerunnisa I, Mushawwir A (2023). DGAT1 gene polymorphism and its association with fat deposition and carcass quality in Pasundan cattle of Indonesia. Biodiversity, 24: 4202-4208. https://doi.org/10.13057/biodiv/d240765[CrossRef]
Erek M, Matur E (2024). Effects of housing systems on production performance, egg quality, tonic immobility and feather score in laying hens. Vet. Med. Sci., 10(6): e70112. https://doi.org/10.1002/vms3.70112[CrossRef]
Firmansyah A, Adriani L, Mushawwir A, Mayasari N, Rusmana D, Ishmayana S (2024). Effect of feed supplementation with liquid and powdered probiotic yogurt on the lipid profile of chicken egg yolk. Adv. Animat. Vet. Sci., 12(7): 1371-1377. https://doi.org/10.17582/journal.aavs/2024/12.7.1371.1377[Full text][CrossRef]
Hair JF, Hult GTM, Ringle CM, Sarstedt M (2022). A primer on partial least squares structural equation modelling (PLS-SEM), 3rd ed. Sage, Thousand Oaks, CA, USA. https://doi.org/10.1007/978-3-030-80519-7[CrossRef]
Haugh RR (1937). The Haugh unit for measuring egg quality. U.S. Egg Poult. Mag., 43: 552–555, 572–573.
Jeon H, Shin H, Lee J, Kim J, Biswas S, Lee J, Yun J (2025). Welfare characteristics of laying hens in aviary and cage systems. Poult. Sci., 104(5): 104987. https://doi.org/10.1016/j.psj.2025.104987[CrossRef]
Kamil KA, Mushawwir A, Latipudin D, Rahmat D, Lobo R (2020). The effects of ginger volatile oil (GVO) on the metabolic profile of glycolytic pathway, free radical and antioxidant activities of heat-stressed Cihateup duck. Int. J. Adv. Sci. Eng. Inf. Tech., 10: 1228-1233. https://doi.org/10.18517/ijaseit.10.3.11117[CrossRef]
Kharazi AY, Latipudin D, Suwarno N, Puspitasari T, Nuryanthi N, Mushawwir A (2022). Lipogenesis in Sentul chickens in the starter phase inhibited by irradiated chitosan. IAP Conf. Proc., 1001(1): 1-7. https://doi.org/10.1088/1755-1315/1001/1/012021[CrossRef]
Li D, Li F, Liu W, Han H, Wang J, Hao D, Sun Y (2025). Physiological responses of laying hens to chronic cold stress and ammonia exposure: Implications for environmental management and poultry welfare. Animals, 15(12): 1769. https://doi.org/10.3390/ani15121769[CrossRef]
Livak KJ, Schmittgen TD (2001). Analysis of relative gene expression data using real-time quantitative PCR and the 2−ΔΔCT method. Methods, 25(4): 402–408. https://doi.org/10.1006/meth.2001.1262[CrossRef]
Manin F, Yusrizal M, Adriani L, Mushawwir A (2024). Effects of the combination of probiotics fmand phytobiotics on broiler meat’s performance, gut dysbiosis, and lipid profile. Adv. Anim. Vet. Sci., 12(11): 2110-2117. https://doi.org/10.17582/journal.aavs/2024/12.11.2110.2117[Full text][CrossRef]
Mushawwir A, Adriani L, Permana R, Sahara E (2025a). Egg production and physiological assessment of Sentul hens in temperate and lowland regions of West Java, Indonesia. Adv. Anim. Vet. Sci., 13(2): 413–420. https://doi.org/10.17582/journal.aavs/2025/13.2.413.420[Full text][CrossRef]
Mushawwir A, Permana R, Darwis D, Puspitasari T (2024). The ileum villi growth of native quail fed by irradiated chitosan with glutathione from an early age in high temperature. IOP Conf. Ser. Earth Environ. Sci., 1292(1): 1-6. https://doi.org/10.1088/1755-1315/1292/1/012016[CrossRef]
Mushawwir A, Permana R, Latipudin D, Suwarno D (2023). Flavonoids avoid the damage of ileal plaque-patches of heat-stressed cihateup ducks. IAP Conf. Proc., 2628.140007-1-14007-6. https://doi.org/10.1063/5.0144095[CrossRef]
Mushawwir A, Permana R, Latipudin D, Suwarno N (2021). Organic Diallyl-n-Sulfide (Dn-S) inhibits the glycogenolysis pathway and heart failure in heat-stressed laying hens. IOP Conf. Ser. Earth Environ. Sci., 788: 012091. https://doi.org/10.1088/1755-1315/788/1/012091[CrossRef]
Mushawwir A, Rusmana D, Aritonang HN, Alam ZF, Sahara E, Syamsu JA, Sijid SA, Permana R (2025b). Chemical potential of Burahol (Stelechocarpus burahol) leaf extract (BaLE) and its role as a promoter of metabolism and growth in broilers. Adv. Anim. Vet. Sci., 13(12): 2584–2591. https://doi.org/10.17582/journal.aavs/2025/13.12.2584.2591[Full text][CrossRef]
Nakajo M, Kanda S, Karigo T, Takahashi A, Akazome Y, Uenoyama Y, Tsukamura H, Oka Y (2022). Hypothalamic kisspeptin and kisspeptin receptors: Species variation in reproduction and reproductive behavior. Front. Neuroendocrinol., 64: 100951. https://doi.org/10.1016/j.yfrne.2021.100951[CrossRef]
Pires PGS, Bavaresco C, Prato BS, Wirth ML, Moraes PO (2021). The relationship between egg quality and hen housing systems: A systematic review. Livest. Sci., 250: 104597. https://doi.org/10.1016/j.livsci.2021.104597[CrossRef]
Purwanti S, Pakiding W, Nadir M, Nurhayu, Prahesti KI, Sirajuddin SN, Syamsu JA, Mushawwir A (2024). Lipid regulation and cardiovascular biomarkers of native chickens fed a combination of maggot, Indigofera, and Turmeric. J. Anim. Health Prod., 12(2): 173-181. https://doi.org/10.17582/journal.jahp/2024/12.2.173.181[Full text][CrossRef]
Racevičiūtė-Stupelienė A, Vilienė V, Bliznikas S, Šašytė V, Nutautaitė M (2023). The relationship between different laying hen housing systems in Lithuania and egg production quality and chemical composition. Cogent Food Agric., 9(1): 2211432. https://doi.org/10.1080/23311932.2023.2211432[CrossRef]
Rodríguez-Hernández R, Rondón-Barragán IS, Oviedo-Rondón EO (2024). Egg quality, yolk fatty acid profiles from laying hens housed in conventional cages and cage-free production systems in the Andean tropics. Animals, 14(1): 168. https://doi.org/10.3390/ani14010168[CrossRef]
Rusmana D, Aritonang HN, Sahara E, Alam ZF, Mushawwir A (2026). Integrated poultry energy index (ipei): Toward precision energy nutrition in indonesian native chickens Adv. Anim. Vet. Sci., 14(10): 2242-2249. https://doi.org/10.17582/journal.aavs/2026/14.10.2242.2249[Full text][CrossRef]
Schober P, Boer C, Schwarte LA (2018). Correlation coefficients: Appropriate use and interpretation. Anesth. Analg., 126(5): 1763–1768. https://doi.org/10.1213/ANE.0000000000002864[CrossRef]
Sharma MK, McDaniel CD, Kiess AS, Loar RE II, Adhikari P (2022). Effect of housing environment and hen strain on egg production and egg quality as well as cloacal and eggshell microbiology in laying hens. Poult. Sci., 101(2): 101595. https://doi.org/10.1016/j.psj.2021.101595[CrossRef]
Shoji G, Tochinai R, Sekizawa S, Kuwahara M (2025). Evaluation of physiological functions and production performance in laying hens in three different housing systems. Poult. Sci., 104(8): 105256. https://doi.org/10.1016/j.psj.2025.105256[CrossRef]
Singh R, Patton RN, Mollier RT, Pongener N, Yadav R, Singh V, Chaudrary JK, Kalita H, Babu S (2023). Indigenous chicken production systems in different agro-ecologies of the Indian Himalayan Region: Implications on food and economic security. Front. Nutr., 10: 1244413. https://doi.org/10.3389/fnut.2023.1244413[CrossRef]
Tanuwiria UH, Mushawwir A, Zain M, Despal D (2023). Lipid regulation and growth on native ram lambs in the south coast of West Java, Indonesia fed legume forages. Biodiversity, 24(7): 4183–4192. https://doi.org/10.13057/biodiv/d240763[CrossRef]