

ResearchersLinks

Research Article · Volume 14, Issue 11, 19 October 2026 · Open Access

Market Segmentation of Beef Consumers in a Developing Region: A Dual-Driver System for Demand Stability

· · · · · ·

Affiliations & Notes ⌄
  1. 1Faculty of Animal Husbandry, Universitas Udayana, Badung, 80361, Indonesia
  2. 2Research Center for Social Welfare, Village and Connectivity, National Research and Innovation Agency, Jakarta, 12710, Indonesia. *Correspondence | N. L. P. Sriyani, Faculty of Animal Husbandry, Universitas Udayana, Badung, 80361, Indonesia
  3. 3Email: sriyaninlp@unud.ac.id
Article Info ⌄
Journal:
Advances in Animal and Veterinary Sciences
Published:
19 October 2026

From the article

  • Applying K-means cluster analysis to morning beef shoppers in Denpasar’s traditional wet markets identified a two-cluster volume-driven buyer typology (N = 59).
  • High-Volume Business Buyers (18.6%) purchase larger quantities (~5.55 kg) as commercial food-service inputs, dominated by male operators (81.8%).
  • Both segments share a high visit frequency baseline (~15 visits/month).
  • These empirical findings highlight the operational dualism of morning wet markets, providing empirical baseline data to inform vendor practices and urban food retail planning in developing market contexts.

Selected from the article's own text.

Abstract

Understanding consumer segmentation is critical for explaining how demand for high-value animal-source foods is structured and stabilized in developing markets. This study investigates beef consumer behavior by identifying distinct market segments based on purchasing patterns (volume and frequency) among morning shoppers in traditional wet markets in Denpasar, Bali. Using cross-sectional survey data from 59 respondents (following the exclusion of a single-respondent outlier), non-hierarchical K-means cluster analysis classified consumers into two highly stable and statistically robust behavioral groups (average Silhouette Coefficient = 0.58, representing moderate cluster structure). Cluster 1 (Household Daily Shoppers, 81.4%; n = 48) forms the core of wet-market demand, characterized by moderate-frequency, small-volume transactions (~1.08 ± 0.59 kg, 15.10 ± 13.11 times/month). This segment is heavily dominated by women (66.7%), reflecting a co-evolutionary adaptation that bridges cultural preferences for freshly slaughtered meat with pragmatic household constraints, such as lack of refrigeration and daily cash-flow management. Cluster 2 (High-Volume Business Buyers, 18.6%; n = 11) consists primarily of male informal food-service operators (81.8%) purchasing larger quantities (~5.55 ± 1.75 kg, 15.00 ± 12.37 times/month) as commercial production inputs. Independent-samples t-tests and one-way ANOVA confirmed significant inter-cluster volume separation (F = 214.86, p < 0.001), while purchase frequency did not significantly differ between segments (F = 0.001, p = 0.981) as both maintain high-frequency market engagement (~15 transactions/month). Unit prices were constant across stalls (IDR 120,000/kg) for standard cuts, functioning as a retail constant. Gender was significantly associated with segment membership (Pearson Chi-square = 8.62, p = 0.003; Continuity Correction = 6.74, df = 1, p = 0.009; Cramer’s V = 0.382). These results describe a volume-driven buyer typology where high visit frequency across both domestic and commercial morning shoppers underpins daily transaction throughput. The patterns highlight operational differences between household and commercial buyers in morning wet markets and suggest targeted vendor strategies, such as freshness guarantees for household buyers and reliable bulk-supply arrangements for food-service operators.
 
Keywords | Beef consumption, cluster analysis, consumer segmentation, traditional wet markets, buyer typology, Bali
INTRODUCTION

Meat consumption, particularly beef, functions as a key indicator of economic development and nutritional transition in developing economies ; . In Indonesia, beef transcends its role as merely a food commodity; it carries substantial cultural significance in religious observances and social events, playing a central role in traditional ceremonies and social identities ; ; . Despite its cultural importance, the beef supply chain in emerging markets remains characterized by structural vulnerabilities, including supply scarcity, high import dependency, and persistent retail price volatility that tend to intensify during ; ng external economic shocks ; . Shocks such as pandemics, macroeconomic contractions, and inflationary pressures systematically disrupt household purchasing capacity and micro-business food-service operations, with cascading effects throughout localized food systems ; ; ; .

Most existing empirical research on Indonesian beef consumption relies on aggregate econometric demand systems estimating price and income elasticities . While these studies effectively characterize macro-level demand responses, aggregate models treat consumers as a homogeneous population, obscuring the distributional heterogeneity underlying retail transactions. Aggregate elasticities explain overall market volume shifts but fail to identify who the primary buyer groups are or what behavioral strategies distinguish domestic shoppers from commercial food-service procurement at the retail level. Micro-level behavioral segmentation addresses this limitation by partitioning consumers into distinct behavioral typologies based on transaction characteristics (volume, frequency, and retail channel interaction), providing actionable intelligence for vendor marketing strategies and localized food security interventions ; ; ; ; ; .

To establish a rigorous conceptual foundation, this study anchors its analysis in Consumer Segmentation Theory ; and Retail Dualism Frameworks ; . Market segmentation posits that heterogeneous markets can be meaningfully partitioned into homogeneous sub-groups exhibiting distinct behavioral responses. In urban developing contexts, retail dualism describes the co-existence of traditional wet markets and modern supermarkets. Traditional wet markets function under unique operational boundary conditions—specifically morning trading hours, un-refrigerated fresh cut displays, and direct vendor-buyer negotiations—creating distinct behavioral incentives for shoppers. Furthermore, while qualitative literature emphasizes socio-cultural factors such as preferences for freshly slaughtered (‘hot’) meat ; , these socio-cultural narratives serve as contextual literature background in this study to interpret observed behavioral transaction variables (purchase volume and frequency) and demographic proxies (gender), rather than direct survey constructs

This study addresses these research gaps by employing K-Means Cluster Analysis to profile beef consumers based on their actual purchasing behavior in traditional wet markets in Denpasar, Bali. Specifically, the study defines its empirical scope strictly around morning wet-market transactions at Kreneng Market and Sanglah Market. The specific research objectives are: (1) to identify statistically distinct consumer segments in traditional wet markets based on purchasing volume and frequency; (2) to characterize these segments according to volume scale, visit frequency, and gender profile; (3) to evaluate the operational differences between domestic household shoppers and micro-business food-service buyers; and (4) to derive practical, segment-specific recommendations for retail vendors and urban market policy stakeholders.

MATERIALS AND METHODS

Research location and site selection

The study was carried out in Denpasar, the capital city of Bali Province, Indonesia. Denpasar represents a rapidly growing urban center characterized by a dense population, tourist-driven economic activity, and a persistent cultural heritage. Traditional wet markets continue to serve as the primary retail channels for fresh animal proteins, competing with a growing modern retail sector. Two major traditional wet markets, namely Kreneng Market and Sanglah Market, were selected as the primary research locations due to their high daily transaction volumes and representative customer bases from diverse socio-demographic strata.

Sample and data collection

Respondents (N=60 initially) were recruited using in-market accidental sampling at Kreneng Market and Sanglah Market during regular operating hours (morning to early afternoon, when trading volume peaks). Meat vendors facilitated the identification of shoppers. Inclusion criteria specified that respondents must be at least 18 years of age, identify as the primary or secondary household food purchaser, and consent to the survey. Data were collected using a structured face-to-face questionnaire administered by trained enumerators. The survey instrument captured: (1) average purchase volume per transaction (expressed in kilograms); (2) monthly purchase frequency (number of market visits per month based on a 30-day recall period); (3) average price paid per kilogram (IDR/kg); and (4) basic demographic descriptors including gender, household size, and primary buyer role (domestic vs commercial). The questionnaire was pre-tested for face validity with 10 wet-market shoppers prior to full deployment. Self-reported transaction volumes and visit frequencies were cross-referenced against vendor sales logs where feasible to ensure measurement reliability.

Sampling scope boundary:

While accidental sampling effectively captured active morning wet-market buyers, it introduces an inherent sampling selection bias by over-representing early-morning household shoppers and micro-business buyers who procure meat before noon, while systematically excluding working professionals who shop in the late afternoon or utilize modern supermarkets. Consequently, the empirical findings and segment proportions reported here represent a localized operational baseline of morning wet-market trading activity rather than a city-wide demographic census.

Variable selection and data processing

Prior to cluster analysis, raw data were screened for univariate, bivariate, and multivariate outliers using standardized Z-scores and Mahalanobis distance measures . Standardized Z-scores were calculated for all continuous behavioral variables to eliminate scale differences and ensure equal weighting in distance calculations. Bivariate outlier screening identified a single extreme outlier respondent (n = 1) exhibiting an extreme purchase volume (Z = +4.12) and paying a premium price exceeding IDR 170,000/kg for specialized imported cuts (Price Z = +3.85; Mahalanobis D² = 22.4, p < 0.001). This case exceeded both the standard ±2.5 SD threshold for small samples and the conservative ±3.0 SD threshold. From a statistical perspective, retaining an isolated n = 1 observation in K-means clustering creates a mathematically degenerate cluster that artificially inflates inter-cluster heterogeneity and distorts variance estimation across the remaining sample. Therefore, this single outlier case was excluded from the clustering sample, resulting in a cohesive analytical sample of N = 59.

Price Variable Rationale:

Unit price was originally recorded to test for price-tiered market segmentation (e.g., premium vs economy cuts). However, empirical screening revealed zero price variance among standard local beef cuts across all wet-market stalls during morning trading hours, with all N = 59 respondents paying the uniform prevailing market price of IDR 120,000/kg (mean = IDR 120,000; SD = 0). Because price functioned as an environmental constant across stalls in this retail venue, it was excluded as an active segmenting variable in the cluster analysis to prevent zero-variance computational errors.

Data analysis and cluster validation

Non-hierarchical K-means clustering was applied to the standardized Z-scores of purchase volume and purchase frequency using IBM SPSS Statistics version 25. To establish the optimal number of clusters, alternative cluster partitions (2-cluster, 3-cluster, and 4-cluster solutions) were evaluated using average Silhouette Coefficients . The 2-cluster solution yielded the highest average Silhouette Coefficient (0.58), compared to 0.42 for 3 clusters and 0.36 for 4 clusters, mathematically confirming 2 clusters as the optimal partition. Following Kaufman and Rousseeuw (1990), a Silhouette score of 0.58 indicates a moderate, reasonable cluster structure.

To evaluate cluster separation, independent-samples t-tests and one-way Analysis of Variance (ANOVA) F-tests were performed on the behavioral variables. In cluster analysis methodology, ANOVA F-statistics on active clustering variables serve as descriptive indicators of cluster separation rather than independent hypothesis tests, because K-means mathematically maximizes between-cluster variance on those variables. To examine demographic association without circularity, a Pearson Chi-square test (with Yates’ continuity correction for 2x2 contingency) was conducted between gender and segment membership, accompanied by Cramer’s V to measure association effect size. Statistical significance was established at p < 0.05.

RESULTS

Cluster formation and stability validation

Non-hierarchical K-means clustering stratified the N = 59 morning beef consumers into two distinct behavioral segments. The average Silhouette Coefficient of 0.58 confirms a reasonable, well-separated cluster partition . Convergence was achieved rapidly across iterations, reflecting a stable solution for the standardized two-variable input space.

One-way ANOVA confirmed that the two clusters differ substantially in Purchase Volume ( F = 214.864, df = 1, 57, p < 0.001), reflecting strong descriptive separation along the volume axis (Table 1). Conversely, Monthly Purchase Frequency showed no statistically significant difference between the two groups (F = 0.001, df = 1, 57, p = 0.981), with both segments exhibiting a virtually identical group average of approximately 15 visits per month (~15.10 vs ~15.00 times/month). Unit prices were identical across

Table 1: ANOVA for the final 2-cluster behavioral solution (N=59).

Variable

Cluster Mean Square

df

Error Mean Square

df

F-Statistic

Sig. (p)

Purchase volume (kg)

45.840

1

0.213

57

214.864

< 0.001*

Purchase frequency (times/month)

0.001

1

1.018

57

0.001

0.981 (NS)

Note: *p < 0.05 indicates statistical significance; NS = Not Significant. F-statistics on active clustering variables serve as descriptive indicators of cluster separation.

Table 2: Consumer segment profiles and behavioral characteristics (Mean ± SD).

Characteristic

Segment 1: Household Daily Shoppers

Segment 2: High-Volume Business Buyers

Total Average (N=59)

Sample Size (n, %)

48 (81.4%)

11 (18.6%)

59 (100.0%)

Avg. Purchase Volume

1.08 ± 0.59 kg

5.55 ± 1.75 kg

1.92 ± 1.97 kg

Monthly Frequency

15.10 ± 13.11 times

15.00 ± 12.37 times

15.08 ± 12.87 times

Price Range Paid

IDR 120,000/kg

IDR 120,000/kg

IDR 120,000/kg

Primary Purchase Driver

Domestic Household Consumption

Commercial Food-Service Input

Mixed Retail Baseline

Dominant Gender

Female (66.7%)

Male (81.8%)

Female (57.6%)

Note: Profiles reflect morning wet-market shoppers at Kreneng and Sanglah markets, Denpasar.

Table 3: Association between gender and beef consumer segment membership (N=59).

Gender

Segment 1: Household Daily Shoppers

Segment 2: High-Volume Business Buyers

Total

Female

32 (66.7%)

2 (18.2%)

34 (57.6%)

Male

16 (33.3%)

9 (81.8%)

25 (42.4%)

Total

48 (100.0%)

11 (100.0%)

59 (100.0%)

Note: Pearson Chi-Square = 8.615 (p = 0.003), Continuity Correction = 6.744 (df = 1, p = 0.009), Cramer’s V = 0.382 (p = 0.003).

all respondents (IDR 120,000/kg). This statistical profile demonstrates that the empirical segmentation functions as a volume-driven buyer typology, where high visit frequency represents a shared operational baseline across both domestic and commercial morning shoppers.

Segment profiles and behavioral characteristics

The two segments exhibit distinct transaction scales that correspond directly to their primary buyer roles and operational requirements (Table 2).

Segment 1: Household Daily Shoppers (81.4%; n = 48) forms the dominant core of the market’s buyer base, representing 81.4% of the total sample (n = 48). This group is characterized by small-volume purchases, averaging 1.08 ± 0.59 kg per transaction, with an average monthly purchase frequency of 15.10 ± 13.11 times/month. The large standard deviation in visit frequency (SD = 13.11) indicates substantial internal variation within this domestic segment, encompassing a mix of weekly, bi-weekly, and near-daily shoppers. Demographically, Segment 1 is dominated by female buyers (66.7%), reflecting traditional household food procurement responsibilities in Bali.

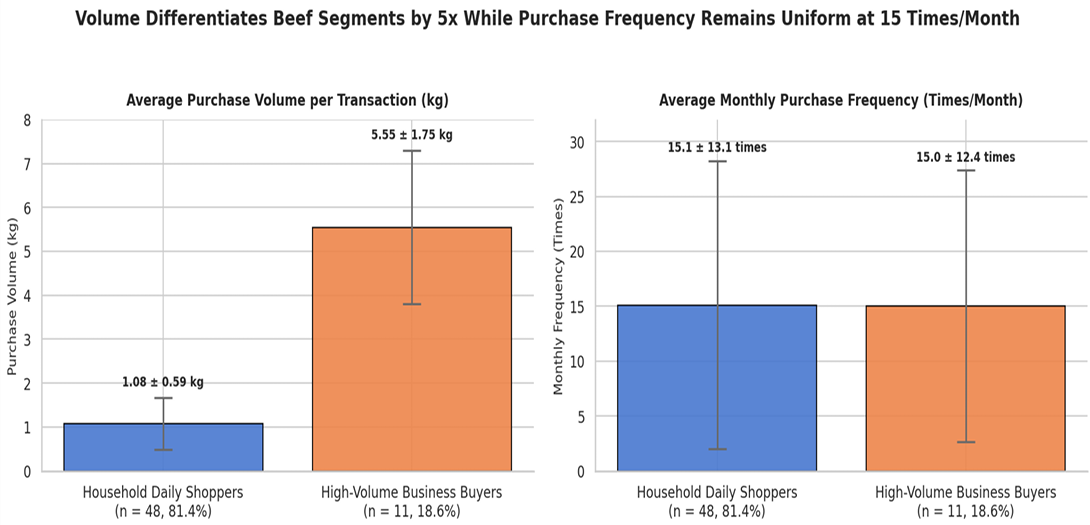
Segment 2: High-Volume Business Buyers (18.6%; n = 11) comprises 18.6% of the sample but accounts for a disproportionately large share of morning market volume throughput. Buyers in this segment purchase significantly larger quantities per transaction, averaging 5.55 ± 1.75 kg, with an average monthly visit frequency of 15.00 ± 12.37 times per month. This segment consists of micro-business operators, primarily local food-service enterprises (e.g., warung food stalls, soto/bakso vendors, and small caterers) who procure fresh beef every few days to maintain daily commercial production. In contrast to Segment 1, Segment 2 is heavily male-dominated (81.8%), reflecting gender-differentiated operational roles in Bali’s informal food-service sector (Table 2 and Figure 1).

Association between gender and segment membership

Pearson’s Chi-square analysis confirmed a statistically significant association between gender and segment membership (Pearson Chi-Square = 8.615, df = 1, p = 0.003; Yates’ Continuity Correction = 6.744, df = 1, p = 0.009). Cramer’s V coefficient was calculated at 0.382 (p = 0.003), indicating a moderate-to-strong association effect size between gender and buyer typology. While females constitute 66.7% of household shoppers (Segment 1), males represent 81.8% of commercial business buyers (Segment 2) (Table 3). This indicates clear gender-differentiated operational roles in Denpasar’s morning wet markets, where females primarily manage domestic household food gatekeeping, while males dominate micro-business food-service procurement.

DISCUSSION

Market structure and operational typology

The empirical two-cluster segmentation identifies a volume-driven buyer typology operating in Denpasar’s morning wet markets. Rather than demonstrating dynamic shock-cushioning over time, which would require longitudinal tracking during price or economic crises, our cross-sectional data provide a structural snapshot of morning market composition. We propose a theoretical hypothesis: wet-market turnover relies on the operational complementarity between a high-volume commercial input segment (18.6% of buyers purchasing ~5.55 kg) and a high-frequency domestic household segment (81.4% purchasing ~1.08 kg). Commercial food-service buyers maintain wholesale volume throughput, while domestic shoppers sustain retail visit consistency. However, validating whether these complementary buyer groups actually buffer vendor incomes during severe economic shocks remains an empirical hypothesis requiring future longitudinal testing.

Household shopping: interplay of economic constraints and freshness practices

Segment 1 (Household Daily Shoppers, 81.4%) represents the domestic core of morning wet-market demand. Their purchasing behavior, buying small quantities (~1.08 kg) with frequent visits (~15 times/month), reflects a combined effect of micro-economic constraints and culinary practices. In urban working-class neighborhoods, frequent small-volume purchasing functions as a practical liquidity management strategy for households operating on daily or weekly informal incomes. Compounding this, household refrigeration deficits restrict bulk storage. Over time, these pragmatic cash-flow and storage constraints have co-evolved with culinary preferences for freshly slaughtered (‘hot’) meat, which is valued for traditional Balinese culinary preparations ; ; ; . Pragmatic liquidity constraints and freshness preferences thus operate as mutually reinforcing factors rather than mutually exclusive explanations.

Socio-cultural lenses: gender roles and relational networks (shuke)

The significant association between gender and buyer segment (Cramer’s V = 0.382) aligns with established qualitative literature on gendered food roles in Bali. Female dominance in household shopping (66.7%) reflects traditional domestic food gatekeeping roles ; , whereas male dominance in business buying (81.8%) reflects commercial food-service operations (e.g., warung management). Furthermore, while relational trust networks, conceptualized in wet-market literature as shuke or regular customer relationships ; , were not directly measured as survey items, they provide a useful qualitative theoretical lens. Domestic shoppers utilize vendor familiarity for informal quality assurance, while commercial buyers leverage regular relationships to secure consistent morning supply and volume credit flexibility.

Vendor strategies and retail implications

Understanding the distinct operational scales of domestic and commercial buyers provides actionable insights for wet-market vendors. For domestic household shoppers, vendors can emphasize freshness guarantees and offer small, customized cut portions to accommodate daily household budgets. For commercial food-service buyers, vendors can establish pre-ordered bulk packaging and reliable morning delivery logistics. Rather than viewing traditional wet markets as outdated retail holdovers, urban planners should recognize their role in catering to specific buyer segments that modern supermarkets may not adequately serve.

Study limitations and future research directions

This study has several important methodological limitations that define its scope boundaries. First, data collection relied on accidental sampling during morning operating hours at two traditional markets in Denpasar, systematically excluding afternoon shoppers, working professionals, and consumers utilizing modern supermarkets. Second, the cross-sectional design (N = 59) precludes causal inferences or direct measurement of dynamic demand shifts over time. Third, behavioral variables were captured via self-reported recall, and qualitative constructs (such as trust networks and cultural attitudes) were not measured as direct survey items. Future research should deploy multi-period stratified sampling across both traditional wet markets and modern retail channels, incorporate longitudinal panels to evaluate price shock responses, and measure socio-economic variables (income, employment, refrigeration access) to formally test the market buffering hypotheses proposed here.

CONCLUSION

Applying K-means cluster analysis to morning beef shoppers in Denpasar’s traditional wet markets identified a two-cluster volume-driven buyer typology (N = 59). Household Daily Shoppers (81.4%) purchase small quantities (~1.08 kg) for domestic consumption, driven by daily liquidity management and freshness preferences, with strong female participation (66.7%). High-Volume Business Buyers (18.6%) purchase larger quantities (~5.55 kg) as commercial food-service inputs, dominated by male operators (81.8%). Both segments share a high visit frequency baseline (~15 visits/month). These empirical findings highlight the operational dualism of morning wet markets, providing empirical baseline data to inform vendor practices and urban food retail planning in developing market contexts.

DECLARATIONS

Data availability

The datasets generated during the current study are available from the corresponding author upon reasonable request.

Acknowledgment

The authors gratefully acknowledge financial support from the Institute for Research and Community Service, Udayana University, through the PNBP Research Grant (2022 fiscal year, Rector’s Decree No. 363/UN14/HK/2022).

NOVELTY STATEMENT

This study reveals a volume-driven buyer typology in traditional urban wet markets, demonstrating that purchasing scale (domestic vs. commercial input) rather than visit frequency drives market segmentation. It empirically disentangles liquidity-driven daily shopping constraints from cultural freshness preferences, providing actionable baseline evidence for segmented retail vendor strategies in developing food systems.

Author Contributions

N.L.P. Sriyani designed and conducted the research, and drafted the manuscript. N.M.A.K. Dewi, I G.N.G. Bidura, and R. Agustine contributed to data processing and analysis. I G.N.B. Raharja, N.P.M. Suartiningsih, and T.I.A.S. Ardani critically reviewed and edited the draft.

Generative AI and AI assisted technology statement

The authors declare that no generative AI and AI assisted technology was used in the creation of this manuscript.

Conflict of interest

The authors declare that there is no conflict of interest regarding the publication of this article.

Figures

Figure 1:
Figure 1:.
Comparison of average purchase volume per transaction (kg, left) and monthly purchase frequency (times/ month, right) between Segment 1 (Household Daily Shoppers, n = 48) and Segment 2 (High-Volume Business Buyers, n = 11). Error bars represent standard deviations (±SD).

References

  1. Abdalla NR, Bavorova M, Gruener S (2023). Meat consumption in transition: The case of crisis region of Iraqi Kurdistan. J. Int. Food Agribus. Market., 35(1): 45–65. https://doi.org/10.1080/08974438.2021.1936332[CrossRef]
  2. Ali J, Kapoor S, Moorthy J (2010). Buying behaviour of consumers for food products in an emerging economy. Br. Food J., 112(2): 109–124. https://doi.org/10.1108/00070701011018806[CrossRef]
  3. Anderson JD, Mitchell JL, Maples JG (2021). Lessons from the COVID-19 pandemic for food supply chains. Appl. Anim. Sci., 37: 738–747. https://doi.org/10.15232/aas.2021-02223[CrossRef]
  4. Asante-Addo C, Weible D (2020). Profiling consumers based on information use and trust in a developing economy. Int. J. Consumer Stud., 44(3): 285–295. https://doi.org/10.1111/ijcs.12565[CrossRef]
  5. Bozma G, Urak F, Bilgic A, Florkowski WJ (2023). The volatility of beef and lamb prices in Türkiye: The role of COVID–19, livestock imports, and energy prices. PLoS ONE, 18(3): 1–26. https://doi.org/10.1371/journal.pone.0282611[CrossRef]
  6. Davis KF, Downs S, Gephart JA (2021). Towards food supply chain resilience to environmental shocks. Nature Food, 2(1): 54–65. https://doi.org/10.1038/s43016-020-00196-3[CrossRef]
  7. Fatimah S, Syafrini D, Wasino, Zainul R (2021). Rendang lokan: History, symbol of cultural identity, and food adaptation of Minangkabau tribe in West Sumatra, Indonesia. J. Ethnic Foods, 8(12): 1–10. https://doi.org/10.1186/s42779-021-00088-2[CrossRef]
  8. Frank RE, Massey WF, Wind Y (1972). Market segmentation. Prentice-Hall.
  9. Geertz S (1978). The bazaar economy: Information and search in peasant marketing. Am. Econ. Rev., 68(2): 28–32.
  10. Gonen LD, Tavor T, Spiegel U (2024). Unlocking market potential: Strategic consumer segmentation and dynamic pricing for balancing loyalty and deal seeking. Mathematics, 12: 1–31. https://doi.org/10.3390/math12213364[CrossRef]
  11. Götze F, Brunner TA (2021). A consumer segmen tation study for meat and meat alternatives in switzerland. Foods, 10(6): 1–14. https://doi.org/10.3390/foods10061273[CrossRef]
  12. Hair JF, Black WC, Babin BJ, Anderson RE (2019). Multivariate data analysis (8th Edition). Cengage learning. www.cengage.com/highered
  13. Hobbs JE (2021). The Covid-19 pandemic and meat supply chains. Meat Sci., 181: 1–6. https://doi.org/10.1016/j.meatsci.2021.108459[CrossRef]
  14. Huang Y, Muin MF, Hong C (2025). Consumption diversity and demand elasticity in animal-sourced foods: a cross-country analysis from Asia. Cogent Food Agric., 11(1): 1–26. https://doi.org/10.1080/23311932.2025.2586820[CrossRef]
  15. Kaufman L, Rousseeuw PJ (1990). Finding groups in data an introduction to cluster analysis. Wiley. https://doi.org/10.1002/9780470316801[CrossRef]
  16. Klein JA (2013). Everyday approaches to food safety in kunming. China Q., (214): 376–393. https://doi.org/10.1017/S0305741013000325[CrossRef]
  17. Komalawati, Asmarantaka RW, Nurmalina R, Hakim DB (2019). Modeling price volatility and supply response of Beef in Indonesia. Trop. Anim. Sci. J., 42(2): 159–166. https://doi.org/10.5398/tasj.2019.42.2.159[CrossRef]
  18. Kotler P, Keller KL (2016). Marketing Management (Global Edi). Pearson Education.
  19. Ortiz A, Díaz-Caro C, Tejerina D, Escribano M, Crespo E, Gaspar P (2021). Consumption of fresh Iberian pork: Two-stage cluster for the identification of segments of consumers according to their habits and lifestyles. Meat Sci., 173: 1–11. https://doi.org/10.1016/j.meatsci.2020.108373[CrossRef]
  20. Pugra IW, Kencanawati AAAM, Kurniawan IGWA (2025). The cultural significance of traditional foods in shaping Indonesian social identity: Challenges and preservation strategies. J. Lang. Literat. Social Cult. Stud., 3(1): 21–31. https://doi.org/10.58881/jllscs.v3i1.318[CrossRef]
  21. Reardon T, Timmer CP, Minten B (2012). Supermarket revolution in Asia and emerging development strategies to include small farmers. Proceed. Natl. Acad. Sci. U.S.A., 109(31): 12332–12337. https://doi.org/10.1073/pnas.1003160108[CrossRef]
  22. Thies AJ, Staudigel M, Weible D (2023). A segmentation of fresh meat shoppers based on revealed preferences. Agribusiness, 39(4): 1075–1099. https://doi.org/10.1002/agr.21828[CrossRef]
  23. Ueta MH, Tanaka J, Marchioni DML, Verly E, de Carvalho AM (2024). Food sustainability in a context of inequalities: meat consumption changes in Brazil (2008–2017). Environ. Develop. Sustain., 26(3): 6377–6391. https://doi.org/10.1007/s10668-023-02967-x[CrossRef]
  24. Wijaya S (2019). Indonesian food culture mapping: A starter contribution to promote Indonesian culinary tourism. J. Ethn. Foods, 6(9): 1–10. https://doi.org/10.1186/s42779-019-0009-3[CrossRef]
  25. Yu Z, Razzaq A, Rehman A, Shah A, Jameel K, Mor RS (2022). Disruption in global supply chain and socio-economic shocks: a lesson from COVID-19 for sustainable production and consumption. Operat. Manage. Res., 15(1–2): 233–248. https://doi.org/10.1007/s12063-021-00179-y[CrossRef]
  26. Zhong S, Crang M, Zeng G (2020). Constructing freshness: The vitality of wet markets in urban china. Agric. Hum. Values, 37(1): 175–185. https://doi.org/10.1007/s10460-019-09987-2[CrossRef]

Services

Article usage statistics

Loading…

Market Segmentation of Beef Consumers in a Developing Region: A Dual-Driver System for Demand Stability · ResearchersLinks