Research Article · Volume 14, Issue 10, 15 September 2026 · Open Access
Integrated Poultry Energy Index (IPEI): Toward Precision Energy Nutrition in Indonesian Native Chickens
· · · ·
Affiliations & Notes ⌄
1Department of Animal Nutrition and Feed Technology, Faculty of Animal Science, Padjadjaran University, Jalan Ir. Soekarno Km. 21 Jatinangor, Sumedang 45363, West Java, Indonesia
2Department of Animal Bioscience, Faculty of Food Security, Surabaya State University. Campus 3, Jl. Prof. Dr. Moestopo No. 4, Pacar Keling, Tambaksari District, Surabaya, East Java 60131, Indonesia
3Animal Science, Faculty of Agriculture, Sriwijaya University, Jalan Palembang-Prabumulih, KM 32, Inderalaya, Ogan Ilir Regency, 30662, South Sumatra, Indonesia
4Department of Biology, College of Science, De La Salle University, 2401 Taft Avenue, Manila 1004, Philippines. *Correspondence | Denny Rusmana, Department of Animal Nutrition and Feed Technology, Faculty of Animal Science, Padjadjaran University, Jalan Ir. Soekarno Km. 21 Jatinangor, Sumedang 45363, West Java, Indonesia, Email: denny.rusmana@unpad.ac.id
Increasing the diet’s metabolisable energy significantly improves feed efficiency, energy metabolism, immune responses, and growth in Indonesian local chickens.
While increased energy intake triggers several physiological reactions, research shows that 2800 kcal/kg (MER-3) is optimal, offering the best overall biological balance.
The Integrated Poultry Energy Index (IPEI) supports this, ranking MER-3 as the top choice and recommending it for precise energy nutrition in these chickens.
The IPEI can be a valuable tool for assessing the energy sufficiency of poultry diets in nutrition research and development.
Selected from the article's own text.
Abstract
This study investigated how dietary metabolisable energy (ME) levels affect feed efficiency, energy metabolism, immune response, and growth in Indonesian local chickens. It also introduced the Integrated Poultry Energy Index (IPEI) as a comprehensive method for identifying optimal energy levels. The experiment involved 250 12-week-old chickens, divided into five groups with ME levels of 2400, 2600, 2800, 3000, and 3200 kcal/kg diet, with five replicates of 10 birds each. We analysed the data using one-way ANOVA and Tukey’s test (P<0.05). We normalised the data to create four sub-indices—feed utilisation, energy metabolism, immune response, and growth performance—that formed the IPEI. We assessed each parameter’s importance in the energy-level response using Shapley Additive Explanations (SHAP) and visualised metabolic patterns with the Metabolic Energy Signature Map (MESM). Results indicated that ME levels significantly affected feed efficiency, energy metabolism, immune status, and growth (P<0.05). Overall, 2800 kcal/kg produced the most balanced biological response, while higher levels did not proportionally improve nutrient utilisation. The IPEI identified 2800 kcal/kg (MER-3) as the optimal level, with the highest index score, balancing feed efficiency, energy metabolism, immune function, and growth. Therefore, the IPEI offers a useful multidomain tool to support precision energy nutrition and guide energy requirement recommendations for Indonesian local chickens.
Energy is the most vital nutrient in poultry diets because it supports all physiological functions, including basic body processes, tissue metabolism, immunity, growth, and production. For Indonesian local chickens, energy needs are even more important because their unique genetics, growth rates, and adaptability differ from commercial breeds. As a result, their response to feed energy levels may not always match standard recommendations for intensive strains. An imbalance, whether too little or too much energy, can impair nutrient absorption, increase fat buildup, interfere with metabolism, and ultimately decrease productivity. .
The rise of precision nutrition has shifted the focus from generic dietary recommendations to customising diets based on livestock’s biological responses. Success in energy formulation now depends not only on boosting production but also on maintaining metabolic efficiency, physiological balance, health, and immune function . This strategy is particularly important for local Indonesian chickens, which are well adapted to tropical climates but show considerable differences in metabolic responses to feed-quality variations ; .
As advances in multivariate analysis and machine learning continue, nutritional evaluations increasingly integrate multiple biomarkers into a composite index ; . This approach is considered more representative than single-parameter analysis because it synthesises information across biological domains into a single, easily interpretable value. The OECD (2018) explains that composite indicators can distil complex biological systems into quantitative measures while retaining essential information from each component. In the livestock sector, similar approaches are increasingly used to assess welfare, environmental resilience , and animal health . However, their application for assessing metabolic energy adequacy in local chickens remains very limited to date.
Under these conditions, we developed a new approach to consolidate various energy-use indicators into a single comprehensive biological index. The Integrated Poultry Energy Index (IPEI) combines parameters such as feed utilisation efficiency, energy metabolism, immune response, and production performance to provide a holistic view of the energy and nutritional status of local Indonesian chickens. This approach aims to make research findings easier to interpret and provide a scientific basis for selecting the energy level that enhances productivity without compromising animal health.
The current study evaluated the effects of varying dietary metabolisable energy levels on the biological responses of Indonesian local chickens by developing the Integrated Poultry Energy Index (IPEI). This index is expected to support precision energy nutrition in Indonesian local chickens and provide a stronger scientific basis for developing energy-requirement recommendations by integrating physiological, metabolic, immunological, and production performance indicators.
MATERIALS AND METHODS
Animal samples, basal rations, and experimental design
This study used 220-week-old local chickens. They were assigned to five experimental groups with energy ration levels of 2400 kcal/kg (MER-1) and 2600, 2800, 3000, and 3200 kcal/kg (MER-2, MER-3, MER-4, and MER-5, respectively). Each treatment group consisted of five replicates, each containing 10 chickens.
During the eight-week metabolic energy intervention, we provided a basal ration with identical protein content across all treatment groups (18%) and with fat, crude fibre, calcium, and phosphorus at 8%, 5%, 4.1%, and 0.5%, respectively. The feed ingredients used included corn flour, rice bran, fish meal, soybean meal, bone meal, coconut oil, and coconut meal.
A thermometer and a digital hygrometer (model YGH-5275; 100 x 25 x 95 mm) were placed in 4 units inside the experimental cage and 1 unit outside the cage. We recorded temperature and humidity throughout the study. The average daily temperature and humidity during the study were 26.50C and 82.7%, respectively.
Blood sampling and sample analysis
We collected blood samples monthly and recorded body weight and feed consumption weekly. We analysed collected blood samples for neutrophil and lymphocyte levels using a haematology analyser.
We analysed a portion of the blood samples to assess plasma metabolite profiles related to energy metabolism using spectrophotometric techniques with the Biolabo KIT protocol. Parameters related to immunity were determined using ELISA methods following the protocol and instructions for the Mybiosource KIT.
Data analysis
We used one-way analysis of variance (ANOVA) to analyse the data, followed by Tukey’s test at a 5% significance level if differences between treatments were significant. All results are shown as means ± standard deviations. To assess biological responses thoroughly, we normalised all parameters to a 0–100 scale using the min–max method. These were combined into four sub-indices: Feed Utilisation Index, Energy Metabolism Index, Immune Response Index, and Growth Performance Index. Finally, we integrated these into an overall Poultry Energy Index (IPEI) with equal weights.
We analysed each parameter’s relative contribution to energy-level classification using a Random Forest model. We then visualised metabolic response patterns with a z-score-based Metabolic Energy Signature Map (MESM), using heatmaps to identify distinctive metabolic characteristics at each metabolic energy level.
RESULTS AND DISCUSSION
Feed utilisation (fu)
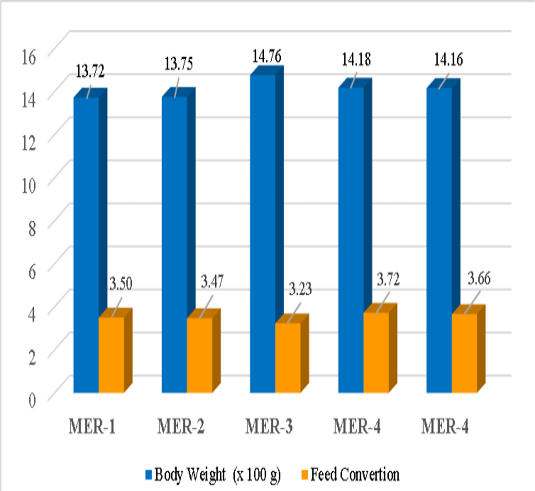
Rations with different metabolizable energy levels significantly affected nutrient utilisation efficiency in Indonesian local chickens (P < 0.05; Table 1). Generally, as energy levels increased from MER-1 to MER-3, nutrient utilisation improved, as shown by higher digestibility, nitrogen retention, and metabolizable energy. MER-3 (2800 kcal/kg) produced the best response, consistently yielding the highest values in most feed utilisation metrics. However, further increases in energy beyond this point did not enhance nutrient efficiency. The MER-4 group declined compared with MER-3, and MER-5 showed a more substantial decrease across nearly all measured parameters. The MER-3 group showed improved ration utilisation, followed by the best body weight gain and FCR (Figure 1).
The rise in feed utilisation efficiency at metabolizable energy levels up to MER-3 shows that a well-balanced energy supply is essential for maximising digestion, absorption, and nutrient use in Indonesian local chickens . When energy is available in appropriate amounts, it can boost digestive metabolic activity, improve nutrient transport across the intestinal lining, and provide enough energy for protein production and other anabolic activities.
The decrease in efficiency at the highest energy level likely reflects an imbalance between energy supply and tissue metabolic needs. Excess energy can reduce feed intake , slow digesta passage, and increase fat deposition rather than its utilisation for body tissue synthesis . This phenomenon suggests that the biological response to increased ration energy is nonlinear and follows the concept of optimal energy utilisation, in which a specific energy range can produce the highest metabolic efficiency ; .
Metabolic adaptation and growth performance
The energy level significantly affected the energy metabolism profile and growth performance of Indonesian local chickens (P < 0.05; Table 2). In general, increasing the ration energy level was accompanied by changes in various metabolic indicators, reflecting increased energy availability and utilisation in the body. This response was evidenced by increases in several energy-metabolism-related biomarkers, accompanied by changes in blood lipid and protein profiles, indicating metabolic adjustments to the increased energy supply.
These metabolic changes were linked to better growth performance in chickens. Final body weight tended to increase with higher ration energy levels (Figure 1), while feed utilisation efficiency varied across treatments, reflecting differences in how chickens convert nutrients into growth. The shifts observed in energy metabolism suggest that ration energy level significantly influences chicken metabolic homeostasis ; .
Adequate energy availability boosts substrates for glycolysis, the citric acid cycle, and oxidative phosphorylation, enhancing ATP production ; . This supports protein synthesis, tissue growth , and optimal development ; . Increases in glucose and total protein at the right energy levels suggest that energy is used more for anabolic processes than for maintenance ; .
The results also show higher triglyceride and cholesterol levels at higher energy levels, indicating that excess energy is directed toward the lipogenesis pathway after basic energy and growth requirements are met. Lipid accumulation is a common physiological response when energy supply exceeds tissue utilisationcapacity ; , so metabolic efficiency no longer increases proportionally ; . A decrease in HDL levels at the highest energy level also indicates adverse changes in lipid metabolism when excessive energy intake is maintained
Table 1: Effects of dietary metabolizable energy levels on feed utilisation of Indonesian native chickens.
Parameter
MER-1
MER-2
MER-3
MER-4
MER-5
P-value
Dry organic matter digestibility (%)
59.49 ± 1.43ᶜ
68.84 ± 1.62ᵇ
73.64 ± 1.22ᵃ
65.60 ± 1.55ᵇ
50.35 ± 0.89ᵈ
<0.001
Dry matter digestibility (%)
48.68 ± 1.63ᵈ
65.87 ± 1.63ᵇ
68.92 ± 1.70ᵃ
64.28 ± 1.72ᵇ
60.60 ± 1.49ᶜ
<0.001
Crude protein digestibility (%)
65.35 ± 1.42ᶜ
70.73 ± 1.25ᵇ
73.68 ± 1.39ᵃ
64.43 ± 1.63ᶜ
63.25 ± 1.47ᶜ
<0.001
Nitrogen retention (%)
67.32 ± 1.97ᶜ
71.52 ± 2.17ᵇ
75.57 ± 1.96ᵃ
70.22 ± 2.15ᵇ
66.94 ± 2.37ᶜ
<0.001
Nitrogen-corrected metabolizable energy (kcal/kg)
2439 ± 66ᶜ
2601 ± 100ᵇ
2773 ± 100ᵃ
2561 ± 99ᵇ
2342 ± 104ᶜ
<0.001
Metabolizable energy (kcal/kg)
2360 ± 95ᵇ
2576 ± 95ᵃ
2605 ± 95ᵃ
2564 ± 96ᵃ
2398 ± 95ᵇ
0.001
Different superscripts in the same row indicate significant differences according to Tukey’s HSD test at P < 0.05.
Table 2: Effects of dietary metabolizable energy levels on energy metabolism and growth performance of Indonesian native chickens.
Parameter
MER-1
MER-2
MER-3
MER-4
MER-5
P-value
Energy metabolism
Blood glucose (mg/dL)
227.32±2.63ᵇ
232.63±3.84ᵃ
231.74±3.07ᵃ
232.58±3.47ᵃ
234.66±2.85ᵃ
0.041
Triglycerides (mg/dL)
86.74±2.04ᵉ
113.77±2.39ᵈ
127.92±2.45ᶜ
142.25±2.35ᵇ
167.38±2.06ᵃ
<0.001
Total cholesterol (mg/dL)
165.26±3.27ᵉ
173.28±3.47ᵈ
185.81±3.19ᶜ
194.83±3.16ᵇ
207.26±4.27ᵃ
<0.001
Total protein (g/L)
38.06±2.63ᵇ
37.04±2.04ᵇ
44.46±2.83ᵃ
37.27±2.64ᵇ
36.71±1.82ᵇ
<0.001
Albumin (g/L)
24.18±2.04ᵇ
22.62±2.27ᶜ
26.38±2.55ᵃ
24.44±2.38ᵇ
23.92±2.41ᵇᶜ
0.013
HDL (mg/dL)
127.73±3.74ᵃ
122.69±4.03ᵇ
123.57±3.43b
109.31±3.03ᶜ
95.61±4.02ᵈ
<0.001
Growth performance
Final body weight (×1000 g)
13.75 ± 0.66ᵇ
13.74 ± 1.10ᵇ
14.07± 1.59ᵃᵇ
14.17 ± 1.37ᵃ
14.18 ± 1.27ᵃ
0.046
Feed conversion ratio (FCR)
3.50 ± 0.55ᵃ
3.47 ± 0.50ᵃ
3.54 ± 0.49ᵃ
3.72 ± 0.09ᵇ
3.66 ± 0.08ᵇ
0.031
Different superscripts in the same row indicate significant differences according to Tukey’s Honestly Significant Difference (HSD) test at the P < 0.05 level.
Table 3: Effects of dietary metabolizable energy levels on immune responses of indonesian native chickens.
Parameter
MER-1
MER-2
MER-3
MER-4
MER-5
P-value
N/L ratio
0.69±0.03ᵃ
0.61±0.04ᵇ
0.58±0.02ᶜ
0.47±0.03ᵈ
0.35 ± 0.03ᵉ
<0.001
sIgA (ng/mL)
778.15±3.14ᵉ
784.11±1.87ᵈ
786.62±2.87ᶜ
791.34±0.71ᵇ
793.92±1.61ᵃ
<0.001
IgG (g/L)
4.69±0.34ᵉ
5.61±0.47ᵈ
5.82±0.10ᶜ
6.59±0.25ᵇ
7.81±0.10ᵃ
<0.001
IgM (g/L)
1.18±0.13ᵉ
1.70±0.09ᵈ
2.21±0.05ᶜ
2.44±0.05ᵇ
2.67±0.03ᵃ
<0.001
SAA (mg/L)
7.46±0.20ᵃ
6.74±0.24ᵇ
5.74±0.16ᶜ
4.52±0.24ᵈ
2.14±0.19ᵉ
<0.001
LBP (µg/mL)
9.35±0.41ᵃ
7.92±0.29ᵇ
5.08±0.20ᶜ
3.66±0.15ᵈ
1.86±0.10ᵉ
<0.001
Different superscript letters in the same row indicate significant differences according to Tukey’s Honestly Significant Difference (HSD) test at the P<0.05 level. N/L=Neutrophil/Lymphocyte ratio; sIgA=Secretory IgA=Immunoglobulin A; IgM=Immunoglobulin M; SAA=Serum amyloid A; LBP =Lipolysaccharide-binding protein.
over the long term ; .
Immune responses
The metabolizable energy level of the ration significantly affected various immune response indicators in Indonesian local chickens (P<0.05; Table 3). In general, higher energy levels were associated with improved immune status, as indicated by higher immunoglobulin concentrations and lower inflammatory biomarkers and immune stress indicators. Humoral immune responses increased with energy level, whereas inflammatory indicators consistently decreased.
Furthermore, the neutrophil-to-lymphocyte ratio, an indicator of the balance between the immune response and physiological stress, decreased at higher energy levels. These findings indicate that improved immune status is crucial to optimal energy utilisation in Indonesian local chickens.
This study shows that sufficient energy intake is crucial for immune activation and regulation. Processes such as immune cell activation, immunoglobulin production, lymphocyte growth, and the creation of defence molecules all depend on adequate energy supplies . Consequently, better energy status helps immune cells work more effectively, leading to higher immunoglobulin levels and a stronger capacity to sustain immune balance ; .
Increased concentrations of IgA, IgG, and IgM indicate that adequate energy supports humoral immune responses at both mucosal and systemic levels. Secretory IgA serves as the first line of defence on the mucosal surfaces of the gastrointestinal tract , while IgG and IgM contribute to antigen neutralisation and activation of the adaptive immune response ; . Concurrently, decreases in the neutrophil-to-lymphocyte ratio, serum amyloid A , and lipopolysaccharide-binding protein levels indicate reduced inflammatory activation and improved intestinal barrier integrity . This reduces endotoxin translocation into the circulation, thereby lowering the energy required to maintain the inflammatory response ; .
Integrated poultry energy index (ipei)
Table 4 presents a thorough assessment of biological responses across all parameters, combined into four sub-indices: Feed Utilisation Index (FUI), Energy Metabolism Index (EMI), Immune Response Index (IRI), and Growth Performance Index (GPI), to calculate the Integrated Poultry Energy Index (IPEI).
MER-3 (2800 kcal/kg) produced the highest IPEI (73.39), categorised as High. MER-3 was the most balanced energy level across multiple domains. MER-3 achieved maximum feed utilisation, had the best energy metabolism and growth performance, and still demonstrated a good immune response. MER-5 produced the highest immune index, but this superiority was not accompanied by efficient feed utilisation and energy metabolism. Therefore, increasing energy to 3200 kcal/kg did not result in a better integrated biological response. These results support an energy optimum at MER-3, rather than a pattern in which higher energy is better.
These research results support the concept of precision energy nutrition, which holds that the success of ration formulation depends not only on high energy content but also on the animal’s ability to utilise that energy efficiently. Therefore, energy evaluation should use a multidimensional approach that integrates indicators of digestibility, nutrient retention, metabolism, and physiological responses, rather than relying solely on production performance.
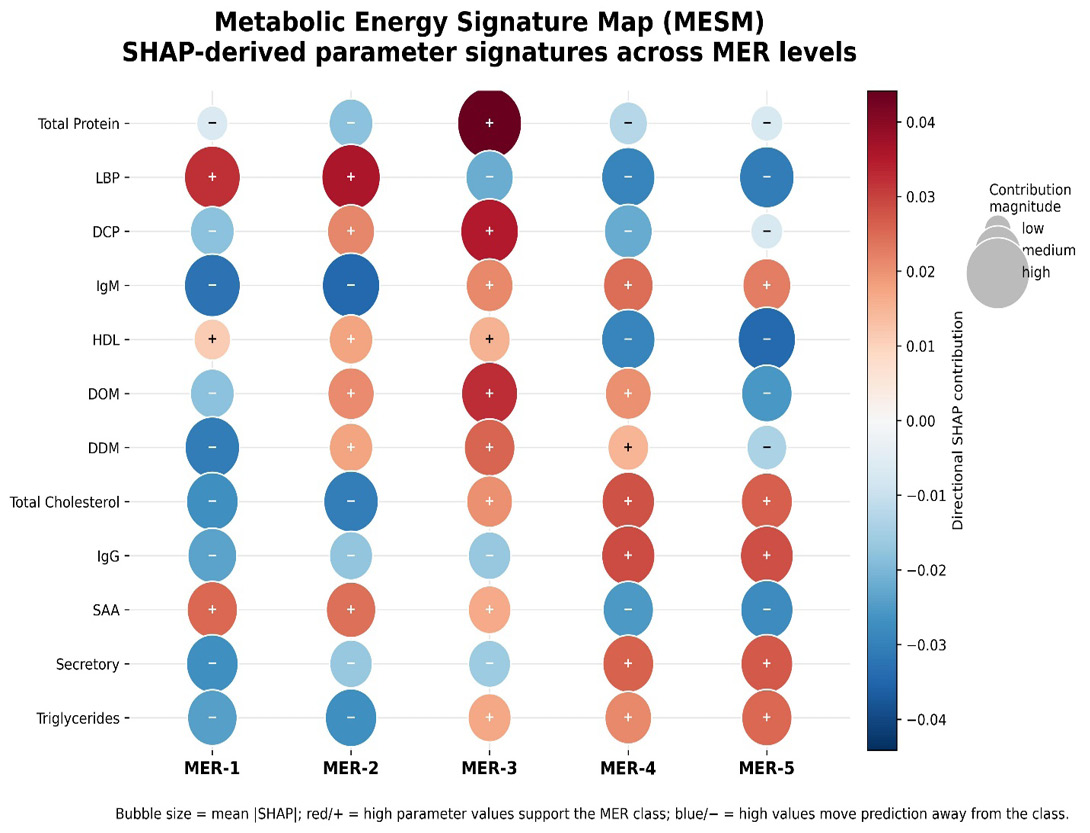
The contribution of each parameter that significantly influences the experimental chickens in each treatment group is depicted in the Metabolic Energy Signature Map (MESM) (Figure 2). The MESM results show that each metabolic energy level (MER-1 to MER-5) has a unique metabolic fingerprint, indicating variation in physiological responses, energy metabolism, immune status, and performance in local Indonesian chickens. At lower energy levels (MER-1 and MER-2), the dominant parameters mainly relate to basic energy utilisation efficiency and signs of metabolic adaptation.
In contrast, at the medium energy level (MER-3), metabolic parameters, immunity, and production performance contribute more evenly. Conversely, at high energy levels (MER-4 and MER-5), the largest contributions come from parameters related to energy utilisation, energy retention, ration efficiency, and physiological responses that support growth and productivity. The radial pattern in the MESM shows that each energy treatment has a different combination of key parameters, resulting in specific biological characteristics. This visualisation helps identify dominant biomarkers at each energy level and shows shifts in metabolic priorities as the diet’s energy content increases.
The distinct metabolic fingerprint patterns at each MER level indicate that the biological response to increased energy is multidimensional and that no single indicator can fully describe metabolic status. The dominance of certain parameters at each energy level indicates that chickens adjust their metabolism to optimise energy use for maintenance, growth, and other physiological functions. This is consistent with the concept that energy is the primary limiting factor governing nutrient allocationacross biological processes, including tissue synthesis, immune function, and production efficiency ; .
Table 4: Integrated Poultry Energy Index (IPEI) of local chicken with different energy ratios.
Groups
FUI
EMI
IRI
GPI
IPEI
Ranking
Category
MER-1
14.38
62.50
0.00
45.39
30.57
5
Low
MER-2
72.89
52.65
26.70
50.00
50.56
3
Moderate
MER-3
100.00
74.40
46.95
72.20
73.39
1
High
MER-4
54.32
39.92
70.70
48.88
53.46
2
Moderate
MER-5
12.40
20.83
100.00
61.42
48.66
4
Moderate
MESM visualisations also show a shift in biomarker contributions from baseline metabolic parameters to those associated with energy-use efficiency and productivity at higher energy levels. These results support reports that enhancing energy balance boosts metabolic efficiency, energy retention, and growth performance, as long as other nutritional needs are satisfied .
CONCLUSION
Increasing the diet’s metabolisable energy significantly improves feed efficiency, energy metabolism, immune responses, and growth in Indonesian local chickens. While increased energy intake triggers several physiological reactions, research shows that 2800 kcal/kg (MER-3) is optimal, offering the best overall biological balance. The Integrated Poultry Energy Index (IPEI) supports this, ranking MER-3 as the top choice and recommending it for precise energy nutrition in these chickens. The IPEI can be a valuable tool for assessing the energy sufficiency of poultry diets in nutrition research and development.
ACKNOWLEDGEMENTS
The authors thank the Ministry of Higher Education, Research, and Technology of Indonesia for supporting this significant research through a basic research grant, contract number 251/C3/DT.05.00/PL-BARU/2026 from DPPM Universitas Padjadjaran, dated April 13, 2026, and the partnership between DPPM Universitas Padjadjaran and the researchers (1714/UN6.3.1/PT.00/2026, dated April 22, 2026). They also thank everyone directly involved.
NOVELTY STATEMENT
This study introduces the Integrated Poultry Energy Index (IPEI), the first multi-domain composite index designed to assess metabolic energy adequacy in Indonesian local chickens. Unlike traditional methods that focus solely on performance measures, the IPEI integrates factors such as feed utilisation efficiency, energy metabolism, immune response, and growth performance into a single, comprehensive indicator. This unified approach enables identification of optimal energy levels based on a broad range of biological responses, rather than productivity alone. It offers a new framework for applying precision energy nutrition in Indonesian local chickens and could be adapted for broader poultry nutrition research.
AUTHORS’ CONTRIBUTION
All authors listed in this article have contributed equally, from planning, designing, and conducting the research to writing this article. All authors have played an equal role, drawing on their respective expertise and specialisation.
Ethical approval
The Animal Ethics Committee of the Research Licence Management Directorate, UNM, with certificate (No.1042/KEP.08/SK/012/2026), approved and declared this study, with the applications described in the research methods, to meet animal ethics requirements.
Generate ai and ai-assisted technology statement
Penyusunan dan penulisan draf artikel ini menggunakan fasilitas dan bantuan teknologi yang terkait dengan AI.
Conflict of interest
All authors declare no conflict of interest regarding costs, data, or any other aspects related to this research with any party.
Figures
Figure 1:.
Final body weight and feed conversion ratio (FCR) of experimental chickens
Figure 2:.
Contribution of dominant parameters to the visualisation of metabolic fingerprint patterns through MESM analysis.
References
Abdelli N, Solà‐Oriol D, Pérez JF (2021). Phytogenic feed additives and energy in poultry: Achievements, prospects and challenges [review of phytogenic feed additives in poultry: Achievements, Prospects and Challenges]. Animals, 11(12), 3471. https://doi.org/10.3390/ani11123471[CrossRef]
Abdel-Moneim AE, Shehata AM, Khidr RE, Paswan VK, Ibrahim NS, El-Ghoul AA, Aldhumri SA, Gabr SA, Mesalam NM (2021). Nutritional manipulation to improve poultry immune response under environmental stress. Animals. 11:1761.
Abouelezz K, Jiang Z, Gou Z, Wang Y, Jiang S (2022). Effects of metabolic energy intervention on lipid content and liver transcriptome in finisher yellow-feathered chickens. Ital. J. Anim. Sci., 21: 1362-1370. 10.1080/1828051X.2022.2116607. https://doi.org/10.1080/1828051X.2022.2116607[CrossRef]
Aengwanich, W (2017). Effects of high environmental temperature on blood indices of Thai Indigenous chickens, Thai Indigenous crossbred chickens, and broilers. Int. J. Poult. Sci., 6(1), 427-430. https://doi.org/10.3923/ijps.2007.427.430[CrossRef]
Aguiar M C S, Silva M F, Das G F, Fernandes J B, Forim M R (2020). Evaluation of the microencapsulation of orange essential oil in biopolymers by using a spray-drying process. Sci. Rep., 10(1): 234-239. https://doi.org/10.1038/s41598-020-68823-4[CrossRef]
Ahmed-Farid O A, Salah A S, Nassan M A, El-Tarabany M S (2021). Effects of chronic thermal stress on performance, energy metabolism, antioxidant activity, brain serotonin, and blood biochemical indices of broiler chickens. Animals. 11: 2554. https://doi.org/10.3390/ani11092554[CrossRef]
Amer S A, Tolba S A, AlSadek D M M, Fattah D M A, Hassan A M, Metwally A E (2021). Effect of supplemental glycerol monolaurate and oregano essential oil blend on the growth performance, intestinal morphology, and amino acid digestibility of broiler chickens. BMC Vet. Res., 17(1): 25-31. https://doi.org/10.1186/s12917-021-03022-5[CrossRef]
Aritonang H N, Adriani L, Mushawwir A (2025). Effect of moringa leaves (moringa oleifera) oil microcapsules (mom) on growth and plasma metabolites related to inflammation in sentul chickens. Adv. Anim. Vet. Sci., 13:835–842. https://doi.org/10.17582/journal.aavs/2025/13.4.835.842[Full text][CrossRef]
Bortoluzzi C, Lahaye L, Oxford JH, Detzler D, Eyng C, Barbieri NL, Santín E, Kogut MH (2021). Protected organic acid and essential oils for broilers raised under field conditions: intestinal health biomarkers and cecal microbiota. Front. Physiol., 12(3):64-71. https://doi.org/10.3389/fphys.2021.722339[CrossRef]
Chen X, Shang S, Yan F, Jiang H, Zhao G, Tian S, Chen R, Chen D, Dang Y (2023). Antioxidant activities of essential oils and their major components in scavenging free radicals, inhibiting lipid oxidation and reducing cellular oxidative stress. Molecules, 28(11), 4559. https://doi.org/10.3390/molecules28114559[CrossRef]
Dorantes-Iturbide G, Orzuna–Orzuna J F, Lara-Bueno A, Martínez G D M, Miranda‐Romero L A, Lee-Rangel H A (2022). Essential oils as a dietary additive for small ruminants: a meta-analysis on performance, rumen parameters, serum metabolites, and product quality. Vet. Sci., 9(9): 475-482. https://doi.org/10.3390/vetsci9090475[CrossRef]
El-Attrouny M M, Iraqi M M, Sabike II, Abdelatty A M, Moustafa M M M, Badr O A (2021). Comparative evaluation of growth performance, carcass characteristics, and time-series gene expression profile of GH and IGF-1 in two Egyptian indigenous chicken breeds versus Rhode Island Red. J. Anim. Breeding Genet., 138: 463-473. https://doi.org/10.1111/jbg.12517[CrossRef]
Faramarzidozein, R., Motamedi, E., Tarighi, S., Oskoueian, E., and Bostan, A (2024). Improving ROS and expression of SOD, APX, and CAT genes in pear seedlings inoculated with Erwinia amylovora through encapsulated bioactive compounds. Research Square (Research Square). https://doi.org/10.21203/rs.3.rs-5342311/v1[CrossRef]
Flees J J, Ganguly B, Dridi S (2020). Phytogenic feed additives improve broiler feed efficiency by modulating signalling pathways related to intermediary lipid and protein metabolism. Poult. Sci., 100(3), 100963. https://doi.org/10.1016/j.psj.2020.12.060[CrossRef]
Li J, Wu J, Yu L, Kong F, Zhang R, Sun J, Liao W, Li Z, Shi J, Wang Y, Wei Y, Zhang K, Lei Z (2022). Oregano Essential Oils Mediated Intestinal Microbiota and Metabolites and Improved Growth Performance and Intestinal Barrier Function in Sheep. Front. Immunol., 13(10):484. https://doi.org/10.3389/fimmu.2022.908015[CrossRef]
Meligy A M A, El-Hamid M I A, Yonis, A E, Elhaddad G Y, Abdel-Raheem S M, El‐Ghareeb W R, Mohamed M H A, Ismail H, Ibrahim D (2023). Liposomal-encapsulated oregano, cinnamon, and clove oils enhanced performance, antioxidant potential of bacterial metabolites, and the intestinal microbiota of broiler chickens. Poult. Sci., 102(6), 102683. https://doi.org/10.1016/j.psj.2023.102683[CrossRef]
Mousapour A, Salarmoini M, Afsharmanesh M, Ebrahimnejad H, Meimandipour A (2020). Efficacy of Savoury Essential Oil Utilisation in Conventional and Encapsulated Forms on Performance of Broiler Chickens. Braz. J. Poult. Sci., 22(4): 85-92. https://doi.org/10.1590/1806-9061-2020-1284[CrossRef]
OECD (2018). Handbook on Constructing Composite Indicators: Methodology and User Guide. OECD Publishing, Paris.
Petrilla J, Matis G, Mackei M, Kulcsar A, Sebok C, Papp M, Galfi P, Febel H, Huber K, Neogrady Z (2022). Modulation of hepatic insulin and glucagon signalling by nutritional factors in broiler chickens. Vet. Sci., 9: 103. https://doi.org/10.3390/vetsci9030103[CrossRef]
Prachumchai R, Suriyapha C, Dagaew G, Sommai S, Matra M, Phupaboon S, Phasuk Y, Wanapat M (2024). Microencapsulation of lemongrass and mangosteen peel as phytogenic compounds to gas kinetics, fermentation, degradability, methane production, and microbial population using in vitro gas technique. PLoS ONE. 19(6): https://doi.org/10.1371/journal.pone.0304282[CrossRef]
Selim A, Megahed A, Kandeel S, Alanazi A D, Almohammed H I (2021). Determination of seroprevalence of contagious caprine pleuropneumonia and associated risk factors in goats and sheep using classification and regression tree. Animals. 11: 1165. https://doi.org/10.3390/ani11041165[CrossRef]
Wang Z, Brannick E, Abasht B (2023). Integrative transcriptomic and metabolomic analyses reveal alterations in energy metabolism and mitochondrial function in broiler chickens with wooden breast. Sci. Rep., 13: 4747. https://doi.org/10.1038/s41598-023-31429-7[CrossRef]
Waniapat M, Cherdthong A, Phesatcha K, Kang S (2025). Dietary sources and their effects on animal production and environmental sustainability. Anim. Nutr., 1 (3). 96–103. https://doi.org/10.1016/j.aninu.2015.07.004[CrossRef]