Research Article · Volume 14, Issue 10, 18 September 2026 · Open Access
User Acceptance of an AI-Based Eggshell Grading System in Indonesia
· · · · · · · ·
Affiliations & Notes ⌄
1Department of Socio-Economic, Faculty of Animal Science and Technology, Universitas Brawijaya, Veteran Rd, Malang, 65145, Indonesia
2Department of Socio-Economic, Faculty of Animal Science and Technology, PSDKU, Universitas Brawijaya, Pringgodani St., Kediri, 64111, Indonesia
3Department of Computer Science, Faculty of Computer Science, Universitas Brawijaya, Veteran Rd, Malang, 65145, Indonesia
4Department of Animal Nutrition, Faculty of Animal Science and Technology, Universitas Brawijaya, Veteran Rd, Malang, 65145, Indonesia
5Department of Animal Product Technology, Faculty of Animal Science and Technology, Universitas Brawijaya, Veteran Rd, Malang, 65145, Indonesia. *Correspondence | Nanang Febrianto, Department of Socio-Economic, Faculty of Animal Science and Technology, Universitas Brawijaya, Veteran Rd, Malang, 65145, Indonesia
By contrast, the direct effects of social influence (H3), facilitating conditions (H4), and trust in AI (H6) on behavioral intention were not significant.
One possible explanation is multicollinearity, given the high correlations between facilitating conditions and both performance expectancy and self-efficacy reported in Table 5; however, this explanation should be treated as tentative pending formal collinearity diagnostics (e.g., variance inflation factors).
This study examined the user acceptance of an AI-based eggshell color classification system, the Egg Grading AI, among a predominantly young, digitally literate segment of prospective users of the Indonesian poultry egg supply chain, using an Extended UTAUT framework augmented with Self-Efficacy and Trust in AI.
The model nonetheless explained a substantial share of the variance in both behavioral intention and performance expectancy, confirming the explanatory strength of the Extended UTAUT specification in this novel application domain.
Selected from the article's own text.
Abstract
This study evaluates user acceptance of the Sistem Klasifikasi Kualitas Telur (Egg Grading AI), an AI-powered web application that classifies chicken eggs into Grade A, B, and C based on shell color in accordance with Indonesian National Standards (SNI). Drawing on and extending the Unified Theory of Acceptance and Use of Technology (UTAUT) with Self-Efficacy and Trust in AI, a cross-sectional survey was administered to 70 Indonesian respondents who completed a questionnaire after interacting with the application, and the data were analyzed using partial least squares structural equation modeling (PLS-SEM). The measurement model showed strong psychometric properties across all seven constructs (Cronbach’s alpha 0.942–0.972; composite reliability 0.959–0.980; AVE 0.854–0.923). Performance expectancy, effort expectancy, and self-efficacy significantly influenced behavioral intention. Self-efficacy also directly predicted performance expectancy, and a descriptive indirect pathway from social influence to intention through performance expectancy was observed, although formal mediation testing (Sobel and bootstrap) did not consistently support this as a robust effect; social influence, facilitating conditions, and trust in AI showed no significant direct effect on intention. The model explained a substantial share of variance in behavioral intention and performance expectancy. The findings indicate that performance expectancy, effort expectancy, and self-efficacy are the principal drivers of adoption, and that promotional strategies for AI-based egg grading in Indonesia should emphasize usability and user capability building. Because the sample was young and digitally literate, these findings should be read as an assessment of acceptance among prospective young users rather than the broader egg-supply-chain population.
Agri-food systems worldwide are undergoing rapid digital transformation, driven by the convergence of artificial intelligence (AI), computer vision, and machine learning technologies that enable automated, objective, and scalable quality control processes ; ; . In the poultry industry specifically, traditional egg grading has long depended on manual visual inspection, a process that is inherently subjective, labor-intensive, prone to human error, and poorly scalable for high-volume commercial operations ; ; . Recent studies demonstrate that AI-based classification systems employing algorithms such as Support Vector Machines, convolutional neural networks (CNN), Linear Discriminant Analysis, and YOLO-based object detection achieve high accuracy in classifying eggs by shell color and related quality attributes, with reported precision rates ranging from 90% to 97% across diverse experimental conditions ; ; ; these figures reflect performance under controlled experimental conditions rather than field deployment . Computer vision systems have further been validated as superior to traditional colorimetric instruments, such as the Minolta colorimeter, due to their higher reproducibility and closer correspondence with actual shell color under varied lighting conditions .
In Indonesia, chicken eggs represent one of the significant sources of affordable animal protein, yet quality standardization throughout the egg supply chain remains fragmented and relies primarily on informal visual inspection by individual actors . The Indonesian National Standardization Agency has established egg quality standards under the Standar Nasional Indonesia (SNI) framework, classifying chicken eggs into Grade A (dark, uniform brown shell), Grade B (medium brown), and Grade C (light or pale shell), wherein shell color serves as a primary external quality indicator correlating with the hen’s breed, nutritional status, and overall health ; .
However, awareness of the SNI classification system among key supply chain actors, particularly smallholder farmers and traditional market traders, remains limited, and manual grading practices remain inconsistent and time-consuming across the production and distribution chain. To address this gap, this study employs the Sistem Klasifikasi Kualitas Telur (Egg Grading AI), a web-based egg quality classification application built upon and adapted from the egg grading system originally developed by Ridhatullah et al. (2023). Empirical studies applying the Technology Acceptance Model (TAM) and the Theory of Planned Behavior in agricultural contexts confirm that perceived behavioral control, such as users’ belief in their ability to successfully operate a technology, is consistently among the strongest predictors of adoption intention, particularly among farmers and smallholder producers in developing countries ; . Structural barriers including high initial investment costs, limited internet connectivity, insufficient technical support, and absence of standardized evaluation criteria further constrain real-world adoption ; .
The Unified Theory of Acceptance and Use of Technology (UTAUT), developed by Venkatesh et al. (2003), provides one of the most comprehensive and validated theoretical framework for studying these determinants, explaining approximately 70% of the variance in behavioral intention, substantially outperforming TAM at approximately 30%, while accommodating the moderating roles of user characteristics such as age, experience, and organizational role ; this figure reflects the model’s original validation, and subsequent applications in different domains have often reported more modest explanatory power. Despite its strong empirical track record across agricultural technology adoption studies ; , UTAUT has not been widely applied to AI-powered food quality grading systems in any developing country context, representing a significant gap that the present study directly addresses. Although UTAUT was originally developed and validated in Western organizational settings, its core constructs (effort-outcome expectations, social influence, and enabling conditions) describe general mechanisms of technology adoption that are not inherently Western, and the framework has already been applied successfully to agricultural technology adoption in other developing-country settings, including Uganda; the present study extends this line of work to Indonesia. Beyond its academic contribution, understanding why AI-based grading tools succeed or fail to gain user acceptance matters practically, since low adoption directly limits the food-safety and quality-standardization gains that such tools are intended to deliver.
The present study pursues two specific objectives: First is to identify and measure the influence of Extended UTAUT (the base UTAUT model augmented in this study with Self-Efficacy and Trust in AI) constructs (Performance Expectancy, Effort Expectancy, Social Influence, Facilitating Conditions, and Self-Efficacy) on users’ behavioral intention to use the Egg Grading AI application; Second, to analyze Trust in AI as a construct that strengthens the effects of Performance Expectancy and Self-Efficacy on behavioral intention. These objectives are operationalized through formal hypotheses tested via a structural model using a cross-sectional survey design with a 7-point Likert scale instrument, drawing on a sample of key user groups across Indonesia’s poultry egg supply chain: poultry farmers, egg traders and sellers, and household consumers. This study makes four distinct contributions. First, it provides an empirical application of Extended UTAUT to AI-based egg quality grading technology in a developing country. Second, it introduces Trust in AI as a formally operationalized UTAUT construct in agri-food technology acceptance research. Third, it adopts a multi-stakeholder design that captures farmer, trader, and consumer perspectives, offering a more comprehensive assessment of adoption dynamics than prior single-group studies. Fourth, it situates the analysis within the Indonesian agri-food context and the SNI standardization framework, contributing evidence from a setting substantially underrepresented in the global technology acceptance literature ; .
MATERIALS AND METHODS
Description of the egg grading ai application
The technology evaluated in this study was the Egg Grading AI application (Figure 1), a web-based application developed using the Streamlit framework. The system employs a ResNet-18 convolutional neural network (CNN), a residual deep learning architecture , to classify chicken eggs into three quality grades based on shell color: Grade A (dark, uniform brown), Grade B (medium brown), and Grade C (light brown or pale), in accordance with Indonesian National Standards (SNI). This application was built upon and inspired by the work of Ridhatullah et al. (2023), with further development to suit the present study’s needs, including a redesigned user interface for improved ease of use, recalibration of the classification system, and efficiency improvements to the image processing pipeline. The base implementation by Ridhatullah et al. (2023) is an open-source code repository rather than a peer-reviewed publication; it is cited here as the origin of the underlying implementation, not as validated research evidence.
The application supports two image input methods: direct image upload (JPG, JPEG, PNG; up to 12 MB per file, a platform-defined limit rather than a recommended file size) and live camera capture via the device’s built-in camera. Upon receiving an image, the system performs inference using the pre-trained ResNet-18 model and returns the predicted egg grade alongside a confidence score. The application is accessible through any standard web browser on smartphones, tablets, or desktop computers, requiring only a stable internet connection, thereby lowering barriers to adoption across diverse user groups in Indonesia’s poultry supply chain. The choice of this application as the subject of the technology acceptance study is motivated by two key considerations. First, manual egg grading in Indonesia remains predominantly subjective and labor-intensive, creating a clear practical need for automated, standardized solutions. Second, the accessibility of the web-based deployment model, without requiring installation or specialized hardware, is intended to make it well suited to evaluating user acceptance across heterogeneous stakeholder groups, including smallholder poultry farmers, egg traders, and household consumers.
Research design
This study adopts a quantitative, cross-sectional survey design, which is widely recognized as an appropriate and efficient approach for capturing data at a single point in time from defined populations and for testing theoretically grounded models ; ; . Cross-sectional surveys are particularly well-suited for technology acceptance research because they allow the simultaneous measurement of latent constructs such as performance expectancy, social influence, and behavioral intention within a single data-collection episode . This design has been extensively employed in analogous studies, including Ahikiriza et al. (2022), who used a pre- and post-training cross-sectional survey to assess the determinants of intention to use a Farm Management Smartphone App among Ugandan dairy farmers.
The primary analytical framework is Structural Equation Modeling (SEM), which enables the simultaneous assessment of both the measurement model, through Confirmatory Factor Analysis (CFA), and the structural relationships among latent variables ; ; . The approach adopted is Partial Least Squares SEM (PLS-SEM), which is well suited to relatively small samples, models with many indicators, and research that combines measurement validation with the explanation of variance in key target constructs ; . PLS-SEM is selected over Covariance-Based SEM because the primary aim of this study is to explain and predict the variance in behavioral intention and performance expectancy within a complex model, and because PLS-SEM imposes no multivariate normality assumption and remains robust at the available sample size in this exploratory, single-point evaluation . Because the hypotheses are tested with fixed significance criteria despite a purposive, single-point sample, the results are best read as an exploratory analysis using a confirmatory framework rather than as confirmatory evidence in the strict sense.
Theoretical framework and research model
This study adapts and extends the Unified Theory of Acceptance and Use of Technology (UTAUT). The UTAUT consolidates variables from eight prior technology acceptance theories and proposes four core determinants of behavioral intention and technology use: Performance Expectancy (PE), Effort Expectancy (EE), Social Influence (SI), and Facilitating Conditions (FC). UTAUT has been demonstrated to explain approximately 70% of the variance in behavioral intention, substantially outperforming the Technology Acceptance Model, which explains approximately 30% of it .
Following the extended UTAUT approach employed by Ahikiriza et al. (2022), this study incorporates Self-Efficacy (SE) as a fifth construct, derived from Social Cognitive Theory. Self-efficacy, defined here as users’ belief in their own ability to successfully use the Egg Grading AI application, has been shown to be a critical determinant of intention to use new information management technologies, particularly in user groups with limited prior technology exposure ; . This construct is especially relevant in the present context because using the application effectively requires not only operating a smartphone or camera, but also interpreting and acting on an AI-generated classification output, a task conceptually distinct from general technology use. Additionally, and distinguishing this study from prior agricultural technology acceptance research, Trust in AI (TAI) is introduced as a sixth construct, capturing users’ confidence in the accuracy, consistency, and reliability of AI-generated classification outputs, a dimension that is uniquely relevant when end users, who lack expertise in machine learning, must rely on black-box model predictions for consequential decisions
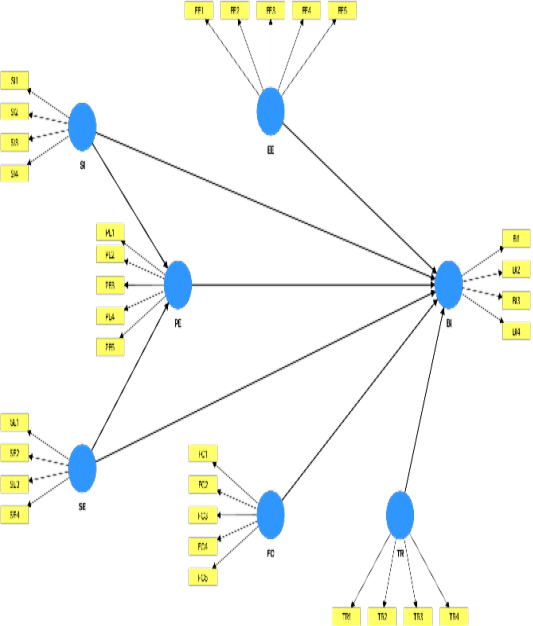
The proposed research model is formally tested through eight hypotheses summarized in Table 1. The corresponding structural (path) model, exported directly from the SmartPLS project, is shown in Figure 2. The model specification follows the path diagram structure established in Venkatesh et al. (2003) and adapted by Ahikiriza et al. (2022), with the addition of the Trust in AI construct and its relationships to both Performance Expectancy and Self-Efficacy.
Table 1: Summary of proposed hypotheses and their alignment with research objectives.
Hyp.
Proposed Path
Expected Sign
H1
Performance Expectancy → Behavioral Intention
+
H2
Effort Expectancy → Behavioral Intention
+
H3
Social Influence → Behavioral Intention
+
H4
Facilitating Conditions → Behavioral Intention
+
H5
Self-Efficacy → Behavioral Intention
+
H6
Trust in AI → Behavioral Intention
+
H7
Self-Efficacy → Performance Expectancy
+
H8
Social Influence → Performance Expectancy
+
Source: Adapted from Venkatesh et al. (2003), Ahikiriza et al. (2022), and Rana and Dwivedi (2015).
Questionnaire development and instrument adaptation
Data were collected using a structured questionnaire. The questionnaire was adapted from previously validated instruments to ensure content validity across all seven constructs ; . Items measuring PE, EE, SI, FC, and behavioral intention were adapted from , following the adaptation procedure applied by Ahikiriza et al. (2022) for agricultural contexts. Items for Self-Efficacy were adapted from Sezgin et al. (2017). Items for Trust in AI were developed based on McKnight et al. (2002) and
Choi and Ji (2015), with specific reference to AI-based classification systems. As newly developed items rather than a previously validated instrument, the Trust in AI items were not separately piloted prior to data collection, which is acknowledged as a limitation. No reverse-coded items were included in the questionnaire, a further design limitation for common-method-bias mitigation alongside the procedural remedies described in Section 2.6. All measurement items used a 7-point Likert scale, ranging from 1 (strongly disagree) to 7 (strongly agree). The choice of a 7-point scale is empirically supported by evidence demonstrating higher reliability and validity coefficients compared with shorter scales ; . The final instrument contained 31 measurement items across the seven latent constructs, as detailed in Table 2. The questionnaire items were translated into Bahasa Indonesia to match the demographic and linguistic profile of the target respondents, rather than administered in their original English wording.
Sampling strategy and target population
The target population comprises potential users of the Egg Grading AI application across three key segments of Indonesia’s poultry egg supply chain: poultry farmers who produce eggs and require grading for market differentiation (n = 20); egg traders and sellers, who grade eggs for pricing and quality assurance (n = 20); and household consumers, who make purchasing decisions based on perceived egg quality (n = 30) . This multi-stakeholder sampling approach enables a comprehensive assessment of technology acceptance dynamics across heterogeneous user groups with distinct needs, motivations, and technology exposure levels, consistent with the recommendation of Kabbiri et al. (2018). A total of 100 individuals were approached to participate, of whom 70 completed the questionnaire, yielding a response rate of 70%. The realized sample comprised 20 poultry farmers, 20 egg traders, and 30 household consumers. No data were collected on the 30 non-respondents, so non-response bias cannot be formally tested; however, given that participation required interacting with a smartphone-based application, it is plausible that non-respondents were less digitally engaged than those who completed the questionnaire, which would imply that the realized sample is, if anything, skewed toward more favorable perceptions of the technology than the originally approached pool. Respondents were recruited through purposive sampling across the three target segments; because this is a non-probability sampling method, it introduces potential selection bias, and the resulting sample cannot be assumed to be statistically representative of the broader Indonesian poultry egg supply chain. To mitigate common method variance, a known validity threat in cross-sectional, single-source survey designs ; , several procedural remedies were applied: construct items were randomized in order; respondents were assured of anonymity and the absence of right or wrong answers; and the questionnaire was divided into clearly labeled sections, consistent with the procedural remedies recommended by Podsakoff et al. (2003) . A Harman’s single-factor test was conducted by entering all 31 measurement items into an unrotated principal component analysis. The first (unrotated) factor accounted for 73.65% of the total variance (73.46% under a principal-axis-factoring cross-check), well above the 50% threshold conventionally used to judge common method variance as unlikely to be a serious concern. This result indicates that common method variance cannot be ruled out as a contributor to the high inter-construct correlations reported in Sections 3.3 and 3.4, and it should be read together with the discriminant-validity and collinearity limitations already noted there; the procedural remedies described above reduce, but evidently do not eliminate, this risk.
Statistical analysis
Data were analyzed using a two-stage SEM approach ; . Descriptive statistics (mean, standard deviation, frequencies, and percentages) were computed to characterize the respondent sample. In the first stage, the measurement model was evaluated to assess the psychometric properties of each construct. Internal consistency reliability was assessed using both Cronbach’s Alpha (above 0.70) and Composite
Table 2: Measurement items, construct assignments, and original sources.
Construct
Code
Indicator / Item
Performance Expectancy (PE)
PE1
This application helps me classify egg quality (Grade A, B, C) faster than manual grading.
PE2
This application improves the accuracy of my egg grading process.
PE3
Using this application makes egg grading more efficient overall.
PE4
This application is useful in determining egg quality based on shell color.
PE5
Using this application reduces errors in the egg grading process.
Effort Expectancy (EE)
EE1
The interface of this application is easy to understand and use.
EE2
I believe I can easily learn how to use this application.
EE3
Uploading an egg image and obtaining the classification result requires minimal effort.
EE4
The camera feature in this application is easy to use for capturing egg images.
EE5
Overall, I find this application user-friendly.
Social Influence (SI)
SI1
My colleagues or peers suggest that I use an AI-based egg grading application.
SI2
People who are important to me think I should use this application.
SI3
I am motivated to use this application because many people around me also use it.
SI4
The use of AI technology for egg grading is viewed positively in my environment.
Facilitating Conditions (FC)
FC1
I have an adequate device (smartphone or computer) to run this application.
FC2
I have sufficient internet access to use this web-based application.
FC3
I have the knowledge and skills necessary to operate this application.
FC4
Assistance is available (guides, tutorials, or technical support) if I encounter difficulties.
FC5
This application is compatible with the device I use daily.
Self-Efficacy (SE)
SE1
I am confident I can use this application without assistance from others.
SE2
Given a guide or tutorial, I am able to operate this application well.
SE3
I believe I can correctly interpret the classification results (Grade A, B, C).
SE4
I feel capable of handling minor technical issues that may arise.
Trust in AI (TAI)
TAI1
I trust that the egg quality classification results produced are accurate.
TAI2
I am confident the ResNet-18 AI model can differentiate egg quality by shell color.
TAI3
I feel comfortable relying on the results of this application for grading decisions.
TAI4
This application produces consistent results for the same shell color.
Behavioral Intention (BI)
BI1
I plan to use this application to assist with egg grading in the future.
BI2
I will recommend this application to colleagues or partners in the sector.
BI3
This application will become my preferred grading method over manual grading.
BI4
I intend to use this application regularly in my egg grading activities.
Note: All items were measured on a 7-point Likert scale (1 = strongly disagree, 7 = strongly agree).
Reliability (above 0.70). Convergent validity was and assessed through Average Variance Extracted (above 0.50) and standardized factor loadings (above 0.70) . Discriminant validity was evaluated using both the Fornell-Larcker criterion, in which the square root of each construct’s AVE should exceed its correlations with all other constructs, and the Heterotrait-Monotrait ratio, with a threshold below 0.85 ; .
In the second stage, the structural model was evaluated to test the proposed hypotheses. Path coefficients (standardized beta), standard errors, and significance levels were reported for each hypothesized path. Consistent with PLS-SEM practice, the significance of path coefficients was assessed through bootstrapping, and the explanatory power of the model was evaluated using the coefficient of determination for the endogenous constructs, complemented by the Standardized Root Mean Square Residual as an approximate measure of overall model fit ; .
RESULTS AND DISCUSSION
Respondent characteristics
Most respondents were young adults; the mean age was 22.97 years (range 18 to 30). Most were female (57.14%) and held a senior-high-school qualification (81.43%). All respondents owned a smartphone, and the great majority had over six years of smartphone experience (91.43%) and used their devices very frequently (57.14% for more than five hours per day). These characteristics indicate a sample with high smartphone ownership and frequent device use (Table 3); while suggestive of digital comfort, ownership and usage frequency alone do not establish digital literacy in the sense of an ability to interpret and act on the application’s AI-generated outputs. With respect to egg-related behavior, shell cleanliness and shell color were the most frequently mentioned purchase criteria (28.57% each), and Grade A was the most frequently preferred grade (72.86%). A total of 100 individuals were approached, of whom 70 completed the survey (response rate = 70%), consistent with the figure reported in Section 2.5.
Descriptive statistics, internal consistency, and factor loadings
All constructs recorded high mean scores on the seven-point scale, ranging from 5.24 (Social Influence) to 5.70 (Performance Expectancy and Facilitating Conditions), indicating broadly favorable perceptions of the application, though these uniformly high scores could also partly reflect social desirability or an extreme-response tendency rather than purely positive attitudes. Internal consistency was excellent across all constructs, with Cronbach’s alpha values between 0.942 and 0.972, comfortably exceeding the conventional 0.70 threshold ; values this high are also consistent with item redundancy and are noted here as a measurement limitation and a candidate for item reduction in future instrument refinement. Every item loaded strongly on its intended construct (loadings above 0.89), confirming the convergent contribution of each indicator. Table 4 reports the construct-level means, standard deviations, factor loading ranges, and Cronbach’s alpha values.
Table 3: Selected socio-demographic characteristics of the respondents (n = 70).
Variable
Frequency
Percent (%)
Age: 18–20 years
13
18.57
Age: 21–22 years
35
50.00
Age: 23 or older
22
31.43
Gender: Female
40
57.14
Gender: Male
30
42.86
Education: Senior high / vocational
57
81.43
Education: Bachelor's degree
13
18.57
Smartphone ownership: Yes
70
100.00
Smartphone experience: > 6 years
64
91.43
Smartphone experience: < 6 years
6
08.57
Daily use: > 5 h/day
40
57.14
Internet access: Always stable
42
60.00
Main factor: Shell cleanliness
20
28.57
Main factor: Shell color
20
28.57
Main factor: Price
16
22.86
Grade usually chosen: Grade A
51
72.86
Grade usually chosen: Grade B
13
18.57
Manual grading: Occasionally
42
60.00
Manual grading: Frequently (trader/farmer)
22
31.43
Note: Percentages are computed relative to the total sample (n = 70). For age, the mean was 22.97 years (SD = 0.92; min = 18; max = 30). All respondents owned a smartphone (100%).
Reliability and construct validity of the measurement model
Composite reliability ranged from 0.959 to 0.980 and the average variance extracted from 0.854 to 0.923, both well above the recommended minima of 0.70 and 0.50, respectively, thereby confirming construct reliability. Discriminant validity, however, warrants caution: several inter-construct correlations were elevated, most notably PE with FC (0.898), FC with SE (0.891), and SI with FC (0.874), and approached the square root of the AVE on the diagonal. Such strong associations are common among the closely related UTAUT constructs and are accentuated by the modest sample size, suggesting that discriminant validity should be re-examined using the more stringent HTMT criterion in future work. Table 5 reports the composite reliability, average variance extracted, and inter-construct correlations. The actual HTMT ratios for these construct pairs are FC–PE = 0.929, FC–SE = 0.934, and FC–SI = 0.908, all of which exceed even the more lenient 0.90 threshold, not only the conservative 0.85 threshold. The full HTMT matrix (Table 6) ranges from 0.713 (EE–SI) to 0.934 (FC–SE), with most pairs falling between 0.76 and 0.88. Discriminant validity between Facilitating Conditions and the other constructs, particularly Self-Efficacy and Social Influence, could therefore not be established at the HTMT level with the present data. This is reported here as a limitation affecting interpretation of the FC-related structural paths.
Table 4: Construct-level means, standard deviations, factor loadings, and internal consistency (n = 70).
Construct
Mean
SD
Factor loading range
Cronbach's α
Performance Expectancy (PE)
5.70
1.54
0.892–0.948
0.957
Effort Expectancy (EE)
5.57
1.61
0.922–0.955
0.966
Social Influence (SI)
5.24
1.50
0.914–0.960
0.950
Facilitating Conditions (FC)
5.71
1.58
0.926–0.957
0.972
Self-Efficacy (SE)
5.64
1.56
0.894–0.958
0.942
Behavioral Intention (BI)
5.33
1.72
0.899–0.958
0.954
Trust in AI (TR)
5.35
1.47
0.959–0.963
0.972
Note: Seven-point Likert scale (1 = strongly disagree; 7 = strongly agree). All factor loadings exceeded 0.70, and all Cronbach’s alpha values exceeded 0.70, indicating acceptable reliability .
Results of the path analysis
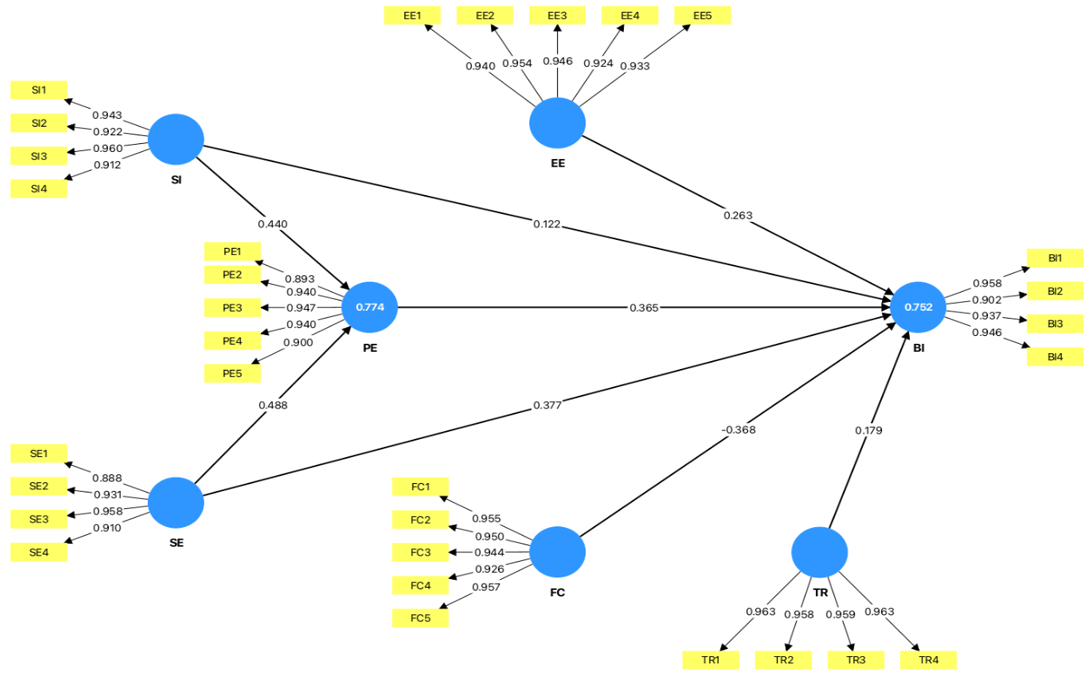
Figure 3 presents the estimated structural model with standardized path coefficients, outer loadings, and R²
values overlaid on the model diagram. Of the eight estimated structural relationships, five were supported and three (H3, H4, H6) were not — a substantive rather than incidental result of this study. Performance expectancy (H1, beta = +0.360), effort expectancy (H2, beta = +0.286), and self-efficacy (H5, beta = +0.348) were each significantly and positively associated with behavioral intention (p < 0.05), whereas self-efficacy (H7) and social influence (H8) were both strong positive determinants of performance expectancy (p < 0.001). By contrast, the direct effects of social influence (H3), facilitating conditions (H4), and trust in AI (H6) on behavioral intention were not significant. Notably, social influence did not directly shape intention; a descriptive indirect pathway through performance expectancy was observed, though, as reported below, formal testing does not robustly support this as a confirmed mediation effect, in contrast to some previous UTAUT findings that reported a clearer mediation pattern. A formal test of this indirect pathway was conducted using the exported latent variable scores (n = 70), replicating the structural model’s regression weights (PE regressed on SI and SE; BI regressed on PE, EE, FC, SE, SI, and TR), which reproduced SmartPLS’s specific indirect effect estimate exactly (a × b = 0.160, matching a = 0.440 for SI→PE and b = 0.365 for PE→BI). A Sobel test indicated marginal significance (z = 2.028, p = .043), but a case-resampling bootstrap with 5,000 resamples — the method generally preferred for PLS-SEM mediation testing, particularly at this sample size — produced a wider 95% percentile confidence interval that included zero (SE = 0.122; 95% CI [-0.026, 0.437]). Because the two methods disagree and the more robust bootstrap procedure does not exclude zero, we treat the evidence for this indirect pathway as suggestive rather than confirmed, and we no longer characterize it as an established mediation effect elsewhere in this manuscript. The model accounted for a substantial share of the variance, with an R-squared of 0.752 for behavioral intention and 0.774 for performance expectancy.
The negative coefficient observed for facilitating conditions on behavioral intention (beta = -0.333) was unexpected and runs counter to the original UTAUT specification. One possible explanation is multicollinearity, given the high correlations between facilitating conditions and both performance expectancy and self-efficacy reported in Table 5; however, this explanation should be treated as tentative pending formal collinearity diagnostics (e.g., variance inflation factors). This reinforces the earlier observation that these constructs overlap substantially in the present sample. Table 7 summarizes the path coefficients, significance levels, and hypothesis conclusions. The SRMR was 0.055 for the estimated model (0.043 for the saturated model), both below the conventional 0.08 cutoff, indicating acceptable model fit; the NFI was 0.729. Path-coefficient significance was assessed via bootstrapping with 5,000 subsamples, a two-tailed test, and a significance level of 0.05, consistent with the p-values and significance conclusions reported for H1–H8 in Table 7.
Regarding whether multicollinearity undermines confidence in the significant path coefficients (H1, H2, H5, H7, H8), the VIF diagnostics reported in Table 6 indicate that collinearity concerns are not uniform across the model: the FC→BI path shows a serious collinearity problem, with a VIF of 10.366 that is more than double the conventional threshold of 5 — by contrast, PE→BI and SE→BI are moderately elevated (VIF = 6.587 and 6.300, respectively) but remain below the more lenient threshold of 10, and EE→BI, TR→BI, SE→PE, and SI→PE all fall within the conventionally acceptable range (VIF = 2.764–4.904). This pattern indicates that collinearity is concentrated in the paths originating from the most strongly inter-correlated constructs (FC, PE, SE), and that these specific coefficients, particularly the negative FC→BI path, should be interpreted with more caution than the other supported paths, rather than treating the model’s significant findings as uniformly unreliable
Discussion of findings
The pattern of supported hypotheses point toward a consistent interpretation: behavioral intention to use the Egg Grading AI application is driven primarily by users’ perceptions of usefulness and ease of use and by their confidence in their own ability to operate the system. The significant positive effect of performance expectancy on intention (H1) confirms that respondents who expect the application to make grading faster, more accurate, and more efficient are more inclined to adopt it, in line with the original UTAUT specification of Venkatesh et al. (2003) and the agricultural application of Ahikiriza et al. (2022). The significant effect of effort expectancy (H2) underscores that perceived ease of use remains a decisive adoption driver, reinforcing the view that AI-based grading tools should be designed to be as user-friendly as possible to sustain intention to use. Beyond confirming these expected directions, the pattern also suggests a practical ordering: because performance expectancy shows the larger effect of the two, communicating concrete efficiency and accuracy gains to prospective users may do more to build adoption intention than interface simplification alone, though both remain necessary.
Self-efficacy played a central role in the model, showing both a direct association with behavioral intention (H5) and a strong effect on performance expectancy (H7). This dual influence is consistent with Bandura’s (1977) Social Cognitive Theory and with prior evidence that
Table 5: Reliability and construct validity of the measurement model (n = 70).
Construct
PE
EE
SI
FC
SE
BI
TR
CR
AVE
PE
0.927
0.968
0.859
EE
0.809
0.940
0.974
0.883
SI
0.832
0.683
0.935
0.965
0.874
FC
0.898
0.830
0.874
0.948
0.978
0.899
SE
0.836
0.844
0.795
0.891
0.924
0.959
0.854
BI
0.820
0.798
0.731
0.779
0.812
0.938
0.967
0.879
TR
0.846
0.748
0.791
0.839
0.753
0.757
0.961
0.980
0.923
Note: Diagonal values (bold) are the square root of the AVE; off-diagonal (lower-triangle) values are inter-construct correlations. CR = composite reliability; AVE = average variance extracted. Discriminant validity per Fornell and Larcker (1981) holds when the diagonal exceeds the corresponding off-diagonal correlations.
Table 6: Heterotrait-Monotrait Ratio (HTMT) matrix for discriminant validity (n = 70).
Construct
PE
EE
SI
FC
SE
BI
TR
PE
EE
0.840
SI
0.869
0.713
FC
0.929
0.858
0.908
SE
0.881
0.886
0.842
0.934
BI
0.855
0.821
0.762
0.802
0.852
TR
0.876
0.767
0.819
0.859
0.787
0.787
Note: Values are Heterotrait-Monotrait ratios; a value below 0.90 (liberal) or 0.85 (conservative) is generally taken as evidence of discriminant validity. FC-PE (0.929), FC-SE (0.934), and FC-SI (0.908) all exceed the liberal 0.90 threshold, indicating discriminant validity between Facilitating Conditions and these constructs was not established with the present data. Source: Data Premier.
Table 7: Results from the path analysis used to test the proposed research model (n = 70).
Hypothesis
Path
Path coefficient (β)
p-value
Conclusion
VIF
H1
PE → BI
+0.360
0.030*
Supported
6.587
H2
EE → BI
+0.286
0.034*
Supported
4.455
H3
SI → BI
+0.128
0.361
Not supported
4.904
H4
FC → BI
-0.333
0.105
Not supported
10.366
H5
SE → BI
+0.348
0.028*
Supported
6.300
H6
TR → BI
+0.155
0.231
Not supported
4.104
H7
SE → PE
+0.475
0.000***
Supported
2.764
H8
SI → PE
+0.454
0.000***
Supported
2.764
Note: β = standardized path coefficient. * p < 0.05; ** p < 0.01; *** p < 0.001. A hypothesis is supported when p < 0.05. Coefficients of determination: R-squared (behavioral intention) = 0.752 and R-squared (performance expectancy) = 0.774. VIF = variance inflation factor (collinearity diagnostic for each predictor). FC → BI shows a notably high VIF (10.366), exceeding the conventional threshold of 5 (and approaching 10), indicating serious multicollinearity that plausibly explains the counter-intuitive negative coefficient for this path. Model fit: SRMR = 0.055 (estimated model), NFI = 0.729. Path-coefficient significance (Table 6) was assessed via bootstrapping with 5,000 subsamples, a two-tailed test, and a significance level of 0.05.
self-efficacy is a critical determinant of intention to use new information management technologies, particularly among users with limited prior exposure ; . The strong path from social influence on performance expectancy (H8), coupled with the non-significant direct path from social influence on intention (H3), is descriptively consistent with the social environment shaping adoption by raising users’ expectations of the application’s usefulness rather than by directly compelling intention, a pattern documented in earlier UTAUT research; however, as reported in Section 3.4, formal mediation testing of this SI→PE→BI pathway did not robustly confirm the indirect effect (bootstrap 95% CI included zero), so this interpretation should betreated as tentative rather than established. The centrality of self-efficacy observed here echoes findings from other developing-country technology-adoption studies, including agricultural applications in Uganda, where users’ confidence in their own ability to operate a new digital tool was similarly found to be a stronger driver of adoption than the tool’s features alone — suggesting that capability-building support may matter as much as system design in these settings.
The non-significant and negative coefficient for facilitating conditions (H4) and the non-significant effect of trust in AI (H6) should be interpreted cautiously. As noted above, the high inter-construct correlations and the modest sample size of 70 respondents render the structural estimates susceptible to multicollinearity, which can suppress or invert individual coefficients even when the underlying constructs are theoretically and empirically relevant. The digitally literate composition of the sample, in which all respondents owned smartphones and the majority reported stable internet access and extensive device experience, may also have compressed variance in facilitating conditions, limiting its explanatory power in this particular setting. These results align with the broader literature recognizing trust in AI as a pivotal yet context-dependent predictor of acceptance ; and do not negate its theoretical importance; rather, they highlight the need for re-estimation with a larger and more heterogeneous sample. For AI system design, a non-significant Trust in AI effect in this sample suggests that, at this early stage of adoption, prospective users may weigh whether a tool is useful and easy to operate more heavily than whether they trust its underlying AI judgment; if this pattern holds in future work, it would imply that usability investment may yield more adoption benefit than trust-building features alone, at least until the technology is more familiar to this user population.
Taken together, the findings address the study’s objectives by identifying performance expectancy, effort expectancy, and self-efficacy as the principal drivers of behavioral intention, and by clarifying the indirect, expectancy-mediated role of social influence. The full operationalization of trust in AI remains to be confirmed in subsequent work with adequate statistical power. From a practical standpoint, the results suggest that promotional and deployment strategies for AI-based egg grading in Indonesia should prioritize usability and the cultivation of user confidence, complementing the demonstrated technical maturity of the underlying ResNet-18 model with attention to the human and behavioral conditions that govern real-world adoption.
CONCLUSION
This study examined the user acceptance of an AI-based eggshell color classification system, the Egg Grading AI, among a predominantly young, digitally literate segment of prospective users of the Indonesian poultry egg supply chain, using an Extended UTAUT framework augmented with Self-Efficacy and Trust in AI. Drawing on a survey of 70 respondents and a two-stage measurement and structural analysis, the study established that all seven reflective constructs possessed excellent internal consistency, composite reliability, and convergent validity, providing a sound psychometric basis for the model despite the modest sample size.
The structural results show that behavioral intention to adopt the application is principally determined by performance expectancy, effort expectancy, and self-efficacy, while social influence did not directly shape intention; a descriptive indirect pathway through performance expectancy was observed but was not robustly confirmed by formal mediation testing (Section 3.4). The direct effects of facilitating conditions and trust in AI on intention were not significant in this sample, an outcome that may reflect multicollinearity among the closely related constructs and the digitally literate, low-variance profile of the respondents, though this explanation remains tentative pending formal collinearity diagnostics, and does not by itself rule out the theoretical relevance of these constructs. The model nonetheless explained a substantial share of the variance in both behavioral intention and performance expectancy, confirming the explanatory strength of the Extended UTAUT specification in this novel application domain.
Practically, the findings indicate that the adoption of AI-based egg grading in Indonesia depends less on the technical accuracy of the underlying ResNet-18 model, which prior work has already established, than on whether intended users perceive the system as useful and easy to operate and feel capable of using it themselves. This practical implication is consistent with, rather than distinct from, decades of TAM and UTAUT research showing that perceived usefulness and ease of use are primary adoption drivers; the contribution here lies in confirming this pattern for AI-based grading specifically, not in identifying a new mechanism. Deployment
Several limitations should be considered when interpreting these conclusions. Although the sample of 70 respondents satisfied both the ten-times rule and the G*Power benchmark for PLS-SEM. Post-hoc achieved power at α = 0.05, computed from the observed path coefficients and sample size, was uneven across paths: high for SE→PE (99.3%), SI→PE (97.9%), SE→BI (93.4%), FC→BI (92.4%), and PE→BI (92.0%), but low for the three non-significant paths — EE→BI (71.1%), TR→BI (44.3%), and especially SI→BI (26.6%), which is markedly underpowered to detect an effect of the size observed. This uneven power profile indicates that the non-significant findings for TR→BI and, in particular, SI→BI cannot be confidently interpreted as true null effects, as the study may simply lack the power to detect them. The overall sample size itself remains modest, and a larger sample would yield more stable estimates; the respondents were also predominantly young and digitally literate, rather than a balanced mix of farmers, traders, and consumers, which limits the generalizability of the findings to that early-adopter segment; and the high inter-construct correlations constrained discriminant validity and the stability of individual path estimates. Future research should re-estimate the model with a larger and more heterogeneous multi-stakeholder sample, apply the stricter HTMT criterion for discriminant validity, examine whether age, smartphone experience, and user role moderate these relationships, and operationalize trust in AI more rigorously to confirm its hypothesized relationships with performance expectancy and self-efficacy. Such work would consolidate the present preliminary evidence into a validated account of AI food quality grading acceptance in developing country agri-food chains. The present study is also purely quantitative; it does not capture, in respondents’ own words, which specific aspects of performance expectancy, effort expectancy, or self-efficacy were most salient to their acceptance decisions. A mixed-methods follow-up incorporating open-ended questions or semi-structured interviews would help explain the mechanisms behind the quantitative patterns reported here and strengthen the practical recommendations that can be drawn from them.
ACKNOWLEDGMENTS
The authors thank the respondents who participated in this study and to Universitas Brawijaya that supported this study. The authors also acknowledge the developer of the Egg Grading AI application for making the system available for evaluation, and the research assistants who supported data collection. The authors are especially grateful to Ridhatullah et al. (2023), whose work served as the primary inspiration for this research, which was undertaken purely for the purpose of system development and academic enrichment. Finally, the authors sincerely thank the reviewers and editors for their constructive feedback, which greatly improved the quality of this article.
NOVELTY STATEMENT
This study provides the first empirical application of an Extended Unified Theory of Acceptance and Use of Technology (UTAUT) framework to an AI-based eggshell color classification system within a developing country agri-food chain. The novel contributions include: (1) the introduction of Trust in AI as a formally operationalized construct alongside Self-Efficacy within the UTAUT model for agri-food technology acceptance research; (2) a multi-stakeholder design that simultaneously considers the perspectives of poultry farmers, egg traders, and household consumers rather than focusing on a single user group ; (3) the integration of a ResNet-18 deep learning model with the Indonesian National Standards (SNI) shell color grading scheme as the technological object of acceptance; and (4) empirical evidence that behavioral intention to adopt the system is driven primarily by performance expectancy, effort expectancy, and self-efficacy, with a descriptive, not formally confirmed, indirect pathway from social influence through performance expectancy. This research addresses an unexplored intersection of food technology, information systems, and behavioral acceptance theory in a setting that remains substantially underrepresented in the global technology acceptance literature.
AUTHOR’S CONTRIBUTION
Conceptualization: MH, NF. Methodology: MH, NF. Software: MH, M. Validation: HE, MHN. Formal analysis: AEK, MH. Investigation: MH, HE. Resources: M, MHN. Data curation: MH. Writing – original draft: MH. Writing – review and editing: MH, BH. Visualization: NF, AEK. Supervision: BH, SA, M. Project administration: NF. Funding acquisition: NF, AEK, BH. All authors have read and agreed to the published version of the manuscript.
Funding
This research was supported by Universitas Brawijaya, Indonesia, under Doktor Lektor Kepala Research Program with the contract number of 1027.1/UN10.F05/PN/2025.
Generative AI and AI-assisted technology statement
The authors take full responsibility for the content of this publication. The scientific concepts, methodological design, data collection, analysis, and interpretation were developed and executed entirely by the human authors. No generative AI tools were used for: data generation, statistical analysis, result interpretation, or formulation of scientific conclusions. It should be noted that the AI-based egg classification system that was evaluated in this study is the research object, not a tool used in manuscript preparation.
Data availability statement
The datasets generated and analyzed during the current study are available from the corresponding author upon reasonable request. The data are not publicly deposited in order to protect the anonymity of the survey respondents in accordance with the informed consent provided.
Conflict of interest
The authors have declared no conflict of interest.
Figures
Figure 1:.
The egg grading ai application interface
Figure 2:.
Structural (Path) model of the extended UTAUT framework used in this study.
Figure 3:.
Estimated structural model with standardized path coefficients, outer loadings, and R² Values.
References
Agrawal K, Goktas P, Holtkemper M, Beecks C, Kumar N (2025). AI-driven transformation in food manufacturing: a pathway to sustainable efficiency and quality assurance. Front. Nutr., 12(2025): 1-15. https://doi.org/10.3389/fnut.2025.1553942[CrossRef]
Ahikiriza E, Wesana J, Van Huylenbroeck G, Kabbiri R, De Steur H, Lauwers L, Gellynck X (2022). Farmer knowledge and the intention to use smartphone-based information management technologies in Uganda. Comput. Electron. Agric., 202(2022): 107413. https://doi.org/10.1016/j.compag.2022.107413[CrossRef]
Bandura A (1977). Self-efficacy: Toward a unifying theory of behavioral change. Psychol. Rev., 84(2): 191-215. https://doi.org/10.1037/0033-295X.84.2.191[CrossRef]
Cengel T, Gencturk B, Yasin E, Yildiz M, Cinar I, Koklu M (2025). Automating egg damage detection for improved quality control in the food industry using deep learning. J. Food Sci., 90(1): e17553. https://doi.org/10.1111/1750-3841.17553[CrossRef]
Cheung G, Cooper-Thomas H, Lau R, Wang L (2023). Reporting reliability, convergent and discriminant validity with structural equation modeling: A review and best-practice recommendations. Asia Pac. J. Manag., 41(2024): 745-783. https://doi.org/10.1080/10705511.2023.2183860[CrossRef]
Choi JK, Ji YG (2015). Investigating the importance of trust on adopting an autonomous vehicle. Int. J. Hum. Comput. Interact., 31(10): 692-702. https://doi.org/10.1080/10447318.2015.1070549[CrossRef]
Chua PY, Rezaei S, Gu ML, Oh YM, Jambulingam M (2018). Elucidating social networking apps decisions: Performance expectancy, effort expectancy and social influence. Nankai Bus. Rev. Int., 9(2): 118-142. https://doi.org/10.1108/NBRI-01-2017-0003[CrossRef]
Dash G, Paul J (2021). CB-SEM vs PLS-SEM methods for research in social sciences and technology forecasting. Technol. Forecast. Soc. Change, 173(2021): 121092. https://doi.org/10.1016/j.techfore.2021.121092[CrossRef]
Dora M, Kumar A, Mangla S, Pant A, Kamal M (2021). Critical success factors influencing artificial intelligence adoption in food supply chains. Int. J. Prod. Res., 60(40): 4621-4640. https://doi.org/10.1080/00207543.2021.1959665[CrossRef]
Dzin N, Lay Y (2021). Validity and reliability of adapted self-efficacy scales in Malaysian context using PLS-SEM approach. Educ. Sci., 11(11): 676. https://doi.org/10.3390/educsci11110676[CrossRef]
Falk CF, Savalei V (2011). The relationship between unstandardized and standardized alpha, true reliability, and the underlying measurement model. J. Pers. Assess., 93(5): 445-453. https://doi.org/10.1080/00223891.2011.594129[CrossRef]
Fornell C, Larcker DF (1981). Evaluating structural equation models with unobservable variables and measurement error. J. Mark. Res., 18(1): 39-50. https://doi.org/10.2307/3150980[CrossRef]
Hair J, Alamer A (2022). Partial least squares structural equation modeling (PLS-SEM) in second language and education research: Guidelines using an applied example. Res. Methods Appl. Linguist., 1(3): 100027. https://doi.org/10.1016/j.rmal.2022.100027[CrossRef]
He K, Zhang X, Ren S, Sun J (2016). Deep residual learning for image recognition. Proceedings of the IEEE Conference on Computer Vision and Pattern Recognition (CVPR), 770-778. https://doi.org/10.1109/CVPR.2016.90[CrossRef]
Henseler J, Ringle CM, Sarstedt M (2015). A new criterion for assessing discriminant validity in variance-based structural equation modeling. J. Acad. Mark. Sci., 43(1): 115-135. https://doi.org/10.1007/s11747-014-0403-8[CrossRef]
Holden H, Rada R (2011). Understanding the influence of perceived usability and technology self-efficacy on teachers’ technology acceptance. J. Res. Technol. Educ., 43(4): 343-367. https://doi.org/10.1080/15391523.2011.10782576[CrossRef]
Ismatullaev U, Kim S (2022). Review of the factors affecting acceptance of AI-infused systems. Hum. Factors, 66(1): 126-144. https://doi.org/10.1177/00187208211064707[CrossRef]
Júnior SLdC, Cândido AECM, Silva ACdS, Silva IJOd (2025). Translucency of chicken eggs: proposal of an automated system for analysis and classification. Poult. Sci., 104(2025): 105612. https://doi.org/10.1016/j.psj.2025.105612[CrossRef]
Kabbiri R, Dora M, Kumar V, Elepu G, Gellynck X (2018). Mobile phone adoption in agri-food sector: Are farmers in Sub-Saharan Africa connected? Technol. Forecast. Soc. Change, 131(2018): 253-261. https://doi.org/10.1016/j.techfore.2017.12.010[CrossRef]
Kelly S, Kaye S, Oviedo-Trespalacios O (2022). What factors contribute to the acceptance of artificial intelligence? A systematic review. Telemat. Inform., 77(2023): 101925. https://doi.org/10.1016/j.tele.2022.101925[CrossRef]
Kusmaryono I, Wijayanti D, Maharani HR (2022). Number of response options, reliability, validity, and potential bias in the use of the Likert scale education and social science research: A literature review. Int. J. Educ. Methodol., 8(4): 625-637. https://doi.org/10.12973/ijem.8.4.625[CrossRef]
Landmann D, Lagerkvist CJ, Otter V (2021). Determinants of small-scale farmers’ intention to use smartphones for generating agricultural knowledge in developing countries: Evidence from rural India. Eur. J. Dev. Res., 33(6): 1435-1454. https://doi.org/10.1057/s41287-020-00284-x[CrossRef]
Leong WY, Leong YZ, Leong WS (2024). Artificial Intelligence to Improve Egg Color, Quality, and Production Efficiency. 2024 IEEE 4th International Conference on Electronic Communications, Internet of Things and Big Data (ICEIB), 1(1): 278-281. https://doi.org/10.1109/ICEIB61477.2024.10602695[CrossRef]
Lim W (2024). What is quantitative research? An overview and guidelines. Australas. Mark. J., 33(3): 325-348. https://doi.org/10.1177/14413582241264622[CrossRef]
Malik MAA, Mustapha MF, Mohamad Sobri N, Abd Razak NF, Mohd Zaidi MN, Shukri AA, Zalimie Sham MAL (2021). Optimal reliability and validity of measurement model in confirmatory factor analysis: Different Likert point scale experiment. J. Contemp. Issues Thought, 11(1): 105-112. https://doi.org/10.37134/jcit.vol11.9.2021[CrossRef]
Mavani N, Ali J, Othman S, Hussain M, Hashim H, Rahman N (2021). Application of artificial intelligence in food industry: a guideline. Food Eng. Rev., 14(2022): 134-175. https://doi.org/10.1007/s12393-021-09290-z[CrossRef]
McKnight DH, Choudhury V, Kacmar C (2002). Developing and validating trust measures for e-commerce: An integrative typology. Inf. Syst. Res., 13(3): 334-359. https://doi.org/10.1287/isre.13.3.334.81[CrossRef]
Milovanovic B, Tomovic V, Djekic I, Solowiej B, Lorenzo J, Barba F, Tomasevic I (2021). Color assessment of the eggs using computer vision system and Minolta colorimeter. J. Food Meas. Charact., 15(5097-5112. https://doi.org/10.1007/s11694-021-01085-4[CrossRef]
Mohr S, Kuhl R (2021). Acceptance of artificial intelligence in German agriculture: An application of the technology acceptance model and the theory of planned behavior. Precis. Agric., 22(2021): 1816-1844. https://doi.org/10.1007/s11119-021-09814-x[CrossRef]
Nunnally JC, Bernstein IH (1994). Psychometric Theory, 3rd ed. McGraw-Hill, New York, USA. https://doi.org/10.1007/BF02301419[CrossRef]
Oamen T, Lawal B (2023). Exploring and validating performance measurement domains of community pharmacists using structural equation modeling: Implications and recommendations for research. J. Sci. Res. Rep., 29(11): 38-47. https://doi.org/10.9734/jsrr/2023/v29i11726[CrossRef]
Panahi S, Bazrafshani A, Mirzaie A (2023). Development and validation of a modified LibQUAL scale in health sciences libraries: Application of structural equation modeling. J. Med. Libr. Assoc., 111(4): 792-801. https://doi.org/10.5195/jmla.2023.1348[CrossRef]
Park C (2023). Implementing alternative estimation methods to test the construct validity of Likert-scale instruments. Korean J. Women Health Nurs., 29(85-90. https://www.e-whn.org/upload/pdf/kjwhn-2023-06-14-2.pdf https://doi.org/10.4069/kjwhn.2023.06.14.2[CrossRef]
Perdanasari L, Etikasari B, Ayuninghemi R, Widianta M, Utomo B (2025). Feature extraction of digital image processing for optimization chicken egg quality classification. 7th International Conference on Food and Agriculture (ICoFA 2024), 1446(2025): 1-13. https://doi.org/10.1088/1755-1315/1446/1/012062[CrossRef]
Podsakoff PM, MacKenzie SB, Lee JY, Podsakoff NP (2003). Common method biases in behavioral research: A critical review of the literature and recommended remedies. J. Appl. Psychol., 88(5): 879-903. https://doi.org/10.1037/0021-9010.88.5.879[CrossRef]
Rabethge N, Bentler D (2023). Measuring the impact of picture-based explanations on the acceptance of an AI system for classifying laundry. Artificial Intelligence, Social Computing and Wearable Technologies, 113(2023): 77–87. https://doi.org/10.54941/ahfe1004181[CrossRef]
Rahman M, Dhira T, Sarker A, Mehareen J (2022). Validity and reliability of the Patient Health Questionnaire scale (PHQ-9) among university students of Bangladesh. PLOS ONE, 17(6): 1-18. https://doi.org/10.1371/journal.pone.0269634[CrossRef]
Rana NP, Dwivedi YK (2015). Citizen’s adoption of an e-government system: Validating extended social cognitive theory (SCT). Gov. Inf. Q., 32(2): 172-181. https://doi.org/10.1016/j.giq.2015.02.002[CrossRef]
Ridhatullah AF, Ernawati P, Ivander MA, Putri YN, Fathia RA, Khafizh K, Rika S (2023). Egg grading quality classification based on its external property (shell color) using ResNet-18. https://github.com/putrinahampun/final-project-scAI5
Rindfleisch A, Malter A, Ganesan S, Moorman C (2008). Cross-sectional versus longitudinal survey research: Concepts, findings, and guidelines. J. Mark. Res., 45(3): 261-279. https://doi.org/10.1509/jmkr.45.3.261[CrossRef]
Sezgin E, Ozkan-Yildirim S, Yildirim S (2017). Investigation of physicians’ awareness and use of mHealth apps: A mixed method study. Health Policy Technol., 6(3): 251-267. https://doi.org/10.1016/j.hlpt.2017.07.007[CrossRef]
Spector P (2019). Do not cross me: Optimizing the use of cross-sectional designs. J. Bus. Psychol., 34(2019): 125-137. https://doi.org/10.1007/s10869-018-09613-8[CrossRef]
Venkatesh V, Morris MG, Davis GB, Davis FD (2003). User acceptance of information technology: Toward a unified view. MIS Q., 27(3): 425-478. https://doi.org/10.2307/30036540[CrossRef]
Venkatesh V, Thong JY, Xu X (2012). Consumer acceptance and use of information technology: Extending the unified theory of acceptance and use of technology. MIS Q., 36(1): 157-178. https://doi.org/10.2307/41410412[CrossRef]
Wang H, Wei Y, Zhang L, Ge Y, Liu H, Zhang X (2025). Improved shell color index for chicken eggs with blue-green shells based on machine learning analysis. Foods, 14(17): 3027. https://doi.org/10.3390/foods14173027[CrossRef]
Zatsu V, Shine A, Tharakan J, Peter D, Ranganathan T, Alotaibi S, Mugabi R, Muhsinah A, Waseem M, Nayik G (2024). Revolutionizing the food industry: The transformative power of artificial intelligence: a review. Food Chem. X, 24(2024): 101867. https://doi.org/10.1016/j.fochx.2024.101867[CrossRef]