Research Article · Volume 41, Issue 1, 13 May 2026 · Open Access
Optimizing Growth Performance in New Zealand White Rabbits: The Effects of Varying Energy and Protein Levels
· · ·
Affiliations & Notes ⌄
- 1Department of Animal Sciences, Bangladesh Agricultural University, Mymensingh-2202, Bangladesh 2Department of Microbiology and Hygiene, Bangladesh Agricultural University, Mymensingh-2202, Bangladesh Corresponding author: Abdullah-Al-Jabir jabir50812@bau.edu.bd
Article Info ⌄
- Journal:
- Punjab University Journal of Zoology
- Published:
- 13 May 2026

From the article
- This study explored how different energy and protein levels in rabbit diets affect growth over 95 days.
- Rabbits that received both high energy and high protein (T4) consumed the most feed but did not show the fastest growth, indicating that excess nutrients can be inefficient and may burden metabolism.
- The study highlights that the balance between protein and energy is more important than increasing either alone.
- Overall, a low-energy, high-protein diet offers better growth performance and feed efficiency, potentially lowering production costs.
Selected from the article's own text.
Abstract
Introduction
Rabbits are considered a valuable micro-livestock ; . Globally, rabbit farming is increasingly recognized as a viable solution to address protein deficiency, particularly in low-income and resource-limited regions due to their high reproductive rate, efficient feed conversion, and small space requirement ; . Commercial rabbit production has gained significant attention and is seen as a promising source of income and employment (Omolade et al., 2016). In developing countries, rabbits are particularly valued for their efficiency and cost-effectiveness in providing protein to meet the growing nutritional demands . Rabbits offer numerous advantages for improving nutrition, as they convert roughage into meat efficiently, with the ability to convert up to 20% of the protein they consume into edible meat under optimal management. Their growth rate is comparable to that of broiler chickens, with Soviet Chinchilla rabbits reaching a live weight of 2 kg in 12 weeks .
Rabbits mature sexually at 4-5 months, with a litter size ranging from 2-7 and a gestation period of about 1 month. A female rabbit can reproduce 5-7 times per year ; . Although rabbit farming is increasingly accepted in Bangladesh, particularly in regions where commercial factors and social aspects support it, challenges such as marketing difficulties in remote areas persist. Proper nutrition is crucial for optimizing rabbit growth, with dietary protein levels having a significant impact on performance, which varies with age . Dietary manipulation, especially the balance of energy and protein, plays a critical role in maximizing growth performance, yet optimal ratios remain under-researched for specific breeds and climates. Current dietary recommendations suggest a crude protein (CP) level of 17-18% for growth and 15-16% for fattening . Additionally, citric acid levels in diets can influence growth performance, with 1.5% citric acid showing positive effects .
In Bangladesh, limited studies have explored the combined influence of energy and protein levels on rabbit growth, highlighting the need for targeted nutritional trials to support the growing interest in commercial rabbit production. Despite the availability of literature, research on the combined effects of energy and protein levels on the growth performance of New Zealand White rabbits in Bangladesh remains limited. This study aims to address this gap by examining how different dietary energy and protein levels impact rabbit growth and feed intake.
Materials and Methods
Study area and period
The experiment was conducted at the Department of Animal Science, Bangladesh Agricultural University, Mymensingh from November 2019 to May 2020. The trial lasted for 95 days.
Experimental animals and housing
A total of 20 healthy New Zealand White rabbits, aged approximately 2 months and with similar initial body weights (468g-621g) and either sex, were selected for the study. Rabbits were housed in well-ventilated cages under standard environmental conditions. The housing area maintained a temperature range of 20–28°C, relative humidity between 65–75%, and a 12-hour light/12-hour dark cycle throughout the experimental period.
All rabbits were clinically examined before the start of the study. They were dewormed two weeks prior using albendazole at a standard dosage. No antibiotics, growth promoters, or additional supplements were used during the study period.
Table 1: Layout of the experiment.
| Treatments | Initial live weight (g) of the rabbits | ||||
| R1 | R2 | R3 | R4 | Average (g) | |
| T0 | 479 | 448 | 576 | 370 | 468.25 ± 42.61 |
| T1 | 492 | 502 | 442 | 412 | 462 ± 21.21 |
| T2 | 502 | 418 | 505 | 518 | 485.75 ± 22.84 |
| T3 | 554 | 659 | 507 | 547 | 566.75 ± 32.44 |
| T4 | 680 | 549 | 683 | 574 | 621.5 ± 35.02 |
Experimental design and diets
The study followed a Completely Randomized Design (CRD) with five dietary treatments, each comprising four replicates (n= 4) (Table 1). The rabbits were randomly allocated to the following treatment groups:
The experimental diets were as follows:
- T0= Ad libitum Napier pakchong grass + concentrate mixture containing 2600 kcal ME/kg DM and 17%CP
- T1= Ad libitum Napier pakchong grass + concentrate mixture containing 2400 kcal ME/kg DM and 15%CP
- T2= Ad libitum dhal grass + concentrate mixture containing 2800 kcal ME/kg DM and 15%CP
- T3= Ad libitum Napier pakchong grass + concentrate mixture containing 2400 kcal. ME/kg DM and 19%CP
- T4= Ad libitum Napier pakchong grass + concentrate mixture containing 2800 kcal ME/kg DM and 19%CP
Preparation of concentrate mixture
Five concentrate mixtures were formulated having five different combinations of energy and protein per kg DM (T0, T1, T2, T3 and T4.) The ingredient composition, nutrient composition and price per kg concentrate mixtures are shown in Table 2. The formulated concentrate mixtures
Table 2: Ingredient composition, nutrient composition of the concentrate mixtures.
| Ingredients (kg) | Experimental diets | ||||
| T0 | T1 | T2 | T3 | T4 | |
| Napier grass (Pennisetum purpureum) | Adlibitum | Adlibitum | Adlibitum | Adlibitum | Ad libitum |
| Maize | 0.424 | 0.295 | 0.52 | 0.29 | 0.516 |
| Rice | 0.201 | 0.2525 | 0.2025 | 0.17 | 0.09 |
| Mustard oil cake | 0.1 | 0.075 | 0.15 | 0.17 | 0.085 |
| Wheat bran | 0.094 | 0.27 | 0.05 | 0.2025 | 0.069 |
| Soyabean meal | 0.163 | 0.09 | 0.06 | 0.15 | 0.2225 |
| DCP | 0.01 | 0.01 | 0.01 | 0.01 | 0.01 |
| Vit-min-pre | 0.0025 | 0.0025 | 0.0025 | 0.0025 | 0.0025 |
| Salt | 0.005 | 0.005 | 0.005 | 0.005 | 0.005 |
| Total | 1 kg | 1kg | 1kg | 1kg | 1kg |
| CP (crude protein) | 16.92 | 24.02 | 2788.725 | 2404.05 | 2727.36 |
| ** ME(kcal/kgDM) | 2655 | 15 | 14.145 | 19.02 | 18.51 |
| *Ca | 0.366 | 0.413 | 0.3787 | 0.4273 | 0.430 |
| *P | 0.33 | 0.13 | 0.3536 | 0.415 | 0.343 |
| Cost = Tk./kg concenrate mixutre (Fresh basis) | 33.21 | 35.70 | 31.19 | 34.44 | 32.32 |
**Calculated from the manual of selected Topics in Animal Nutrition by W. Close and K. H. Menke (1976).
were fortified with vitamin mineral premix (Rhodivit L) at the inclusion level of 2.5 kg/1000 kg to all mixtures, DCP 10 kg/1000kg, salt 5kg/1000kg was also added with all mixture at inclusion level.
Diets and feeding practice
The experimental rabbits were reared in five different dietary treatments (Table 2). Different type of protein and energy were supplied on the ration. Napier grass supplied on ad-libitum basis to the growing rabbits. Concentrate mixture was supplied at the rate of 50g/day during first 60 days and 60g/d for the rest of the periods. The Locally available Napier grass were collected every morning then washed, chopped, weighed and supplied to the rabbits. The required amount of concentrate mixture and green grass were offered twice daily, half of mixture and green grass in the morning at 8.00 am. And another half in the afternoon at 4.00 pm. Fresh clean drinking water was supplied to rabbits at all time.
Measurement procedures
Feed intake: Rabbits were provided with a measured amount of concentrate mixture in the morning, while Napier Pakchong grass was given ad libitum (10% excess). The grass was divided and supplied in the morning and evening. Refusals were collected, weighed, and recorded the next morning. Daily feed intake was calculated by subtracting the refusals from the supplied diet.
Live weight: Rabbits were weighed individually before the experiment to record initial live weight. Subsequently, they were weighed every five days before morning feeding. Total live weight gain was calculated by subtracting the initial weight from the final weight, and daily weight gain was determined by dividing this by the 95-day experimental period.
Average daily gain
Average daily live weight gain (ADG) was calculated as follows:

Growth velocity
The growth velocity (GV) of rabbits in a period of time 90 days was calculated by following formula:

Statistical analysis
Completely randomized design (CRD) was followed in this study. Analysis of variance were done by SPSS computer program. Significant differences among the treatments were identified using least Significant Difference test.
Results and Discussion
Total feed intake
Total feed intake has been shown in Table 3. Different treatments groups had significantly different (p<0.01) feed intake level where T4 group had the highest (4742.50 g)
Table 3: Total feed intake and different growth parameters for different treatment groups.
| Parameters | T0 | T1 | T2 | T3 | T4 | Level of significance |
| Initial live weight (g) | 468.25± 42.61bc | 462.00± 21.21c | 485.75± 22.85bc | 566.75±32.45ab | 621.50±35.02a | ** |
| Final live weight (g) | 818.75± 24.71c | 833.00± 15.80c | 903.00± 10.24b | 1001.00±12.01a | 918.25±25.78b | ** |
| Total live weight gain (g) | 350.50± 59.69a | 371.00± 16.77a | 417.25± 18.25a | 434.25±27.19a | 296.75±43.68b | NS |
| Daily live weight gain (g) | 3.69± 0.081c | 3.91± 0.091b | 4.39± 0.061a | 4.57±0.069a | 3.12±0.058d | ** |
| Growth velocity | 0.75± 0.023c | 0.80± 0.025b | 0.86± 0.00a | 0.77±0.018bc | 0.48±0.018d | ** |
| Total feed intake | 3208.02± 66.44d | 3482.37± 38.92c | 3643.32± 74.14c | 4055.85±41.59b | 4742.50±49.57a | ** |
T0 = ME: 2600Kcal/Kg, CP: 17%; T1 = ME: 2400Kcal/Kg, CP: 15%; T2 = ME: 2800 Kcal/Kg, CP: 15%; T3 = ME: 2400Kcal/Kg, CP: 19%; T4 = ME: 2800, CP: 19%. NS, non significant. **, Significant at 1% level of significance; *, Significant at 5% level of significance. abc, mean values for different treatment groups with different superscripts in a raw differ significantly.
feed intake and T0 (control) group had lowest feed (3208.02) intake. Again the feed intake level reduced gradually in the T3, T2 and T1 groups. It had been reported that an increase in dietary energy was accompanied by corresponding reduction in feed consumption . Omoleke et al. (2016) conducted an experiment on rabbit fed Moringa oliefera and Daucus based diets (diet were formulated forages level 25%+18% crude protein) had found significantly (p<0.05) higher feed intake in treatment group. Prasad et al. (1996) concluded that total feed intake and daily DM intake (g) were higher in low energy (2585 kcal/kg) and medium energy (2778 kcal/kg) regimes and they were lowest in high energy (3043 kcal/kg) regimes.
The Growth performance for instance live weight gain, daily live weight gain and growth velocity (GV) of rabbits fed on different diets containing different combination of energy and protein were note down in this study and result are shown Table 3.
Growth performance
The growth performance of the rabbits, including average live weight, daily live weight gain, total live weight gain, and growth velocity, was influenced by the dietary energy and protein levels.
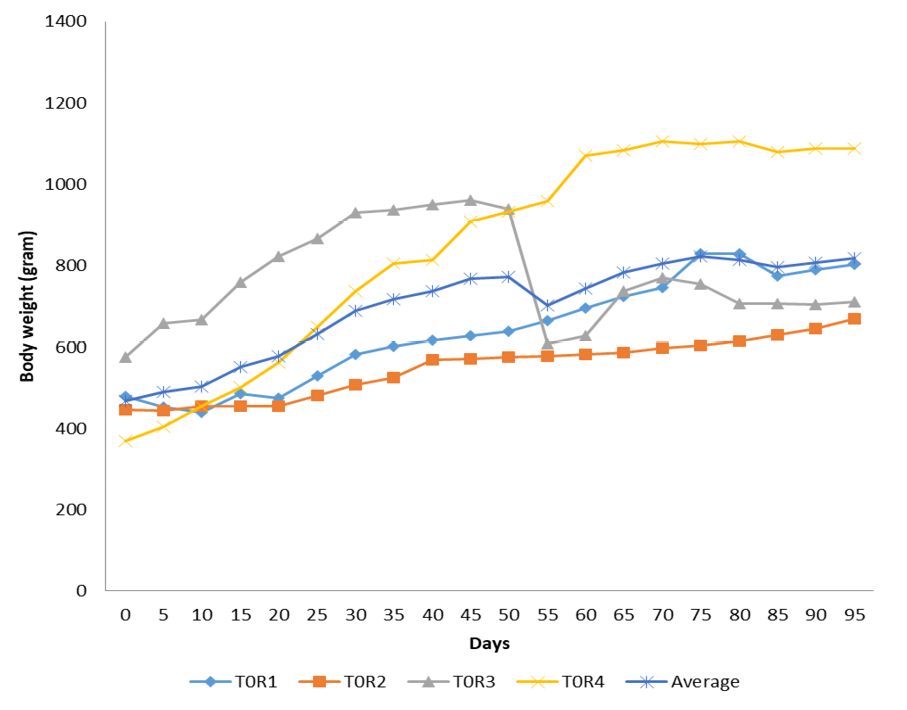
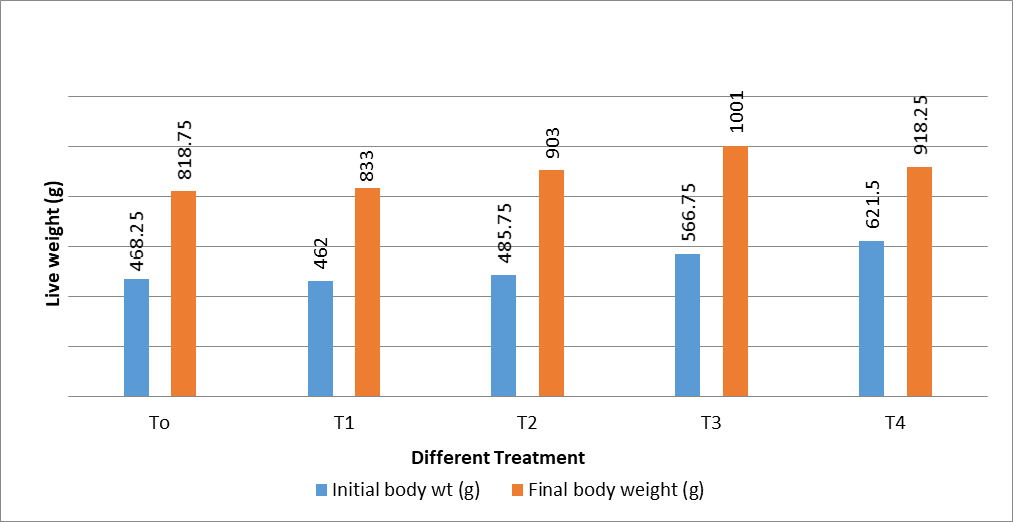
Figure 1 shows a gradual increase in the average live weight of rabbits receiving the control diet (2600 Kcal/kg ME and 17% CP). While there was steady growth over the experimental period, this group had the lowest final live weight (818.75 g), indicating limited growth efficiency under standard nutritional conditions.
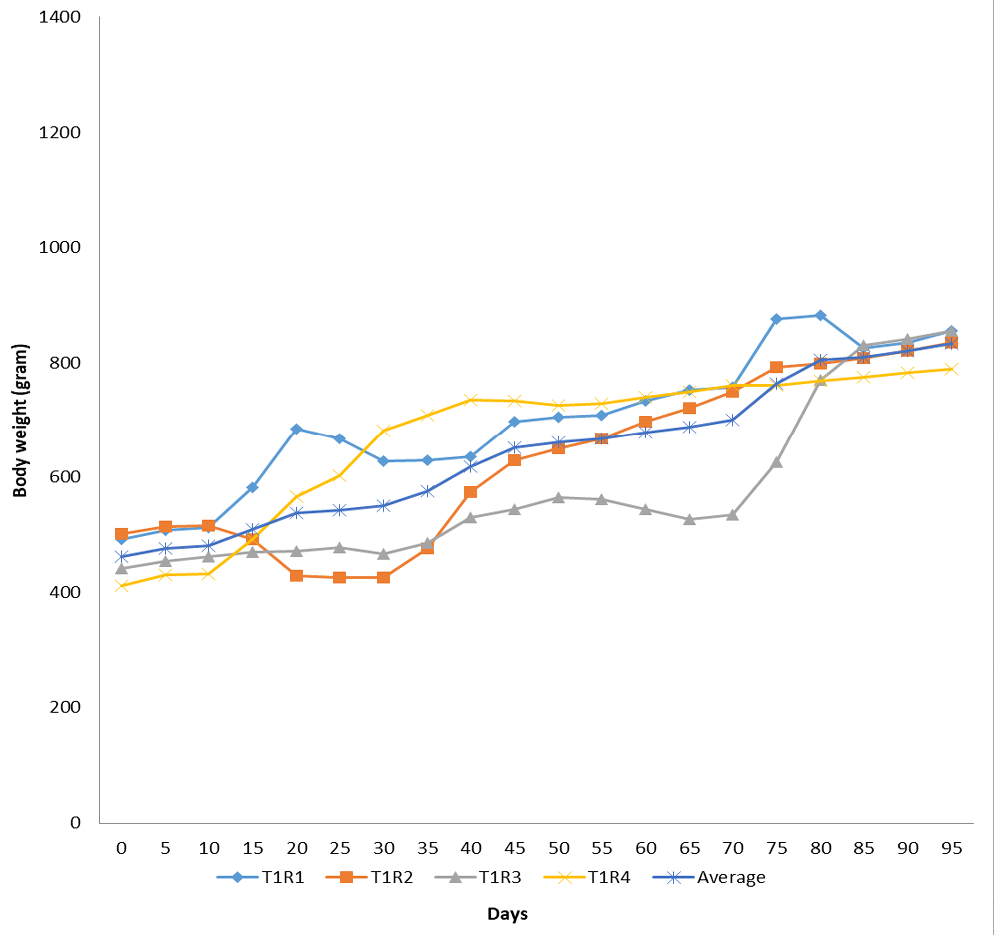
Rabbits fed with a low-energy, low-protein diet (2400 Kcal/kg ME and 15% CP) showed modest growth improvement over the control. The final average live weight reached 833 g, suggesting that although energy and protein were lower than standard, the diet still supported marginally better growth than the control.
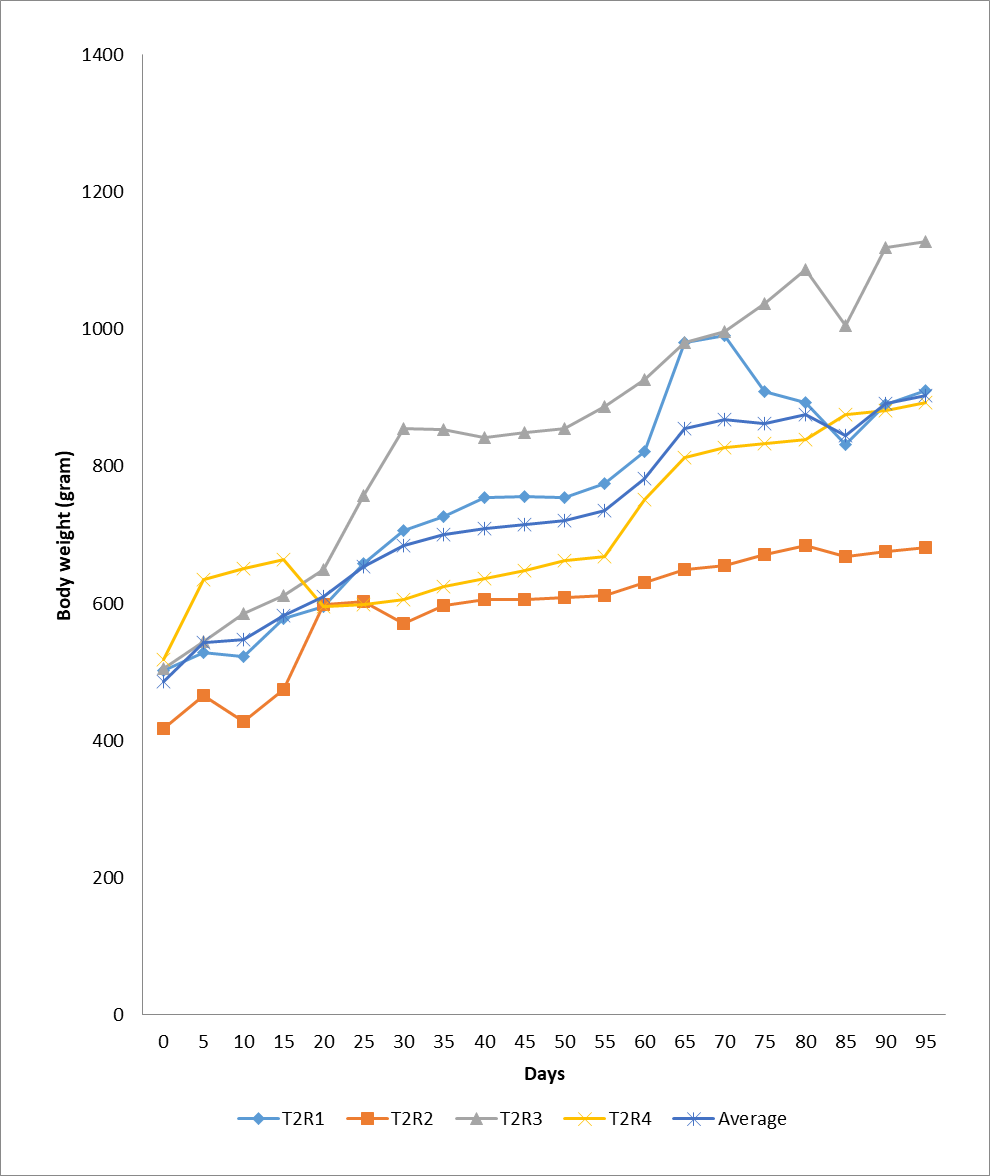
This group, which received a high-energy, low-protein diet (2800 Kcal/kg ME and 15% CP), showed improved growth performance, with a final average live weight of 903 g. The Figure 3 reflects a steady and more pronounced growth trend compared to T0 and T1, indicating that increased energy positively influenced growth, despite limited protein content.
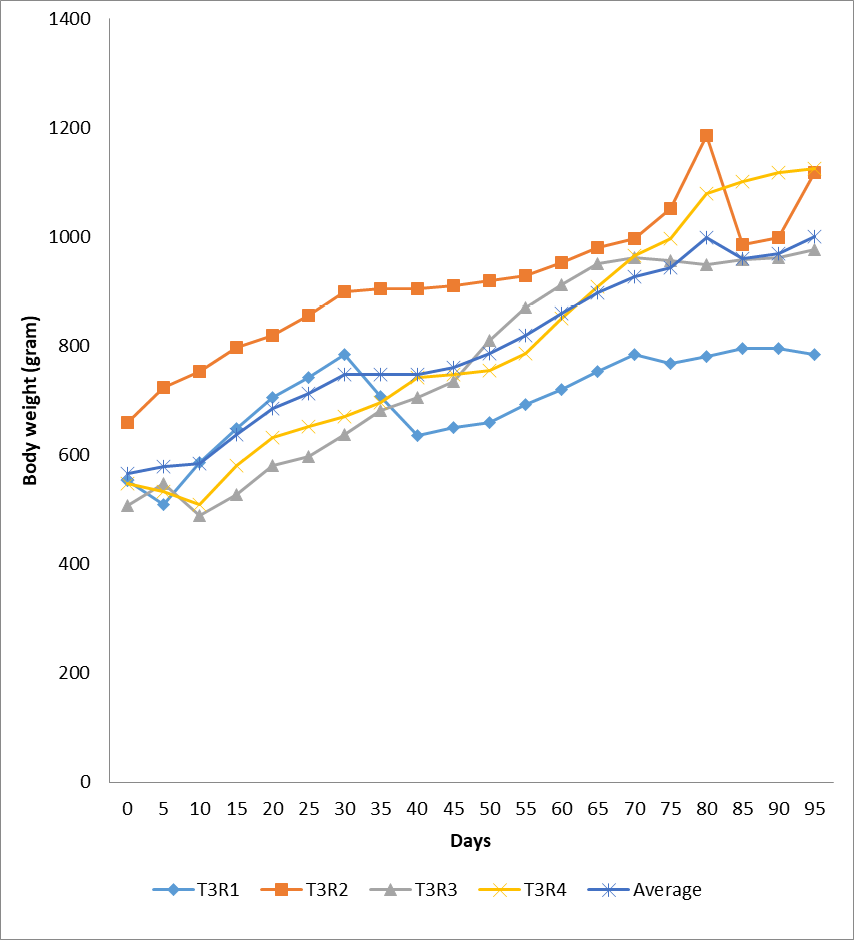
The T3 group (low-energy, high-protein: 2400 Kcal/kg ME and 19% CP) demonstrated the highest growth rate among all groups. The final live weight reached 1001 g, as clearly depicted in the Figure 4. This suggests that higher protein content in the diet played a crucial role in enhancing growth, even at a lower energy level.
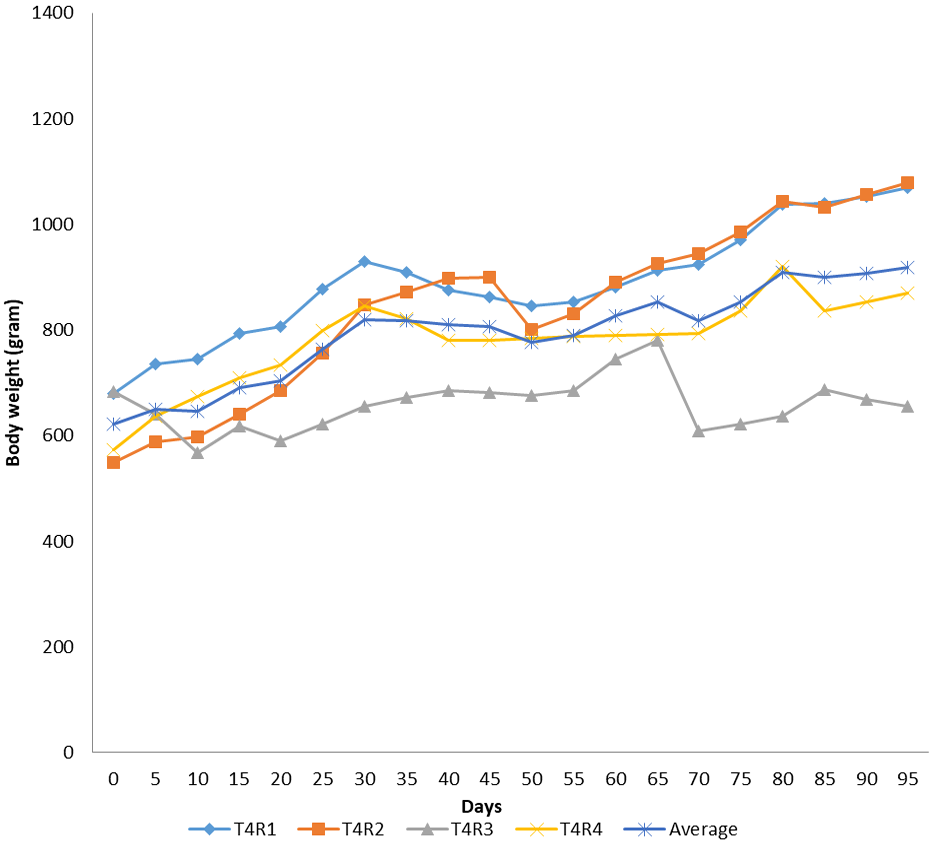
Rabbits fed a high-energy, high-protein diet (2800 Kcal/kg ME and 19% CP) achieved a final average live weight of 918.25 g. Though higher than most other groups, the growth rate was lower than T3, possibly due to metabolic imbalances or inefficiencies when both energy and protein levels are elevated (Figure 5).
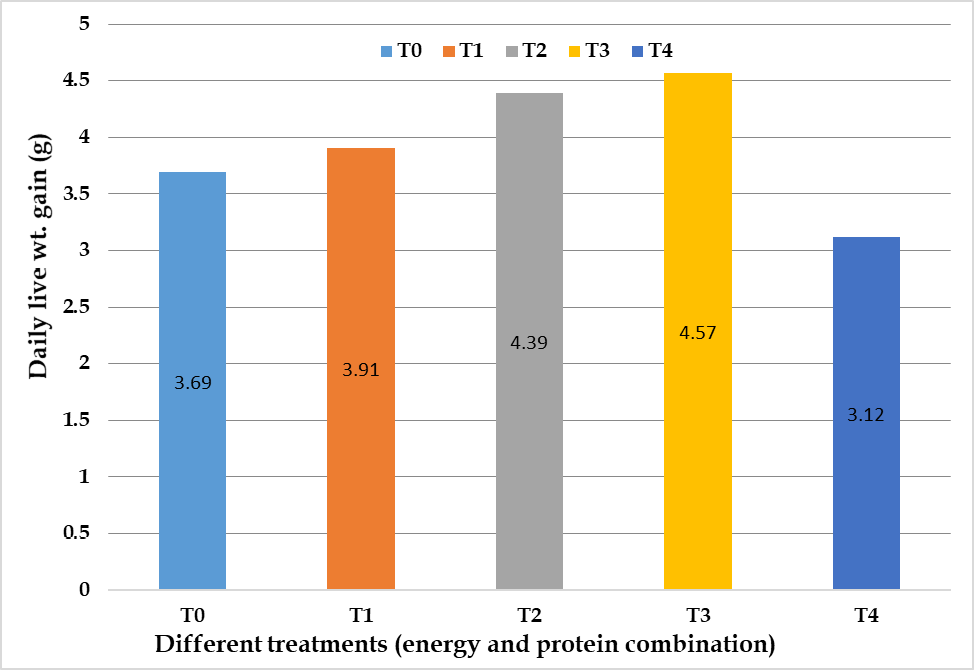
The relationship between final live weight and energy level had been shown in Figure 6 where the difference was significant. That indicated that with the increase of dietary energy level, final live weight of rabbit increased significantly. Daily live weight gains for T0 (control), T1, T2, T3 and T4 diet treatments groups are 3.69 g/d, 3.91 g/d, 4.39 g/d, 4.57 g/d and 3.12 g/d, respectively.
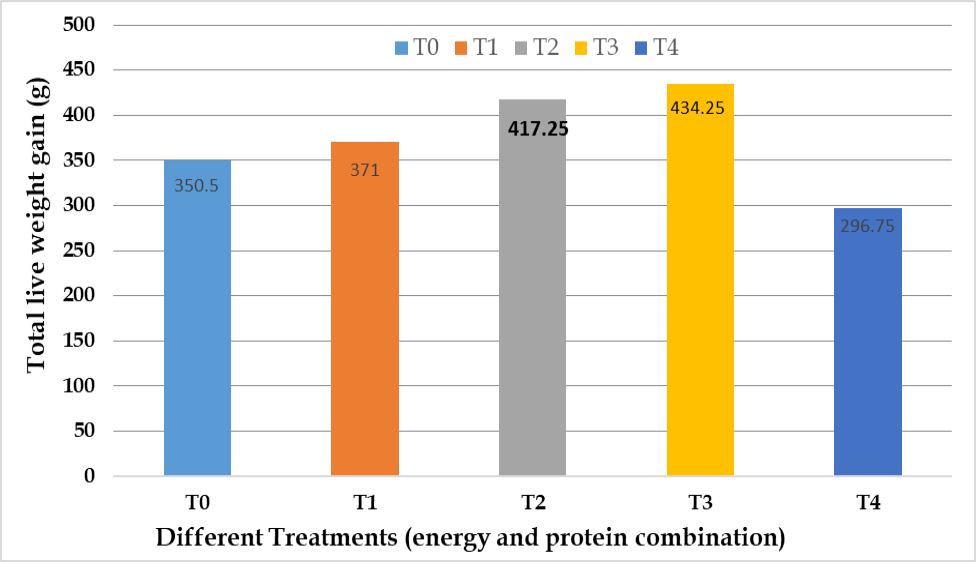
Total live weight gain for groups T0, T1, T2, T3 and T4 are 350.5 g, 371 g, 417.25 g, 434.25 g and 296.25 g respectively. Though total live weight gain did not differ significantly but the daily live weight gain differ significantly (Tabel 3, Figures 7 and 8). Prasad et al. (2000) also found that viable growth rate 15-18 g/d can be obtained on complete diets utilizing locally available concentrate supplements for economic broiler production. Alade et al. (2002) conducted a 56 days feeding trial to investigate the effect of varing levels of wheat bran on growth performance. The result indicates that the daily weight gain was 9.20, 8.90, 8.00 and 5.20 g/d, respectively. Hasnanat et al. (2002) found growth rate of 13.02 g/d when rabbits were fed fresh green grass and vegetable leaves with concentrate supplements in rural condition under farmers own managements. Xuepeng et al. (2012) found average daily gain of 22-26 g/d using different level of protein and energy.
Growth velocity
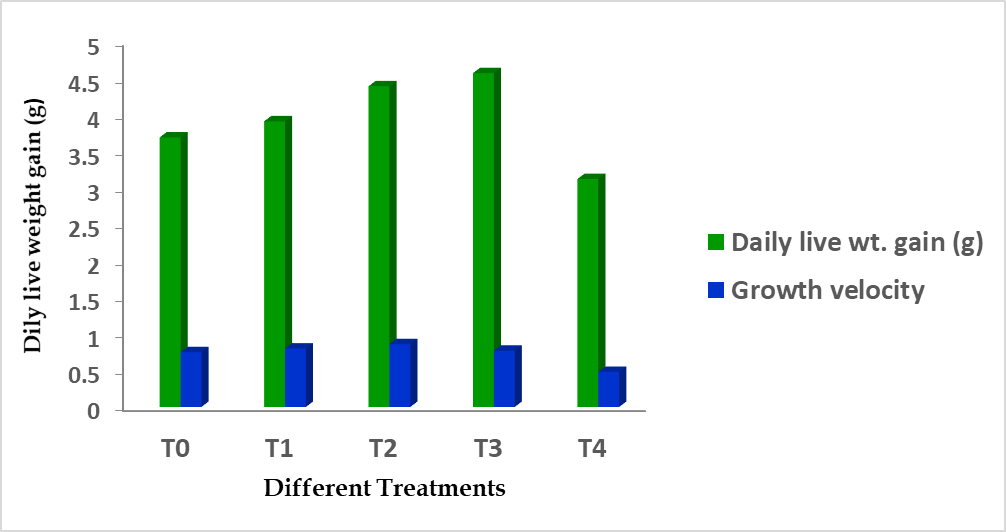
Growth velocity differed significantly as shown in Table 3. The relationship of daily live weight gain and growth velocity for different treatment had shown in Figure 9. However, significant difference was found between daily live weight gain and growth velocity.
The graph shows a positive correlation between daily weight gain and growth velocity. T2 exhibited the highest growth velocity (0.86), closely followed by T1 (0.80) and T3 (0.77). Interestingly, T4, despite its high nutrient content, showed the lowest growth velocity (0.48), suggesting potential overfeeding or nutrient imbalance (Figure 9).
Conclusion
This study explored how different energy and protein levels in rabbit diets affect growth over 95 days. The results showed that diet composition strongly influences feed intake and weight gain. Rabbits fed a low-energy (2400 Kcal/kg) but high-protein (19%) diet (T3) achieved the best final weight and daily growth rate, outperforming even the standard diet group (T0). This suggests that current feeding practices may not be fully optimized for maximum growth.
Rabbits that received both high energy and high protein (T4) consumed the most feed but did not show the fastest growth, indicating that excess nutrients can be inefficient and may burden metabolism. The study highlights that the balance between protein and energy is more important than increasing either alone. Overall, a low-energy, high-protein diet offers better growth performance and feed efficiency, potentially lowering production costs. Further research with larger samples and economic evaluation is recommended to create practical feeding guidelines for rabbit farming.
Declarations
Acknowledgement
The authors gratefully acknowledge the financial support provided by the Bangladesh Agricultural University Research System (BAURES) for conducting this study. Authors also extend our sincere thanks to the Department of Animal Science, Bangladesh Agricultural University, for providing the necessary research facilities and institutional support.
Funding
The study is funded by Bangladesh Agricultural University Research System (BAURES).
Ethical approval
All animal care and experimental procedures were approved by the Animal Ethics Committee of Bangladesh Agricultural University in accordance with institutional and international guidelines.
Data availability
The data supporting the findings of this study is included in the article. Additional datasets generated or analyzed during the study are available from the corresponding author upon reasonable request.
Generative AI and AI-assisted technology statement
The authors declare that no generative AI and AI assisted technology was used in the creation of this manuscript.
Statement of conflict of interest
The authors have declared no conflict of interest.
Figures

Average live weight of T0 treatment groups of rabbits.

Average live weight of T1 treatment groups of rabbits.

Average live weight of T2 treatment groups of rabbits.

Average live weight of T3 treatment groups of rabbits.

Average live weight of T4 treatment groups of rabbits.

Initial live weight and final live weight of rabbits for different treatment groups.

Total live weight gains at different treatment (energy and protein combination) groups.

Daily live weight gains at different treatment (energy and protein combination) groups.

Relationship between daily live weight gain and growth velocity for different treatment groups.
References
- Alade, N.K., Igwebuike, J.U. and Lawan, A., 2002. Effect of varying proportions of wheat bran on the growth performance and carcass components of growing rabbits. CABI Databases, 4:1-7.
- Cheeke, P.R., 1986. Nutrition and feeding of rabbits. In: Livestock feeds and feeding. Academic Press, San Diego, California. pp. 560-573.
- Chikwanha, O., Chiduwa, M., Malunga, I., Chimonyo, V., Mhlanga, B., Nyagumbo, I. and Thierfelder, C., 2024. Options for livestock feed improvement in Malawi.
- De Blas, C. and Wiseman, J., 2010. Nutrition of the rabbit. 2nd edition. https://doi.org/10.1079/9781845936693.0000[CrossRef]
- Goswami, N., Solomon, A.I., Kinkpe, L., Mujtaba, S.A., Xiangyang, Y., Song, B. and> Ren, Z., 2025. Enhancing rabbit farming efficiency with integrated genomics and nutritional strategies. Front. Anim. Sci., 5: 1514923. https://doi.org/10.3389/fanim.2024.1514923[CrossRef]
- Handa, M.C.K.L., Sapra, K.L. and Shinguri, B.K., 1995. Rabbits for meat production. Asian Livest., 20: 99-100.
- Hasanat, M.S., Hossain, M.E., Mostari, M.P. and Hossain, M.A., 2006. Effect of concentrate supplementation on growth and reproductive performance of rabbit under rural condition. Bangladesh J. Vet. Med., 4: 129-132. https://doi.org/10.3329/bjvm.v4i2.1296[CrossRef]
- Jones, K.R., Karuppusamy, S. and Sundaram, V., 2024. Unraveling the promise of agro-industrial by products as alternative feed source for sustainable rabbit meat production. Emerging Animal Species, pp. 100044. https://doi.org/10.1016/j.eas.2024.100044[CrossRef]
- Omoleke, O.E., Tomino, B.K., Adam, T.Z., Akanyz, H.D., Alede, L.I., Adeiza, M.A. and Kolawoly, V.O., 2016. Fed evaluation and growth performance of rabbits fed diet containg different forages. J. Vet. Sci., 11: 101-111.
- Prasad, R., Karim, S.A. and Patnayak, B.C., 1996. Growth performance of broiler rabbits maintained on diets with varying levels of energy and protein. World Rabbit Sci., 4: 75-78. https://doi.org/10.4995/wrs.1996.274[CrossRef]
- Prasad, R., Sankyan, S.K., Karim, S.A. and Prasad, R., 2000. Utilization of different protein supplements in the diet of broiler rabbits. Indian J., 70 (12): 1266-1267.
- Uddin, M.J., Islam, K.M.S., Reza, A. and Chowdhury, R., 2014. Citric acid as feed additive in diet of rabbit-effect on growth performance. J. Bangladesh Agric. Univ., 12: 87-90. https://doi.org/10.3329/jbau.v12i1.21246[CrossRef]
- Vietmeyer, N.D., 1985. Potentials of micro livestock in developing countries. J. Appl. Rabbit Res., 8: 16.
- Walia, S.S. and Kaur, T., 2023. Rabbit farming. In: Basics of integrated farming systems. Singapore: Springer Nature Singapore. pp. 95-98. https://doi.org/10.1007/978-981-99-6556-4_13[CrossRef]
- Wiseman, J., 1987. General information on the feeding of non-ruminants. In: Feeding of non-ruminants livestock. Butterworth and Co. LtD. London. pp. 4.
- Xuepeng, W., Mingwen, M.A., Liangzhan, S.U.N., Chunyang, W., Zhu, Y., Zhu and Fuchang, L.I., 2012. Effects of different protein, fibre and energy levels on growth performance and the development of digestive organs in growing meat rabbit. World Rabbit Sci. Assoc., pp. 641- 645.
- Yassein, A., Niveen, D.M. and Ezzo, O.H., 2011. Some productive, reproductive and physiological effects of using different dietary protein levels in rabbit does. Iran. J. Appl. Anim. Sci., 1: 183-192.
Services
Article usage statistics
Loading…