Research Article · Volume 10, Issue 11, 17 October 2022 · Open Access
DNA Methylation Profile Associated with Fertility Trait in Goat Using Whole-Genome Bisulfite Sequencing
· ·
Affiliations & Notes ⌄
1Cell Biology Department, National Research Centre, Dokki, Egypt
2College of Animal Sciences and Technology, Qingdao Agricultural University, China
3Biotechnology Research Department, Animal Production Research Institute, Agriculture Research Center, Dokki, Egypt. *Correspondence | Othman E Othman, Cell Biology Department, National Research Centre, Dokki, Egypt
Our results showed a slightly non-significant increase in DNA methylation level in goat ovaries in high fertility group over than that in low fertility group despite the detection of many DMRs and DMGs among the two fertility groups.
It is concluded that DNA methylation patterns of Zaraibi goat ovaries may be responsible for the fertility trait in goats through their important roles in folliculogenesis, oocyte ovulation rate and finally the fertility phenomena.
Also, this study confirmed the opposite association between the methylation levels and expressions of differentially methylated genes which are related to fertility phenomena in goats.
Selected from the article's own text.
Abstract
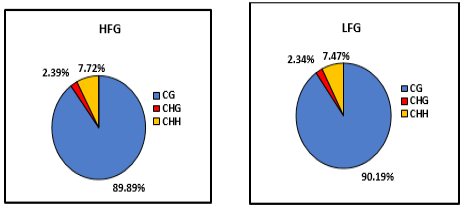
This work designed to investigate the epigenetic regulation of ovulation rate through DNA methylation profile using WGBS. The whole genome DNA was extracted from ovaries of Zaraibi goats belonging to two different fertility groups: high (HFG) and low (LFG) fertility groups. The extracted DNA was subjected to WGS after treatment with bisulfite. The findings declared that a small difference in the DNA methylation levels is present among high and low fertility groups. The methylated C frequencies in contexts: CG, CHG and CHH were 89.89%, 2.39%, 7.72% and 90.19, 2.34%, 7.47% in high and low fertility groups, respectively. This finding showed that the level of methylated C in CG context is in directionally opposite with fertility trait where this level is lower in HFG than that in LFG. In contrast, the levels of methylated C in contexts CHG and CHH are higher in HFG than those in LFG groups. Despite this small difference in the methylation levels, there are many DMR and DMG were identified in the two groups. One-hundred and seventy fertility-related genes with different frequency in methylation levels were selected for functional enrichment analysis and the results declared the strong relation between methylation patterns of DMGs and fertility trait. It is concluded that DNA methylation patterns of Zaraibi goat ovaries may be responsible for difference in ovulation rate trait between high and low fertility groups through their important roles in folliculogenesis and oocyte ovulation rate. Also, this study declared the opposite association between the methylation levels and expressions of differentially methylated genes which are related to fertility phenomena in goats.
Keywords | DNA methylation, Ovulation rate, Litter size, WGBS, Goat.
Introduction
DNA methylation is explained as attachment of methyl group to DNA especially to the carbon atom of cytosine base C at 5th position (Blow e al., 2016). Also, the addition of the methyl group may be occurred to the adenine nucleotide . The C methylation in CpG context is the extensively examined one compared to other contexts; CHG or CHH . DNA methylation is considered an important epigenetic factor which can transmit through successive generations and it has different important physiological and biological activities such as gene expression and cellular differentiation ; and can affect the phenotypes characters in domestic animals .
DNA methylation can be studied using different sequencing approaches including whole genome bisulfite sequencing . The Next-generation sequencing of DNA treated with bisulfite became the most popular approach to investigate the DNA methylation profile for the whole genome where it gives complete information about the methylation profile of cytosine nucleotides among the whole genome with high specificity.
As the levels of economic and living standard increasing, more meat food is required. Lamb meat is preferable and palatable for population in Mediterranean’s countries including Egypt . The demand for lamb is much more than the real lamb production in Egypt and this demand for lamb is continuously increasing due to the over populations. Goats are considered the important sources for meat and milk, particularly in dry and semidry regions .
Fecundity is an important economic trait for production of goat meat, therefore, the increasing of goat fecundity will dramatically increase the economic benefits . The litter size is an important indicator for fecundity, and it contributes 74-93% for fecundity. The ovulation rate is the direct and most important factor which controls the litter size and fecundity where it is the major contributor for goat fecundity. In order to breed the higher fecundity goat, it is highly important to investigate the goat ovulation rate trait , so the present work aimed to investigate the DNA methylation pattern of Zaraibi goat ovaries and its association with fertility trait using the sequencing of bisulfite-treated DNA.
Materials and Methods
Sampling
Two groups of Zaraibi goats were used in this study; high fertility group (HFG; goats had 3/litter) and low fertility group (LFG; goats had 1/litter) in the four previous generations. Three animals from each group were sacrificed under the normal conditions (so, it is not needing any ethic permission) and the ovaries were collected for the analysis of DNA methylation.
Whole-genome bisulfite sequencing
WGBS was carried out according to procedures described by Frattini et al. (2017) and An et al. (2018). Genomic DNA was extracted from the collected ovaries of two fertility groups. The genomic DNA was fragmented to 200-300bp and treated with bisulfite using DNA Methylation Kit. After treatment, PCR amplification of DNA was done to constitute DNA library. The sequencing of samples was done using Illumina HiSeq 2500 platform. After sequencing and filtration, the clean reads were recorded and compared to goat reference genome .
Methylation level analysis
The methylation level analysis was done according to procedures described by Frattini et al. (2017) and An et al. (2018). The clean reads were compared with goat reference genome and the methylation level was recorded in the complete genome.
Analysis of differentially methylated regions (DMR)
The DMRs were determined using methylKit software. Multiple samples data were analyzed together. Logistic regression model was used to analyze the DMR between groups. The DMR differences were expressed as the mean for each group. The significant different methylation levels between the two tested groups were determined (>10%; q value <0.05).
To validate the sequencing results of these DMGs, ten genes of them were selected for the assessment of their mRNAs expression level using qRT-PCR. The reaction volume of 20 μl containing 10 μl SYBRGreen master mix, 0.6 μl of 10 μM of both primers (Zhang et al., 2017), 1 μl cDNA and the volume was completed with RNase-Free water. The Data were analyzed using the equation described by Livak and Schittgen (2001). GAPDH was used as a House-Keeping gene to normalize the results of gene expressions and the statistically significant was p<0.05
Results
DNA methylation data
Whole genome DNA bisulfite sequencing was done for six samples: three from each groups, high (HFG) and low (LFG) fertility groups. Averages for total numbers of sequenced basses and reads number were 177,265,899,051 and 1,173,946,351 for HFG and for LFG 177,437,595,615 and 1,175,083,415, respectively. After trimming process, the total numbers of sequenced bases in HFG and LFG were 153,975,467,691 and 153,874,094,771, respectively and total read›s number were 1,168,585,920 and 1,169,067,815 for HFG and LFG, respectively. The means of Q20% and Q30% for clean and full-length reads were 97.73 and 93.72 for HFG and 97.56 and 93.35 for LFG, respectively (Table 1).
Table 1: DNA methylation data
Group
Sample ID
Mean of
total read bases
Mean of
total reads
GC (%)
Q20 (%)
Q30 (%)
HFG
Raw data
177,265,899,051
1,173,946,351
22.75
97.48
93.36
Trimming data
153,975,467,691
1,168,585,920
21.32
97.73
93.72
LFG
Raw data
177,437,595,615
1,175,083,415
22.92
97.30
92.98
Trimming data
153,874,094,771
1,169,067,815
21.44
97.56
93.35
Table 2: Estimated bisulfite conversion rate by sample
Group
Sample ID
Methylated read level
measurements
Unmethylated read level
measurements
Estimated bisulfite
conversion rate (%)
Mean
HFG
H1
37,005
19,311,931
99.81
99.80
H2
65,234
30,899,149
99.79
H3
58,886
28,695,620
99.80
LFG
L1
67,995
33,267,371
99.80
99.80
L2
73,083
35,374,241
99.79
L3
45,606
23,503,901
99.81
Table 3: Methylation ratio of each cytosine in CG, CHG and CHH contexts
Group
Contexts
Total coverage
Methylated coverage C
Methyl %
HFG
CG
713,802,917
531,249,514
74.43%
CHG
3,600,679,228
14,079,061
0.39%
CHH
12,071,376,457
45,637,435
0.38%
LFG
CG
696,437,619
513,622,677
73.75%
CHG
3,477,494,063
13,308,854
0.38%
CHH
11,592,085,582
42,589,326
0.37%
Bisulfite conversion rate
Bisulfite conversion rate was calculated at CG, CHG, CHH sites within the lambda genome (Table 2). The bisulfite conversion rates were estimated and ranged from 99.79% to 99.81% among samples using lambda phage DNA as a spike-in control.
Methylation level
The results declared that there is a small difference in the DNA methylation profiles between the two groups, where the frequency of methylated C to total C in context CG is 74.43% for HFG and 73.75% for LFG. The frequency of methylated C to total C in context CHG is 0.39% for HFG and 0.38% for LFG and the frequency of methylated C to total C in context CHH is 0.38% for HFG and 0.37% for LFG (Table 3).
The distribution ratios of methylated C in the three contexts: CG, CHG and CHH were 89.89%, 2.39%, 7.72% and 90.19, 2.34%, 7.47% in high and low fertility groups, respectively (Figure 1). This finding showed that the level of methylated C in CG context is in directionally opposite with fertility trait where this level is lower in HFG compared with that in LFG. In contrast, the levels of methylated C in contexts CHG and CHH (where H = A, C or T) are high in HFG compared with those in LFG groups
Identification of differentially methylated region (DMR)
The differentially methylated regions (DMR) with different methylation levels in the two fertility groups (HFG and LFG) were identified. Then, differentially methylated region-related genes (DMG) were determined; where DMR exists within the gene and its upstream 2 kb range, it is considered as a DMR-related gene. Totally, 4640 DMRs were observed, and their analysis showed that most of the
Table 4: List of Differentially Methylated Genes (DMGs)
No.
Gene
1
SOD1
2
APP
3
EPHA3
4
ARL6
5
GSK3B
6
CASR
7
DLG1
8
OPA1
9
TP63
10
PEX5L
11
SMC4
12
EPHB1
13
FAM3B
14
EPHB2
15
CUL3
16
EPHA4
17
BMPR2
18
SGO2
19
STAT1
20
CLASP1
21
GLI2
22
ZEB2
23
ACVR1
24
SLC4A10
25
GRB14
26
STK39
27
LRP2
28
MYO3B
29
SP3
30
ITGA4
31
LIMS2
32
CYFIP1
33
SCLY
34
MACF1
35
TUT4
36
NDC1
37
DAB1
38
NFIA
39
ROR1
40
RPE65
41
PTGER3
42
MSH4
43
PRKACB
44
TGFBR3
45
GFI1
46
STXBP3
47
SORT1
48
MAGI3
49
TBX15
50
IL6R
51
SHC1
52
ASH1L
53
NUF2
54
LMX1A
55
ILDR2
56
MAEL
57
HIPK2
58
AKR1B1
59
GLI3
60
PDE1C
61
BMPER
62
FOXP2
63
MET
64
ASZ1
65
CFTR
66
HGF
67
PCLO
68
HDAC9
69
ICA1
70
AKAP9
71
CDK14
72
GRB10
73
COBL
74
LGR5
75
PTPRQ
76
KITLG
77
SP1
78
PFKM
79
ARID2
80
NELL2
81
LRIG3
82
NTN4
83
CRY1
84
TM7SF3
85
LRP6
86
ETV6
87
LTBR
88
NTF3
89
TULP3
90
WNK1
91
MEI1
92
PDE5A
93
ENPEP
94
CASP6
95
LEF1
96
DKK2
97
TET2
98
SLC9B2
99
PKD2
100
SLIT2
101
RBPJ
102
PDS5A
103
GRXCR1
104
EPHA5
105
AMTN
106
PPEF2
107
FRAS1
108
PROM1
109
CPLX1
110
MEF2C
111
MSH3
112
FGF1
113
KLHL3
114
HSD17B4
115
CARM1
116
INSR
117
WNT3A
118
NEK1
119
GATA4
120
TEK
121
MLLT3
122
PTPRD
123
RFX3
124
KANK1
125
ALDH1A1
126
ANXA1
127
TLE4
128
RECK
129
PAX5
130
TGFBR1
131
NTRK2
132
PTCH1
133
WNK2
134
ROR2
135
FKTN
136
TNC
137
TPO
138
MYO6
139
MEI4
140
RSPO3
141
MCM9
142
RFX6
143
SLC16A10
144
FOXO3
145
SOBP
146
SIM1
147
UFL1
148
EPHA7
149
MAP3K7
150
CYB5R4
151
EYA4
152
AHI1
153
MAP7
154
MAP3K5
155
EPM2A
156
GRM1
157
SASH1
158
LATS1
159
ESR1
160
OPRM1
161
TSHR
162
MLH3
163
PGF
164
MAP3K9
165
ESR2
166
DACT1
167
ARID4A
168
SLC12A1
169
FGF7
170
MYO5A
171
ALDH1A2
172
MYO1E
173
APH1B
174
CSNK1G1
175
MAPKBP1
176
EXD1
177
SPRED1
178
SCG5
179
FMN1
180
REC114
181
MAP2K5
182
SMAD6
183
MERTK
184
MAP4K4
185
M1AP
186
ALMS1
187
VAX2
188
XDH
189
BIRC6
190
STRN
191
SOS1
192
PRKCE
193
EPAS1
194
RHOQ
195
FSHR
196
WDPCP
197
RAB1A
198
ALK
199
IFT172
200
RAB10
201
NCOA1
202
APOB
203
PRRX2
204
ABL1
205
RAP2A
206
GPC5
207
SCEL
208
UCHL3
209
PIBF1
110
DACH1
211
FGF9
212
ATP8A2
213
FLT1
214
HSPH1
215
RXFP2
216
FOXO1
217
HTR2A
218
CPB2
219
PLCB1
220
JAG1
221
PRKCQ
222
GATA3
223
MASTL
224
NRP1
225
MYO3A
226
ITGA8
227
ZEB1
228
MCM8
229
TRIB3
230
SLA2
231
STK4
232
SULF2
233
KCNB1
234
PTGIS
235
MMP16
236
RIPK2
237
NBN
238
TMEM64
239
STK3
240
GRHL2
241
RRM2B
242
UBR5
243
RIMS2
244
RSPO2
245
SYBU
246
SLC30A8
247
EXT1
248
EYA1
249
CYP7B1
250
CHD7
251
OPRK1
252
ADCY8
253
LRRC6
254
AGO2
255
NCAPD3
256
CRY2
257
ALX4
258
CD44
259
HIPK3
260
FSHB
261
KIF18A
262
LGR4
263
SYT9
264
USP47
265
DKK3
266
TEAD1
267
PDE3B
268
SOX6
269
SORL1
270
DRD2
271
SIK2
272
ATM
273
PIWIL4
274
AMOTL1
275
PGR
276
YAP1
277
MMP8
278
MARK1
279
EXO1
280
PRRX1
281
MTOR
282
NPHP4
283
AJAP1
284
TNN
285
ABL2
286
TDRD5
287
PTGS2
288
PLA2G4A
289
PROX1
290
UTP25
291
ASPM
292
MORC2
293
ZNRF3
294
HNF1A
295
OAS1
296
NOS1
297
TAOK3
298
NCOR2
299
SCARB1
300
PDGFC
301
JADE1
302
CLGN
303
MND1
304
FGB
305
CPE
306
NUP93
307
DPEP3
308
CDH3
309
CDH1
310
SPINT2
311
LTBP4
312
PLAUR
313
BCL3
314
TRPM4
315
TEX14
316
HNF1B
317
NOS2
318
NLK
319
ABR
320
RPH3AL
321
GPS2
322
NDEL1
323
SPAG9
324
HOXB2
325
BRCA1
326
NBR1
327
SOST
328
WNT3
329
MAP3K3
330
ERN1
331
DDX5
332
MAP2K6
333
PRKCA
334
PIK3R1
335
MAP3K1
336
DDX4
337
ITGA1
338
FGF10
339
GHR
340
DAB2
341
NIPBL
342
PRLR
343
LRRK1
344
IGF1R
345
NTRK3
346
IREB2
347
PML
348
BCL11B
349
EGFR
350
NEK10
351
TGFBR2
352
MLH1
353
MYRIP
354
VHL
355
ITPR1
356
MITF
357
LRIG1
358
APPL1
359
HESX1
360
PBRM1
361
LIMD1
362
ATP2B2
363
ATG7
364
PPARG
365
NR2C2
366
BMP6
367
EDN1
368
PKHD1
369
CLIC5
370
RUNX2
371
PTK7
372
DAAM2
373
MAPK14
374
LEMD2
375
GFRAL
376
TSHZ1
377
CDH2
378
TAF4B
379
MIB1
380
GREB1L
381
LPIN23
382
RAB31
383
PTPN2
384
ALPK2
385
BCL2
386
PDPK1
387
ABAT
388
MRTFB
389
MARF1
390
XYLT1
391
PALB2
392
ERN2
393
CUX1
394
SUN1
395
HTRA1
396
FGFR2
397
GRK5
398
EIF3A
399
PNLIP
400
TDRD1
401
TCF7L2
402
GPAM
403
OGA
404
BTRC
405
PLCE1
406
TNKS2
407
RARB
408
KAT6A
409
SFRP1
410
MTNR1A
411
TLR3
412
ING2
413
MCU
414
PSAP
415
SGPL1
416
NID1
417
MAP3K21
418
NOX4
419
GAS2
420
ATRX
421
EDA
422
ACE2
423
GPC3
424
HTR2C
425
AMOT
426
NRK
427
CASK
428
SYTL4
429
NOX1
430
IFT57
431
ADCY5
432
PTX3
433
RYK
434
ARID1A
435
BOLL
436
NR4A2
437
ACVR1C
438
DHRS9
439
ITGA6
440
HOXD3
441
ITGAV
442
KCNQ4
443
HSPB11
444
LEPROT
445
EN2
446
NOD1
447
WNT2
448
HBP1
449
PIK3CG
450
ATP2B1
451
SOCS2
452
IRAK3
453
IGF1
454
APPL2
455
MYH9
456
PDE6H
457
DUSP16
458
PLA2G6
459
DMC1
460
ANXA5
461
TLR6
462
NMU
463
EREG
464
HELQ
465
CPEB2
466
TNIP1
467
RGS14
468
CSF2
469
MAPK9
470
BLK
471
KLF9
472
TLE1
473
DOK2
474
NPM2
475
ASPN
476
SYK
477
GADD45G
478
PHIP
479
HEY2
480
HDAC2
481
SGK1
482
MAP3K4
483
DIO2
484
PKM
485
MAP2K1
486
PAX8
487
ACTR2
488
TNFSF11
489
BMP2
490
STK35
491
TAF4
492
BMP7
493
SOGA1
494
PTPN1
495
ZFAT
496
TRAF6
497
CAT
498
ILK
499
TGFB2
500
AKT3
501
PRKCZ
502
NEK2
503
FGF2
504
GAB1
505
CYLD
506
NOD2
507
DVL2
508
MAP2K4
509
ITGA3
510
DLX3
511
SOCS7
512
STAT5B
513
RPTOR
514
IRX1
515
PAX9
516
DICER1
517
PLCD1
518
CTNNB1
519
TMF1
520
SCAP
521
UBR2
522
GRM4
523
BMP5
524
GALR1
525
TAOK2
526
TRIM72
527
ARL3
528
HELLS
529
PLAT
530
FGFR1
531
MTNR1B
532
ANO1
533
BMP15
534
EPHA4
535
BMPR2
536
SGO2
Table 5: List of fertility-associated DMGs
No.
Gene
1
LGR4
2
ROR1
3
SPATA22
4
CSF1R
5
YTHDC2
6
ACVRI
7
ASH1L
8
ELK4
9
PLA2G4A
10
VMP1
11
LAMB1
12
DPEP3
13
DVL2
14
PDE3A
15
CTNNB1
16
MAEL
17
CPE
18
GATA3
19
STRN
20
ENPP1
21
HPGD
22
DAB1
23
IL15
24
PRKCA
25
SYDE1
26
DMRT1
27
HUS1
28
GPNMB
29
LRRK1
30
SPO11
31
MERTK
32
BRD7
33
FERMT2
34
VHL
35
RXFP1
36
MSX2
37
PTGS2
38
PDE5A
39
MESD
40
PTPRT
41
PAX3
42
CCNE2
43
CSNK2A1
44
PTPRC
45
RRM2B
46
RECK
47
TPH1
48
GRB10
49
LRRK2
50
STAT5B
51
PGR
52
MRE11
53
FRZB
54
CD44
55
LRRFIP2
56
TNKS2
57
TOP2B
58
TRIM72
59
AHSG
60
CDO1
61
BACHI
62
DACT1
63
IL7R
64
A1CF
65
DCDC2
66
ABCG2
67
RAD54L
68
SCEL
69
BRDT
70
MSH5
71
PAK1IP1
72
DYRK3
73
TLE4
74
ASZ1
75
CAV1
76
SMC4
77
TDGF1
78
AURKC
79
CDH2
80
MARK1
81
ANKRD1
82
SENP2
83
mTOR
84
NXN
85
KANK1
86
TIAM1
87
SIAH1
88
ARL6
89
TUT7
90
TNIK
91
ATP2B2
92
PRKAA1
93
PTPRD
94
XDH
95
ROBO1
96
TRPM4
97
INVS
98
FZD6
99
RNF213
100
FERMT1
101
YAP1
102
PRKCB
103
IL12B
104
CCDC88C
105
BTRC
106
M1AP
107
ATM
108
ELP2
109
TNN
110
PRKCQ
111
PMAIP1
112
NPHP3
113
TMEM64
114
RAD1
115
ESPL1
116
FANCM
117
USP34
118
RRN3
119
LRP6
120
EIF2AK3
121
DAAM2
122
GSK3B
123
SOD1
124
MCM8
125
CDIPT
126
ACTR2
127
PIAS1
128
PTCH1
129
PTPN2
130
ALMS1
131
WAPL
132
ATRX
133
SGO2
134
NEUROD1
135
MEIOB
136
SUN1
137
SPRED2
138
JAK1
139
PTX3
140
AKR1B1
141
MLH1
142
DDX5
143
SCYL1
144
TGFBR2
145
PTGIS
146
SPRED1
147
PRKCZ
148
STK3
149
APPL2
150
UBR2
151
PTPRO
152
ASPM
153
PSMD7
154
MLH3
155
STAT1
156
BICC1
157
STK3
158
PRDM14
159
KDM1A
160
RBMS3
161
NPHP4
162
SFRP4
163
TNKS
164
RXFP2
165
CCAR2
166
AMOTL1
167
PRMT6
168
SMC2
169
CDK14
170
CRLF2
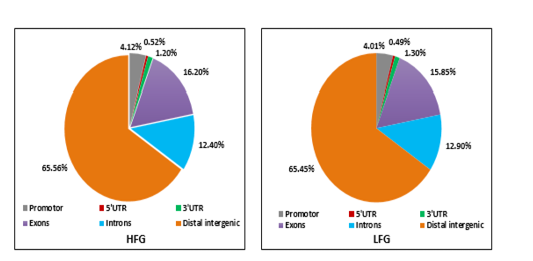
DMRs (4615 DMRs) were found in CG context whereas little DMRs were found in CGH (15 DMRs) and CHH (10 DMRs) contexts. The quantity of hypermethylation in CG islands was determined in both HFG and LFG (Figure 2). For HFG, about 65.56% of hypermethylation CGI was present in distal intergenic regions followed by exons and interons with 16.20% and 12.40% of hypermethylation CGI, respectively. The fewer hypermethylation CGI were distributed in promoters (4.12%), 3›UTR (1.20%) and 5›UTR (0.52%). With no significant difference with HFG, the hypermethylation CGI were distributed in LFG as follows: 65.45% in distal intergenic regions, 15.85% in exons, 12.90 in introns, 4.01 in promoter, 1.30 in 3›UTR and 0.49% in 3›UTR.
Functional enrichment of methylated genes (DMG)
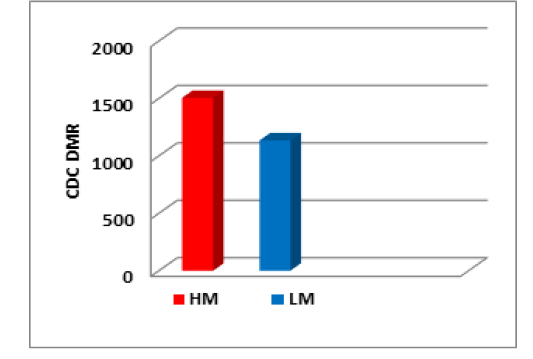
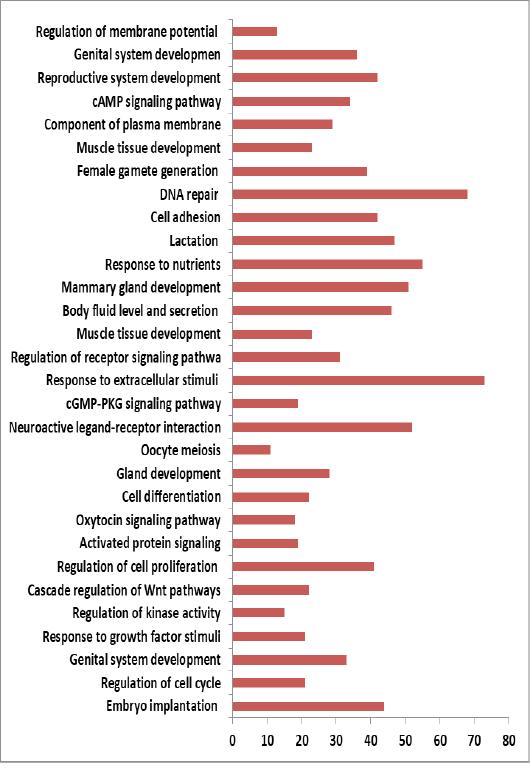
The enrichment analysis declared that some of DMGs are involved in the reproductive system development and many functional pathways which are related to follicle development and other important functional pathways responsible on regulation of growth, hormone production and development. The data declared that DMGs in goat ovaries are associated with the fertility phenomena in both fertility groups. Five-hundred and thirty-six DMGs (Table 4) from these DMRs were further analyzed in both fertility groups into HM (hyper-DMGs in HFG group) and LM (hyper-DMGs in LFG group where there were 1505 and 1135, respectively. The protein-coding regions (CDS) in these DMGs were determined (Figure 3) and enrichment analysis of protein coding regions declared their involvement in different important pathways (Figure 4).
One-hundred and seventy fertility-related genes with different methylation levels were selected for further functional enrichment analysis and the results declared that these genes with their methylation patterns are responsible for the difference in the fertility phenomena between high and low fertility groups (Table 5).
Gene expression of selected DMGs by qRT-PCR
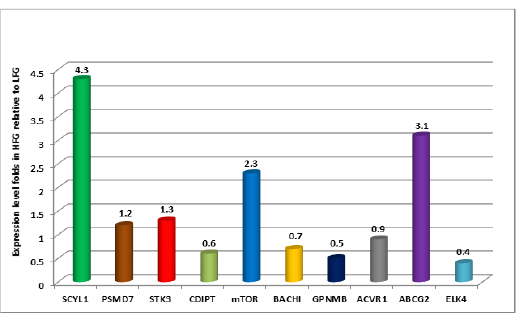
Ten DMGs were randomly selected to assess their gene expression for validation the association between their methylation patterns and the fertility trait. Data were represented as the fold change in target gene expression normalized to GAPDH gene in HFG relative to LFG. The mean cycle threshold (Ct) values of triplicate samples for each gene were calculated and used in data analysis. The results declared that the expressions of five tested DMGs: SCYL1, mTOR, ABCG2, STK3 and PSMD7 were higher in HFG than those in LFG, with significantly level (p<0.01) for SCYL1, mTOR, ABCG2 genes whereas the expressions of STK3 and PSMD7 genes were insignificant increasing (Figure 5). The expressions of other five genes were lower in HFG than those in LFG: GPNMB, ELK4, BACH1 at significant level p<0.01, CDIPT with significant level p<0.05 and ACVR1 with insignificant value. Generally, the qRT-PCR results were concordance with the sequencing data and confirming the reliability of sequencing data.
Discussion
The domestic goat is an important small ruminant which distribute all over the world, especially in desert and semi-desert regions where goat is easier to breed with less expensive than other large livestock (Nowier et al., 2019). The improvement of goat productivity has a respectable role for covering the gap between over-growing populations and adequacy of milk and meat supplies . Production improvements of farm animals can be achieved by using new genetic technology for better selection of heritable traits. Selection has done depending on economically important productivity traits such as disease resistance, fertility performance as well as meat and milk production .
The litter size represents one phenomenon associated with fertility performance in goats and it is related to the healthy reproductive organs and high ovulation rate . DNA methylation is an epigenetic factor which has an important role in gene expression regulation. In farm animals, DNA methylation regulates sexual, ovarian maturation and ovulation rate . Genome-wide bisulfite sequencing was used to explore the methylation profiles of genes which are related to complex trait such as litter size or ovulation rate trait .
The genome-wide methylation levels were assessed in different farm animals which discussed the association between DNA methylation profiles, gene expression and phenotype characters related to production and reproduction traits ; ; . Recently, the DNA methylation profiles in sheep ovaries and their associations with different parameters of fertility trait were described ; ; . Regarding to goat, An et al. (2018) studied the change in the whole-genome methylation profiles between oestrous and dioestrous stages. The present study was focused on the assessment of methylation pattern in the whole genome goat ovaries and its relationship with the difference in litter size and ovulation rate traits. Our results showed a slightly non-significant increase in DNA methylation level in goat ovaries in high fertility group over than that in low fertility group despite the detection of many DMRs and DMGs among the two fertility groups. The similar finding was reported by Kang et al. (2022) who studied the genome-wide DNA methylation pattern in goat ovaries of Chinese Ji›ning grey goats with different litter size groups.
In the present study, most of methylated C was present in CG context and this result agrees with other reports in different species including human , pig , sheep and Chinese Ji›ning grey goats . Our finding declared that the major hypermethylation CGI in Zaraibi goat breed was present in distal intergenic regions followed by exons and interons whereas the lowest frequencies of CGI were in 3›UTR and 5›UTR. These proportions of methylated CGI were nearly like those which were reported in Chinese sheep and goat ; .
One hundred and seventy DFGs were selected for the enrichment analysis and the result showed their role in different biological functions related to fertility. The directionally opposite association between methylation levels of ten selected DMGs and their gene expression was confirmed where SCYL1, mTOR, ABCG2, STK3 and PSMD7 were hypomethylated with highly expression in HFG compared with LFG. On the other hand, GPNMB, ELK4, BACH1, CDIPT and ACVR1 were hypermethylated with decreased expression in HFG than those in LFG. This directionally opposite association between methylation levels of DMGs and their gene expression was also reported by Kang et al. (2022) in goat and by Zhang et al. (2017) in sheep.
Conclusion
It is concluded that DNA methylation patterns of Zaraibi goat ovaries may be responsible for the fertility trait in goats through their important roles in folliculogenesis, oocyte ovulation rate and finally the fertility phenomena. Also, this study confirmed the opposite association between the methylation levels and expressions of differentially methylated genes which are related to fertility phenomena in goats.
Acknowledgements
The authors are grateful for the financial funding by Science, Technology & Innovation Funding Authority (STDF) under grant (STDF 30352).
Conflict of interest
There is absolutely no conflict of interest between the authors of this manuscript and any other scientists or producers.
Funding
This work was financial funded by Science, Technology & Innovation Funding Authority (STDF) under grant (STDF 30352).
novelty statement
To our knowledge, this study is the pioneer one for providing a comprehensive analysis of whole-Genome DNA methylation patterns in goat ovaries which helps for understanding the relation between ovarian DNA methylation and Egyptian goat fertility.
authors contribution
All authors certify that they have participated sufficiently in contributing of the manuscript. Othman E. Othman: Work design, Methodology, Data analysis and Manuscript writing. Lingjiang Min: Work design, Primer providing and Data analysis. Amira M. Nowier: Providing animals and all data associated with their fertility records.
Figures
Figure 1. Figure 1.
Pie charts of the distribution ratios of methylated C in the three contexts
Figure 2.
Pie charts of the distribution ratios of CGI in both high and fertility groups
Figure 3.
Distribution of protein-coding region (CDS) into HM and LM
Figure 4.
The enrichment analysis of protein coding regions (p<0.05)
Figure 5.
The expression level of DMGs as determined by qRT-PCR in HFG relative to LFG
References
Abd-Allah S, Mohamed MI, Shoukry MM (2019). Assessment of the traditional goat production systems in rural areas of the Nile Delta in Egypt. Bull. Natl. Res. Cent. 43: 114. https://doi.org/10.1186/s42269-019-0153-3[CrossRef]
Adamkova K, Yi YJ, Petr J, Zalmanova T, Hoskova K, Jelinkova P (2017). SIRT1-dependent modulation of methylation and acetylation of histone H3 on lysine 9 (H3K9) in the zygotic pronuclei improves porcine embryo development. J. Anim. Sci. Biotech. 8: 83.
Ahlawat S, Sharma R, Maitra A, Tantia MS (2015). Current status of molecular genetics research of goat fecundity. Small Rumin. Res. 125: 34-42.
An X, Ma H, Han P, Zhu C, Cao B, Bai Y (2018). Genome-wide differences in DNA methylation changes in caprine ovaries between oestrous and dioestrous phases. J. Anim. Sci. Biotechnol. 9: 85.
Assan N (2021). Aspects of litter size (birth type) in goats and sheep production. Sci. J. Zool. 9(2): 138-151. https://doi.org/10.14196/sjz.v9i2.1510[CrossRef]
Barboni B, Russo V, Cecconi S, Curini V, Colosimo A, Garofalo MLA, Capacchietti G, Giacinto O, Mattioli M (2011). In vitro grown sheep preantral follicles yield oocytes with normal nuclear-epigenetic maturation. PLoS One. 6(11): e27550. https://doi.org/10.1371/journ al.pone.0027550[CrossRef]
Blow MJ, Clark TA, Daum CG (2016). The epigenomic landscape of prokaryotes. PLoS Genet. 12: e1005854
Breton-Larrivée M, Elder E, McGraw S (2019). DNA methylation, environmental exposures and early embryo development. Anim. Reprod. 16(3): 465-474.
Dai M, Thompson RC, Maher C, Contreras-Galindo R, Kaplan MH, Markovitz DM, Omenn G, Meng F (2010). NGSQC: Cross-platform quality analysis pipeline for deep sequencing data. BMC Genomics. 11 Suppl 4(Suppl 4): S7.
Fan Y, Liang Y, Deng K, Zhang Z, Zhang G, Zhang Y, Wang F (2020). Analysis of DNA methylation profiles during sheep skeletal muscle development using whole-genome bisulfite sequencing. BMC Genomics 21: 327. https://doi.org/10.1186/s12864-020-6751-5[CrossRef]
Frattini S, Capra E, Lazzari B, McKay SD,Coizet B, Talenti A, Groppetti D, Riccaboni P, Pecile A, Chessa S, Castiglioni B, Williams JL, Pagnacco G, Stella A, Crepaldi P (2017). Genome-wide analysis of DNA methylation in hypothalamus and ovary of Capra hircus. BMC Genomics. 18(1): 476.
Greer EL, Blanco MA and Gu L (2015). DNA Methylation on N6-Adenine in C. elegans. Cell. 161: 868-878.
Gutierrez-Reinoso MA, Aponte PM, Garcia-Herreros M (2021). Genomic analysis, progress and future perspectives in dairy cattle selection: A Review. Animals. 11: 599. https://doi.org/10.3390/ani11030599[CrossRef]
Hao Y, Cui Y, Gu X (2016). Genome-wide DNA methylation profiles changes associated with constant heat stress in pigs as measured by bisulfite sequencing. Sci. Rep. 6: 27507. https://doi.org/10.1038/srep2 7507[CrossRef]
Jang HS, Shin WJ, Lee JE, Do JT (2017). CpG and non-CpG methylation in epigenetic gene regulation and brain function. Genes (Basel). 8(6): 148. https://doi.org/10.3390/genes8060148[CrossRef]
Kang B, Wang J, Zhang H, Shen W, Othman OE, Zhao Y, Min L (2022). Genome-wide profile in DNA methylation in goat ovaries of two different litter size populations. J. Anim. Physiol. Anim. Nutr. 00:1-11. https://doi.org/10.1111/jpn.13600[CrossRef]
Kasper DH, Benjamin L, Rafael AI (2012). BSmooth: from whole genome bisulfate sequencing reads to differentially methylated regions. Genome Biol. 13(10): R83.
Lai F, Zhai H, Cheng M, Ma J, Cheng S, Ge W, Zhang G, Wang J, Zhang R, Wang X, Min L, Song J, Shen W (2016). Whole-genome scanning for the litter size trait associated genes and SNPs under selection in dairy goat (Capra hircus). Sci. Rep. 6: 38096. https://doi.org/10.1038/srep38096[CrossRef]
Lister R, Pelizzola M, Kida YS, Hawkins RD, Nery JR, Hon G, Antosiewiczbourget J, O›Malley R, Castanon R, Klugman S (2014). Hotspots of aberrant epigenomic reprogramming in human induced pluripotent stem cells. Nature. 514(7520):68–73.
Liu B, Pilarsky C (2018). Analysis of DNA hypermethylation in pancreatic cancer using methylation-specific PCR and bisulfite sequencing. Methods Mol. Biol. 1856: 269-282.
Livak KJ, Schmittgen TD (2001). Analysis of relative gene expression data using real-time quantitative PCR and the 2-∆∆Ct method. Methods. 4: 402-408.
Miller BA, Lu CD (2019). Current status of global dairy goat production: an overview. Asian-Australas J. Anim. Sci. 32: 1219-1232 https://doi.org/10.5713/ajas.19.0253[CrossRef]
Ming X, Zhu B, Li Y (2021). Mitotic inheritance of DNA methylation: more than just copy and past. J. Genet. Genom. 48(1): 1-13. https://doi.org/10.1016/j.jgg.2021.01.006.[CrossRef]
Nowier AM, Darwish HR, Ramadan SI, El-Maaty NA, Othman OE (2021). Polymorphism detection in alpha-lactalbumin gene and its association with some productive traits in Egyptian goats. Pakistan J. Zool. 53:
Russo V, Bernabò N, Di Giacinto O, Martelli A, Mauro A, Berardinelli P, Curini V, Nardinocchi D, Mattioli M, Barboni B (2013). H3K9 trimethylation precedes DNA methylation during sheep oogenesis: HDAC1, SUV39H1, G9a, HP1, and Dnmts Are Involved in These Epigenetic Events. J. Histochem. Cytochem. J Histochem Cytochem. 61(1), 75–89. https://doi.org/10.1369/00221 55412 463923[CrossRef]
Teixeira A, Silva S, Guedes C, Rodrigues S (2020). Sheep and goat meat processed products quality: A Review. Foods. 9: 960. https://doi.org/10.3390/foods9070960[CrossRef]
Vento-Tormo R, Company C, Rodriguez-Ubreva J, de la Rica L, Urquiza JM, Javierre BM (2016). IL-4 orchestrates STAT6-mediated DNA demethylation leading to dendritic cell differentiation. Genome Biol. 17:4.
Zhang Y, Li F, Feng X, Yang H, Zhu A, Pang J, Han L, Zhang T, Yao X, Wang F (2017). Genome-wide analysis of DNA Methylation profiles on sheep ovaries associated with prolificacy using whole-genome Bisulfite sequencing. BMC Genomics. 18: 759. https://doi.org/10.1186/s12864-017-4068-9[CrossRef]
Zhou Y, Zhou B, Pache L, Chang M, Khodabakhshi HA, Tanaseichuk O, Benner C, Chanda SK (2019). Metascape provides a biologist-oriented resource for the analysis of systems-level datasets. Nat. Commun. 10(1): 1523.