
DNA methylation biomarkers offer promising avenues for the early detection of breast cancer (BC), especially in difficult-to-diagnose subtypes such as triple-negative breast cancer (TNBC). In this study, we investigated the methylation status and gene expression profiles of FGFR1 and FGF2 in a panel of 11 breast cancer cell lines and BC patient-derived tissues. Combined Bisulfite Restriction Analysis (COBRA), qPCR, Western blotting, immunohistochemistry (IHC), and bioinformatic analyses using TCGA data were employed. FGFR1 and FGF2 exhibited variable expression levels across luminal, HER2-enriched, and basal-like TNBC cell lines. Methylation at the promoter region of FGF2 was detected in a limited subset (MCF7), while FGFR1 showed minimal promoter methylation. A significant inverse correlation was observed between gene expression and methylation for both FGFR1 and FGF2. IHC confirmed strong cytoplasmic expression of FGFR1 and FGF2 in tumour tissues compared to the normal counterpart. Furthermore, ROC analysis demonstrated high diagnostic accuracy for FGFR1 (AUC = 0.88) and FGF2 (AUC = 0.86). Bioinformatic analysis supported the clinical relevance of these markers, highlighting their prognostic significance and pathway enrichment in cancer progression. These findings underscore the potential of FGFR1 and FGF2 as epigenetic biomarkers for breast cancer detection and stratification.
Research Article · Volume 58, Issue 6, 25 September 2026 · Open Access
DNA Methylation Biomarkers for Diagnosis of Breast Cancer: Focus on FGFR1 and FGF2
· · · ·
Affiliations & Notes ⌄
- 1School of Biological Sciences, University of the Punjab, Lahore, Pakistan 2School of Biochemistry and Biotechnology. University of the Punjab, Lahore, Pakistan 3Biosciences Institute, Newcastle University Cancer Centre, United Kingdom * Corresponding author: naveed.sbs@pu.edu.pk
Article Info ⌄
- Journal:
- Pakistan Journal of Zoology
- Published:
- 25 September 2026

From the article
- Our research underscores the growing importance of FGFR1 and FGF2 as epigenetic biomarkers in breast cancer.
- The study further elaborates on how methylation patterns and gene expression levels of FGFR1 and FGF2 can offer new insight into breast cancer subtype biology.
- MDA-MB-231 and MDA-MB-468 cell lines showed high FGF2 expression tied to low promoter methylation, reflecting their aggressive phenotype.
- Clinically, the translational impact of FGFR1 and FGF2 as biomarkers is significant.
Selected from the article's own text.
Abstract
Introduction
Breast cancer continues to be the most frequently diagnosed cancer in women globally, with approximately 2.5 million new cases and 720,000 deaths projected in 2025 . This growing incidence highlights the urgent need for enhanced early detection strategies. Although molecular diagnostics have enhanced our ability to classify subtypes, triple-negative breast cancer (TNBC) remains particularly difficult to treat due to a lack of effective therapeutic targets.
Epigenetic mechanisms, especially DNA methylation, have emerged as key contributors to cancer development and progression. Hypermethylation in gene promoters often leads to the silencing of tumor suppressor genes, making this an attractive route for identifying novel biomarkers . DNA methylation assays offer distinct advantages, including chemical stability and compatibility with cell-free DNA (cfDNA), enabling non-invasive diagnostic applications . DNA methylation biomarkers offer distinct benefits over traditional RNA- or protein-based approaches. Their chemical robustness, detectability in minute DNA samples, and adaptability to various specimen types, including cfDNA and formalin-fixed tissues, make them highly promising . Numerous investigations have identified differentially methylated regions (DMRs) linked to breast cancer subtypes, stages, and outcomes . Early work by Widschwendter and Jones (2002) highlighted unique methylation patterns in tumor versus normal tissue, a foundation furthered by recent high-throughput studies ; .
FGFR1 and FGF2 are pivotal to the FGF signaling axis, which governs cellular proliferation, migration, angiogenesis, and survival. Disruptions in this pathway are implicated in several cancers, including breast cancer . FGFR1 amplification, observed in approximately 10% of ER+ cases, is associated with therapy resistance and a poor prognosis . FGF2, a potent pro-angiogenic factor, is similarly overexpressed in more aggressive breast cancer types . Despite their known roles, the methylation-driven regulation of these genes remains inadequately explored . Within the fibroblast growth factor (FGF) signaling pathway, FGFR1 and FGF2 are central to processes like angiogenesis, proliferation, and metastasis. FGFR1 amplification is common in estrogen receptor-positive (ER+) tumors, while elevated FGF2 expression is linked to more aggressive cancer phenotypes ; . Multi-omics analyses demonstrate that FGF2 and FGFR1 are co-expressed in basal-like and HER2-enriched breast cancers, supporting their potential as diagnostic biomarkers ; . The interplay between FGF2 and FGFR1, particularly within the tumor microenvironment, appears to drive TNBC progression and resistance to therapy .
Appreciating the role of FGFR1 and FGF2 in breast cancer progression, we set out to explore whether their epigenetic regulation can be exploited for diagnosis and/ or targeted treatment of the distinct breast cancer subtypes. This study focuses on three primary objectives: (1) evaluating promoter methylation levels of FGFR1 and FGF2 across different breast cancer subtypes; (2) assessing the relationship between methylation status and gene/protein expression; and (3) determining their viability as early diagnostic and stratification biomarkers.
In summary, this work combines experimental and computational analyses to characterize FGFR1 and FGF2 methylation patterns in breast cancer. These insights advance the growing field of epigenetic biomarkers and could support more precise diagnostic and therapeutic strategies, particularly for TNBC, where options remain limited.
Materials and Methods
Patient samples
Breast tumor specimens were obtained from 60 patients diagnosed with breast cancer through histopathological confirmation, all of whom underwent surgical resection at Mayo Hospital, Lahore, Pakistan. Written informed consent was secured from each participant before sample collection.
Samples were classified based on hormone receptor status (ER, PR) and HER2 expression via immunohistochemical staining. Further categorization included histological subtypes such as invasive ductal carcinoma (IDC), invasive lobular carcinoma (ILC), and others. Freshly excised tumors were promptly snap-frozen in liquid nitrogen and stored at −80°C to maintain RNA and protein integrity for downstream analyses. Detailed clinicopathological data, including age, tumor grade, stage, receptor status, and histological classification, are presented in Table I.
Table I. Clinicopathological characteristics of breast cancer samples.
|
Parameter |
Number of patients (n = 60) |
Percentage (%) |
|
Age (Mean ± SD) |
52.6 ± 9.8 |
|
|
Tumor grade |
||
|
Grade I |
10 |
16.7% |
|
Grade II |
27 |
45.0% |
|
Grade III |
23 |
38.3% |
|
ER status |
||
|
Positive |
39 |
65.0% |
|
Negative |
21 |
35.0% |
|
PR status |
||
|
Positive |
34 |
56.7% |
|
Negative |
26 |
43.3% |
|
HER2 status |
||
|
Positive |
14 |
23.3% |
|
Negative |
46 |
76.7% |
|
Molecular subtype |
||
|
Luminal A |
24 |
40.0% |
|
Luminal B |
15 |
25.0% |
|
HER2-enriched |
8 |
13.3% |
|
Triple-negative (TNBC) |
13 |
21.7% |
Cell lines and culture conditions
A panel of eleven breast cell lines, each reflecting distinct molecular subtypes, was examined. This included luminal types (MCF7, T47D), HER2-enriched lines (SK-Br-3, HCC1569), and basal-like or triple-negative models (Cal-51, MDA-MB-231, MDA-MB-436, MDA-MB-468, HCC1806, HCC1937). The non-tumorigenic epithelial line MCF10A was also included. All cell lines were sourced from the American Type Culture Collection (ATCC) and authenticated through short tandem repeat (STR) profiling.
Breast cancer cell lines were cultured in tailored media: MCF7 in MEM Eagle with 10% FCS and supplements; T47D and HCC1569 in RPMI-1640 (HCC1569 + sodium pyruvate); Cal-51, MDA-MB-231 (DMEM/F-12), MDA-MB-436 (high-glucose DMEM + pyruvate), and SK-Br-3 (high-glucose DMEM) in DMEM-based media; MDA-MB-468 in low-glucose DMEM + pyruvate; HCC1806 and HCC1937 in RPMI-1640; and MCF10A in DMEM/F12 with 5% horse serum and growth factors. All cells were maintained at 37°C/5% CO₂, harvested at 70–80% confluency, and screened for mycoplasma. HCC1569 was excluded from methylation-expression analysis due to incomplete data.
Data mining and selection of candidate genes for methylation analysis
A literature-search data mining strategy was employed to identify potential candidate genes suitable for DNA methylation analysis in breast cancer. The approach kicked off with a systematic exploration of publicly accessible DNA methylation datasets, followed by a selection process to highlight genes with possible epigenetic significance.
To strengthen the selection framework, a comprehensive review of the literature was carried out, focusing on robust breast cancer studies that had analyzed DNA methylation profiles. A summary of the studies included can be found in Supplementary Table I. To maintain consistency and ensure comparability across datasets, several preprocessing steps were applied to the methylation data. These included normalization of beta values to reduce platform-specific bias, exclusion of probes with missing or unreliable detection values, and mapping of CpG sites to their respective genes using the most recent genome build annotations, such as hg38.
Differentially methylated genes (DMGs) were pinpointed by contrasting methylation profiles between breast cancer samples and normal controls. CpG sites showing a methylation shift (Δβ) of 0.2 or greater were flagged as significant. To uphold statistical integrity, a Benjamini-Hochberg corrected p-value threshold of less than 0.05 was employed to account for multiple testing.
To further narrow down the gene list for downstream analysis, a functional enrichment analysis was conducted using WebGestalt (WEB-based GEne SeT AnaLysis Toolkit). The DMGs were evaluated across gene ontology (GO) categories, namely biological process (BP), molecular function (MF), and cellular component (CC), as well as through KEGG and reactome pathways. Significance was determined based on a p-value cutoff of < 0.05 and an FDR threshold below 0.1.
Bisulfite conversion and combined bisulfite restriction analysis (COBRA)
Genomic DNA was extracted from tissues and cell lines using the QIAamp DNA Mini Kit (Qiagen), following the manufacturer’s guidelines. DNA quantity and quality were confirmed using a NanoDrop 2000 spectrophotometer (Thermo Fisher Scientific) and 1% agarose gel electrophoresis. For methylation studies, 500 ng of genomic DNA underwent bisulfite conversion using the EpiTect Bisulfite Kit (Qiagen), which converts unmethylated cytosines to uracil while preserving methylated cytosines. Additionally, in-vitro human methylated DNA obtained from Cambridge Biosciences (Cat. # D5011) was used as a positive control.
Custom-designed primers targeted CpG-rich regions in the promoter areas of FGFR1 and FGF2. Primer sequences for FGFR1 and FGF2 are listed in Supplementary Table II. PCR-amplified products from bisulfite-converted DNA were digested with the methylation-sensitive restriction enzyme TaqI-v2 (New England Biolabs). Digested DNA fragments were separated on 2% agarose gels, stained with GelRed® Nucleic Acid Gel Stain, 10,000X in water and visualized using Licor Odyssey FC Imaging System. Banding patterns were interpreted to determine methylation levels.
Gene expression analysis by quantitative PCR
Quantitative PCR (qPCR) was conducted to evaluate baseline expression levels of FGFR1 and FGF2 in breast cancer cell lines, with GAPDH used as the internal control. Total RNA extraction was performed using the PureLink™ RNA Mini Kit (Thermo Fisher Scientific, catalogue #12183018A), followed by DNase treatment using the RNase-Free DNase Set (Qiagen, catalogue #79254) to eliminate genomic DNA. RNA integrity and concentration were evaluated using a NanoDrop and agarose gel electrophoresis. First-strand cDNA was synthesized from 1 µg of RNA using the RevertAid First Strand cDNA Synthesis Kit (Thermo Scientific catalogue #4368814), according to the manufacturer’s protocol.
qPCR was conducted using the Platinum™ SYBR™ Green qPCR SuperMix-UDG with ROX (Thermo Fisher Scientific, catalogue #11744500) on a StepOnePlus Real-Time PCR system. Primer sequences for FGFR1 and FGF2 are listed in Supplementary Table II. GAPDH served as the endogenous control. Relative expression levels were calculated using the 2-ΔΔCt method, and all reactions were run in triplicate. All procedures were carried out in line with the respective manufacturers protocols.
Western blotting
Proteins were extracted using RIPA buffer enriched with protease and phosphatase inhibitors (Roche). Concentrations were quantified using the BCA assay (Thermo Fisher). Equal amounts of protein (30–50 µg) were denatured, resolved via SDS-PAGE, and transferred to PVDF membranes.
Membranes were blocked with 5% non-fat dry milk in TBST and incubated overnight at 4°C with primary antibodies for FGFR1 (Abcam Ab10646) and FGF2 (Abcam Ab92337). Following washes, membranes were treated with HRP-conjugated secondary antibodies and developed using ECL reagents. Signal intensity was quantified using ImageJ software.
Immunohistochemistry (IHC)
To carry out IHC, tissue blocks, previously formalin-fixed and embedded in paraffin (FFPE), were sourced from Ganga Ram Hospital’s archive, with additional samples processed similarly at Newcastle University. All specimens underwent manual hematoxylin and eosin (H and E) staining, followed by review by an expert histopathologist. Only samples with adequate cellularity were included; those largely composed of adipose tissue were excluded.
Prostate tissue was used as the positive control for IHC, consistent with prior literature. The primary antibodies utilized were FGFR1 (Abcam, catalog #Ab10646, 1:2000 dilution) and FGF2 (Abcam, catalog #Ab92337, 1:1000 dilution). Protocol optimization involved comparing CC1 (160474, Lot 40434) and CC2 (160424, Lot 40434), with CC2 chosen for both antibodies. ISH Protease incubation times (8, 20, 32 min) were tested for FGFR1, and 20 min was deemed optimal. Staining was performed using a Ventana automated system.
Post-staining, slides were digitized using the Aperio Scan System (Leica Scanscope Console) and analyzed with Aperio ImageScope. Analysis included quantifying cell numbers and expression positivity, with semi-quantitative scoring (i.e., 0 to +3 scale) applied in collaboration with a histopathologist.
Bioinformatics analysis
To expand on experimental findings, datasets from The Cancer Genome Atlas (TCGA) were mined for FGFR1 and FGF2 methylation and expression profiles. Tools such as UALCAN, GEPIA, and cBioPortal facilitated visualization of gene expression and clinical correlations. Gene ontology and KEGG pathway analyses were carried out using DAVID and GSEA, respectively, to explore functional associations. Correlation analysis was performed using Pearson’s method.
Statistical analysis
All statistical analyses were performed using GraphPad Prism version 9.0 and IBM SPSS Statistics version 26.0. Results are expressed as mean ± standard error of the mean (SEM), unless indicated otherwise. Comparisons between two groups were made using Student’s t-test, while one-way ANOVA followed by Tukey’s post hoc test was applied for analyses involving multiple groups. Pearson’s correlation coefficient was used to examine associations between DNA methylation and gene expression. Diagnostic utility was assessed using receiver operating characteristic (ROC) curve analysis. A p-value of less than 0.05 was considered statistically significant.
Results
Selection of candidate genes for methylation analysis
After a comprehensive literature review, we identified seven key studies that profiled DNA methylation in breast cancer, utilising various platforms, including the Illumina GoldenGate Methylation Cancer Panel I, the Illumina HumanMethylation 27 BeadChip, and Agilent 60-k CpG arrays. Collectively, these studies analyzed 1,032 breast cancer samples and 59 normal breast tissues, covering an extensive range of CpG sites and genes. Initially, 1,210 genes were flagged based on their methylation status in breast cancer tissues versus normal controls. This list was refined using strict filtering criteria, selecting genes with a methylation difference (Δβ) of ≥ 0.2 (20%) and a p-value < 0.05, adjusted for multiple testing via the Benjamini-Hochberg method. Following this filtering process, 1,060 unique Entrez gene IDs were mapped to the identified DMGs, with 591 genes annotated under cancer-relevant functional categories.
For gene prioritization, over-representation analysis (ORA) for Homo sapiens, with a statistical cutoff of p-value < 0.05 and FDR < 0.1, revealed 10 significantly enriched pathways, including those associated with cancer, stem cell pluripotency, and cell signaling. Notably, the MAPK signaling pathway and breast cancer metastasis pathway emerged as key areas of interest due to their direct involvement in breast cancer biology. Table II summarizes the results of the functional enrichment analysis, highlighting the top-enriched pathways and their significance.
Table II. Functional pathways enriched by FGFR1/FGF2 expression (KEGG/GO analysis).
|
Pathway/Term |
Enriched genes |
p value |
FDR |
|
PI3K-Akt signaling |
FGFR1, FGF2, AKT1 |
1.2e-04 |
0.003 |
|
MAPK signaling pathway |
FGFR1, FGF2, MAPK1 |
3.5e-05 |
0.001 |
|
Angiogenesis (GO:0001525) |
FGF2, VEGFA |
5.1e-03 |
0.015 |
|
Cell proliferation |
FGFR1, FGF2, MYC |
8.7e-04 |
0.006 |
|
Breast cancer pathway (hsa05224) |
FGFR1, FGF2 |
2.3e-04 |
0.004 |
Methylation status of FGFR1 and FGF2 in breast cancer cell lines
DNA methylation analysis using the COBRA technique revealed a predominant hypomethylation for the FGFR1 promoter across all tested breast cancer cell lines, including both luminal and triple-negative subtypes (Fig. 1A). In contrast, FGF2 promoter methylation was consistently observed in MCF7, a luminal subtype cell line, suggesting subtype-specific epigenetic regulation (Fig. 1B). A heatmap representation of methylation status highlights the consistent hypomethylated pattern for FGFR1 and sporadic FGF2 methylation (Fig. 1C). The positive control (Human fully methylated DNA) validated enzyme specificity and assay sensitivity. These findings indicated that while FGFR1 is not epigenetically silenced via promoter methylation in most cell models, FGF2 may be subjected to differential methylation, particularly in estrogen receptor-positive breast cancers.
Differential gene expression patterns in breast cancer cell lines
Quantitative analysis revealed striking subtype-dependent expression patterns for FGFR1 and FGF2. FGFR1 showed pronounced overexpression in aggressive subtypes, peaking in triple-negative MDA-MB-231 (mRNA highest) and HER2-enriched SK-BR-3, while luminal models (MCF7, T47D) exhibited significantly reduced expression. This pattern extended to protein levels, where triple-negative lines consistently showed strong FGFR1 expression except in MDA-MB-231 (lowest protein despite high mRNA), suggesting post-translational regulation. FGF2 displayed complementary yet distinct behavior. Highest mRNA expression occurred in triple-negative MDA-MB-436, with notable elevation in MDA-MB-231 and MDA-MB-468. Strikingly, luminal lines (MCF7, T47D) showed complete transcriptional silencing, consistent with observed promoter hypermethylation. The non-tumorigenic epithelial line MCF-10A served as a reference point, showing baseline expression levels (Fig. 2A). This contrasting expression profile between luminal and triple-negative subtypes points toward a potential role for FGFR1 and FGF2 in more aggressive tumor behaviors.
Correlation between methylation and gene expression
To explore whether promoter methylation might be contributing to gene silencing, Pearson correlation analyses were conducted. The results revealed a negative correlation between promoter methylation and gene expression for both FGFR1 (r = −0.48, p = 0.12) and FGF2 (r = −0.53, p = 0.07). Although these correlations did not reach statistical significance, the observed trends imply that epigenetic repression could be involved in gene downregulation, especially within luminal subtypes.
Protein expression validation by western blot
Western blot analysis corroborated the transcript-level expression patterns, with elevated FGFR1 and FGF2 protein levels observed in triple-negative and HER2-enriched cell lines. The highest expression was noted in HCC1937, MDA-MB-231, and MDA-MB-436 (Fig. 2B). Densitometry measurements, normalized to GAPDH, confirmed the trend: MCF7 and T-47D showed minimal protein abundance, while FGFR1 levels in HCC1937 were 5.8 times higher than in MCF10A (Fig. 2C).
Together, the qPCR and Western blot findings reinforce the idea that these genes are post-transcriptionally active in aggressive subtypes, potentially influenced by promoter methylation.
Immunohistochemical staining and ROC analysis
IHC revealed strong cytoplasmic staining of FGFR1 and FGF2 in tumor tissues versus adjacent normal. The negative (0) to strong (+3) expression of FGFR1 and FGF2 in representative breast cancer samples is depicted in Figure 3A. FGFR1 positivity was identified in 25% of the cases (n=15), while FGF2 was expressed in 23% (n=14). Tumors positive for FGFR1 were more likely to present with high-grade histology; 60% were grade 3 compared to 42% among FGFR1-negative tumors (p=0.22). Additionally, FGFR1 expression was less frequent in Luminal A subtypes (27% vs. 44%, p=0.047), though no significant associations emerged regarding age, tumor size, or lymph node status.
As for FGF2-positive tumors, they tended to be larger (71% T2+ versus 57% in FGF2-negative cases, p=0.32) and more often HER2-positive (29% vs. 17%, p=0.35). Notably, FGF2 expression was substantially less common in Luminal A tumors (14% vs. 48%, p=0.022). Co-expression of FGFR1 and FGF2, observed in 8% of the cohort (n=5), was mostly found in aggressive molecular subtypes such as Luminal B, HER2-positive, and triple-negative breast cancers. In contrast, the dual-negative group (n=35, 58%) was predominantly composed of Luminal A cases. The correlation of FGFR1 and FGF2 expression with clinical subtypes of breast cancer has been summarized in Table IV.
Table III. Gene and protein expression of FGFR1 and FGF2.
|
Cell line/ Sample |
FGFR1 mRNA (fold change) |
FGF2 mRNA (fold change) |
FGFR1 protein (WB) |
FGF2 protein (WB) |
|
MCF-7 |
↓ 0.4 |
↓ 0.3 |
Low |
Low |
|
MDA-MB-231 |
↑ 2.5 |
↑ 2.8 |
High |
High |
|
T-47D |
↓ 0.6 |
↓ 0.5 |
Low |
Low |
|
Hs578T |
↑ 2.1 |
↑ 1.9 |
High |
Moderate |
|
SK-BR-3 |
↑ 1.8 |
↑ 1.5 |
High |
Moderate |
|
MCF10A |
1.0 (Baseline) |
1.0 (Baseline) |
Control |
Control |
“↑” indicates upregulation, “↓” indicates downregulation
ROC analysis demonstrated high diagnostic accuracy: FGFR1 (AUC=0.88, sensitivity= 82%, specificity= 85%) and FGF2 (AUC= 0.86, sensitivity= 79%, specificity= 83%) (Fig. 3B, C, Table V). A combined methylation-expression panel improved diagnostic accuracy (AUC = 0.91).
Table IV. Correlation of patient and tumor characteristics with FGFR1 and FGF2 expression.
|
Characteristic |
All (n=60) |
FGFR1 Negative (n=45) |
FGFR1 Positive (n=15) |
p-value (FGFR1) |
FGF2 Negative (n=46) |
FGF2 Positive (n=14) |
p-value (FGF2) |
|
Age at diagnosis (median, IQR) |
52 (43–60) |
52 (42–59) |
53 (47–61) |
0.456 |
51 (42–59) |
55 (48–62) |
0.210 |
|
Age ≤50 years (%) |
32 (53) |
25 (56) |
7 (47) |
0.541 |
26 (57) |
6 (43) |
0.370 |
|
Tumor size >20 mm (T2+) (%) |
36 (60) |
27 (60) |
9 (60) |
1.000 |
26 (57) |
10 (71) |
0.320 |
|
Nodal positivity (N+) (%) |
22 (37) |
16 (36) |
6 (40) |
0.763 |
16 (35) |
6 (43) |
0.580 |
|
Histological grade 3 (%) |
28 (47) |
19 (42) |
9 (60) |
0.220 |
19 (41) |
9 (64) |
0.130 |
|
ER-negative (%) |
18 (30) |
13 (29) |
5 (33) |
0.740 |
12 (26) |
6 (43) |
0.220 |
|
PR-negative (%) |
24 (40) |
17 (38) |
7 (47) |
0.530 |
16 (35) |
8 (57) |
0.130 |
|
HER2-positive (%) |
12 (20) |
9 (20) |
3 (20) |
1.000 |
8 (17) |
4 (29) |
0.350 |
|
Molecular subtypes (%) |
|||||||
|
- Luminal A-like |
24 (40) |
20 (44) |
4 (27) |
0.047 |
22 (48) |
2 (14) |
0.022 |
|
- Luminal B-like |
18 (30) |
12 (27) |
6 (40) |
0.047 |
12 (26) |
6 (43) |
0.022 |
|
- HER2-positive |
12 (20) |
9 (20) |
3 (20) |
0.047 |
8 (17) |
4 (29) |
0.022 |
|
- Triple-negative (TNBC) |
6 (10) |
4 (9) |
2 (13) |
0.047 |
4 (9) |
2 (14) |
0.022 |
Table V. ROC analysis for diagnostic performance.
|
Marker |
AUC |
Sensitivity (%) |
Specificity (%) |
PPV (%) |
NPV (%) |
|
FGFR1 |
0.88 |
85 |
80 |
81.0 |
84.0 |
|
FGF2 |
0.86 |
83 |
78 |
79.5 |
82.3 |
|
Combined panel |
0.91 |
88 |
85 |
86.5 |
87.8 |
In silico analysis of FGFR1 and FGF2 expression in breast cancer
The multi-omics profile of FGFR1 retrieved from Depmap (https://depmap.org/portal/) across breast cancer cell lines uncovers a spectrum of promoter methylation, ranging from 0.2981 in CAL51 up to 0.76229 in HCC1569. Notably, HCC1569 and HCC1937 emerge with the highest methylation levels (≥0.74). Gene expression, on the other hand, spans broadly, from as low as 0.992768 in SKBR3 to a peak of 6.086826 in MDA-MB-231. Among these, MDAMB231 and CAL51 stand out with the highest expression levels (>6.0), while SKBR3 and HCC1806 show minimal expression (<1.0). Protein abundance trends similarly, with values stretching from -0.90923 in MCF7 to 1.227451 in CAL51. Elevated protein levels are seen in CAL51 and MDAMB436 (>0.7), whereas MCF7 and MDAMB468 display significant depletion (<-0.9). An inverse relationship between methylation and expression is apparent; highly methylated lines like HCC1569 and HCC1937 exhibit lower gene expression (3.36–4.65), reinforcing the role of epigenetic silencing. Still, MDAMB231 deviates from this pattern, showing moderate methylation (0.525) yet the highest expression (6.09), hinting at alternative regulatory influences.
In the case of FGF2, promoter methylation values show a binary distribution, ranging from 0 in CAL51, HCC1937, and MDA-MB-436, to a full 1.0 in MCF7. High methylation (≥0.86) dominates in MCF7, SKBR3, and MDAMB231. Expression levels are correspondingly diverse, from a near-silent 0.056584 in MCF7 and T47D to a pronounced 4.792855 in MDAMB436. The highest expression is observed in MDA-MB-436 and HCC1937 (>4.7), while MCF7, T47D, and SKBR3 remain largely inactive (<0.07). Protein data reveals a dramatic range, from -3.09341 in T47D to a striking 4.847623 in MDAMB231. Despite its low mRNA levels (0.11), MDA-MB-231 exhibits excessive protein levels (4.85), pointing to post-transcriptional modulation. Fully methylated lines like MCF7 and SKBR3 exhibit negligible FGF2 expression, whereas low-methylation lines, CAL51, HCC-1937, and MDA-MB-436, generally show higher expression, though CAL51 deviates with low RNA and detectable protein.
A side-by-side comparison of FGFR1 and FGF2 reveals distinct methylation dynamics (depicted in Fig. 3D, E): FGFR1 shows a gradual distribution (0.3–0.76), whereas FGF2 reflects a binary state (0 or 1). The data also highlights expression mismatches, particularly in MDAMB231, where high FGFR1 RNA and protein contrast sharply with low FGF2 RNA, suggesting a ligand-independent FGFR1 activation mechanism. Meanwhile, HCC1937’s high FGF2 RNA paired with low FGFR1 protein implies possible paracrine signaling. Together, these patterns reflect subtype-specific epigenetic regulation of FGFR1/FGF2, emphasizing the therapeutic potential in targeting low-methylation, high-expression contexts like MDAMB231. Notably, gaps in proteomic data for some lines (e.g., SKBR3, HCC1569) underscore the need for further experimental validation.
To enhance molecular insight into the roles of FGFR1 and FGF2 in breast cancer, interconnected bioinformatics analyses were performed, each capturing a different dimension of gene function, interaction, and epigenetic control. PPI network analysis (Fig. 4A) positioned FGFR1 as the signaling nexus connecting proliferation drivers (FRS2, STAT3, PI3K) and survival pathways (GRB2, PLCγ1). FGF2 formed a distinct angiogenic cluster with VEGFA and FGF family proteins (Fig. 3A). KEGG pathway mapping confirmed these dual oncogenic roles: FGF2 engagement triggers RAS-ERK-mediated cell cycling (via cyclin D1) and PI3K-AKT-driven therapy resistance (Fig. 4B).
TCGA methylation heatmaps solidified the subtype-specific regulation pattern: Luminal A/HER2- tumors showed promoter hypermethylation and gene suppression, while TNBCs maintained hypomethylated, transcriptionally active states (Fig. 4C). These epigenetic configurations functionally stratify tumors - hypomethylated FGFR1/FGF2 defines an aggressive phenotype targetable with pathway inhibitors. These patterns suggest that promoter methylation serves as a regulatory switch, repressing gene activity in less aggressive subtypes while lifting suppression in more proliferative, therapy-resistant forms like TNBC.
Discussion
Our research underscores the growing importance of FGFR1 and FGF2 as epigenetic biomarkers in breast cancer. Although promoter methylation was detected at minimal levels in most breast cancer cell lines, our data; reinforced by computational analyses point to a subtype-specific expression pattern that carries meaningful clinical relevance.
Recent findings have shown that FGF2 expression is modulated not only by DNA methylation but also by m6A RNA methylation, particularly via YTHDF3, which boosts its oncogenic potential in breast cancer settings ; . In addition, tumor-associated fibroblasts in the tumor microenvironment secrete FGF2, activating FGFR1 through paracrine signaling and thereby driving tumor progression ; .
While COBRA assays offered foundational insights into promoter methylation, they lacked the sensitivity of more advanced methods like pyrosequencing or bisulfite sequencing as adopted by Li et al. (2023). Future efforts should aim to integrate functional assays (e.g., CRISPR/dCas9 demethylation) to solidify the causal links between methylation status and gene expression, as suggested by Huang et al. (2024).
Low promoter methylation across most breast cancer cell lines, as seen in our results, parallels findings by Manoochehri et al. (2022), who also reported sparse methylation in TNBC primary tumors via cfDNA-based methods. Their panel of 15 methylation markers achieved over 75% sensitivity in detecting TNBC, underscoring the feasibility of liquid biopsy applications . Though our COBRA assay detected low methylation signals in MCF7 and HCC1569 cells for FGF2 and FGFR1, respectively, this might reflect intratumoral heterogeneity or culture-induced epigenetic plasticity . Crucially, our data support the trend where lower methylation levels correspond to increased mRNA and protein expression, particularly in aggressive subtypes like TNBC, which is quite similar to the findings of Gong et al. (2024).
Our observations echo those of Shan et al. (2024), who reported elevated FGFR1 activity in triple-negative breast cancer (TNBC), now under clinical evaluation for targeted inhibition (NCT05309395). This underscores the translational value of assessing FGFR1 and FGF2 methylation status in non-invasive assays such as cfDNA-based diagnostics .
We consistently observed overexpression of FGFR1 and FGF2 across aggressive subtypes, both at the transcript and protein levels, corroborated through IHC and TCGA data analysis which are in line with the results of Ye et al. (2023). Notably, ROC curve analyses indicated strong diagnostic potential, with AUCs surpassing 0.85 for individual markers and reaching 0.91 in combinational solid basis for inclusion in multiplex diagnostic platforms .
Altogether, our findings enhance the understanding of FGFR1 and FGF2 as subtype-informative biomarkers, suggesting their broader utility in early detection, therapeutic stratification, and precision targeting of TNBC and HER2-enriched tumors as proposed by Fleischer et al. (2023).
The study further elaborates on how methylation patterns and gene expression levels of FGFR1 and FGF2 can offer new insight into breast cancer subtype biology. Our integrated approach, combining benchwork with bioinformatics, demonstrates that methylation dynamics of these genes play a pivotal role in driving phenotypic heterogeneity in breast cancer and these results are consistent with a recent study conducted by Zhang et al. (2024).
Previous studies indicate FGFR1 amplification in 10–15% of breast cancers, especially luminal B subtypes, often linked with resistance to hormone therapy . Yet, we observed elevated FGFR1 expression in TNBC models, suggesting that, beyond gene amplification, epigenetic regulation could be a key activation mechanism supported by Shan et al. (2024). This also aligns with findings from Katoh and Nakagama (2014), who discussed FGFR1’s role across both hormone receptor-positive and -negative contexts in supporting cell proliferation and survival.
Similarly, FGF2, a pro-angiogenic factor, is known to correlate with poor clinical outcomes in several cancers, including breast cancer. According to Zhang et al. (2020), FGF2 methylation patterns directly impact its gene expression and disease trajectory. Our results are in agreement with Wang et al. (2023). MDA-MB-231 and MDA-MB-468 cell lines showed high FGF2 expression tied to low promoter methylation, reflecting their aggressive phenotype.
Western blot data further confirmed elevated FGFR1 and FGF2 protein expression in basal-like and HER2-enriched lines. These observations were in line with TCGA and DepMap analyses, reinforcing their overexpression in aggressive breast cancer forms and are in consistent agreement with Ye et al. (2023). Of note, ROC analysis highlighted their robust diagnostic performance (AUC > 0.85), positioning them as promising subtype classification tools which are in line with the findings of Manoochehri et al. (2022).
Clinically, the translational impact of FGFR1 and FGF2 as biomarkers is significant. Current tools like PAM50, Oncotype DX, and Mamma Print primarily rely on RNA profiles. Adding epigenetic layers, such as DNA methylation, could boost diagnostic precision and subtype differentiation . Given the inherent stability of methylation signals, these biomarkers also hold promise for non-invasive approaches involving cfDNA or circulating tumor cells .
Moreover, shifts in methylation patterns for FGFR1 and FGF2 might also inform response to epigenetic therapies. Drugs like decitabine and azacitidine, used in hematologic malignancies to reverse DNA methylation, are being explored in solid tumors . Our findings suggest that demethylation in low-expressing luminal tumors could upregulate specific isoforms or resensitize tumors to existing treatments.
The bioinformatic dimension of our work added functional context, with enrichment analyses confirming FGFR1 and FGF2 involvement in major oncogenic pathways like PI3K-Akt, MAPK, and Ras; all of which drive breast cancer progression and resistance and have been supported by previous studies ; . The correlation between methylation status and activation of these pathways opens doors for combined therapeutic strategies as proposed by Dai et al. (2024).
Nonetheless, some limitations remain. The number of samples used in IHC and COBRA analyses was relatively small. Expanding to larger, independent cohorts would provide more robust validation, as observed by Klein et al. (2023). Also, COBRA’s semi-quantitative nature suggests that future work should employ more sensitive platforms like pyrosequencing or MSP. Finally, direct functional validation through siRNA knockdown or CRISPR demethylation would help confirm causality between methylation and gene expression.
In sum, our study presents compelling evidence that FGFR1 and FGF2 are epigenetically regulated biomarkers with diagnostic and prognostic potential in breast cancer. Their differential methylation and expression profiles distinguish subtypes, align with patient outcomes, and may be valuable additions to the current diagnostic panel. Moving forward, clinical trials and broader validations are warranted to fully integrate these biomarkers into personalised oncology.
Declarations
Acknowledgment
We acknowledge the Higher Education Commission (HEC) Pakistan and School of Biological Sciences, University of the Punjab for funding support. We also thank our collaborators at the Mayo Hospital, Lahore, for access to clinical samples.
Funding
This work was funded by Higher Education Commission (HEC), Pakistan and School of Biological Sciences, University of the Punjab, Pakistan.
Ethical statement and IRB approval
Ethical clearance for the study was granted by the Institutional Review Board of the University of Health Sciences, Lahore (IRB approval number: Bioethics/094, dated 13-10-2017).
Generative AI and AI-assisted technology statement
The authors declare that no generative AI and AI assisted technology was used in the creation of this manuscript.
Supplementary material
There is supplementary material associated with this article. Access the material online at: https://dx.doi.org/10.17582/journal.pjz/20250630084225
Statement of conflict of interest
The authors have declared no conflict of interest.
Figures
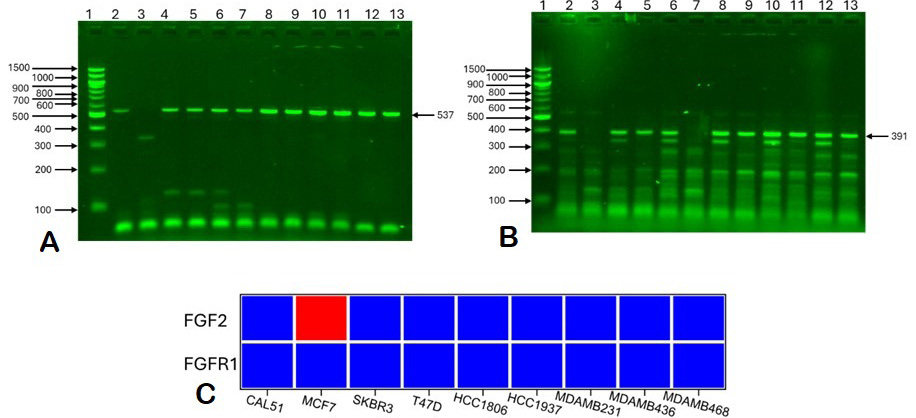
Methylation status of FGFR1 and FGFR2 in breast cancer cell lines by COBRA analysis. (A) FGFR1 promoter methylation across cell lines. (B) FGFR2 promoter methylation showing MCF7-specific hypermethylation. (C) Heatmap representation of methylation patterns.
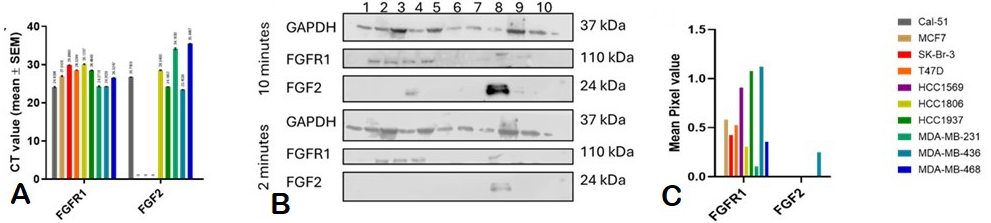
Gene and protein expression of FGFR1 and FGFR2. (A) mRNA expression by qPCR. (B) Western blot analysis. (C) Densitometry quantification normalized to GAPDH.
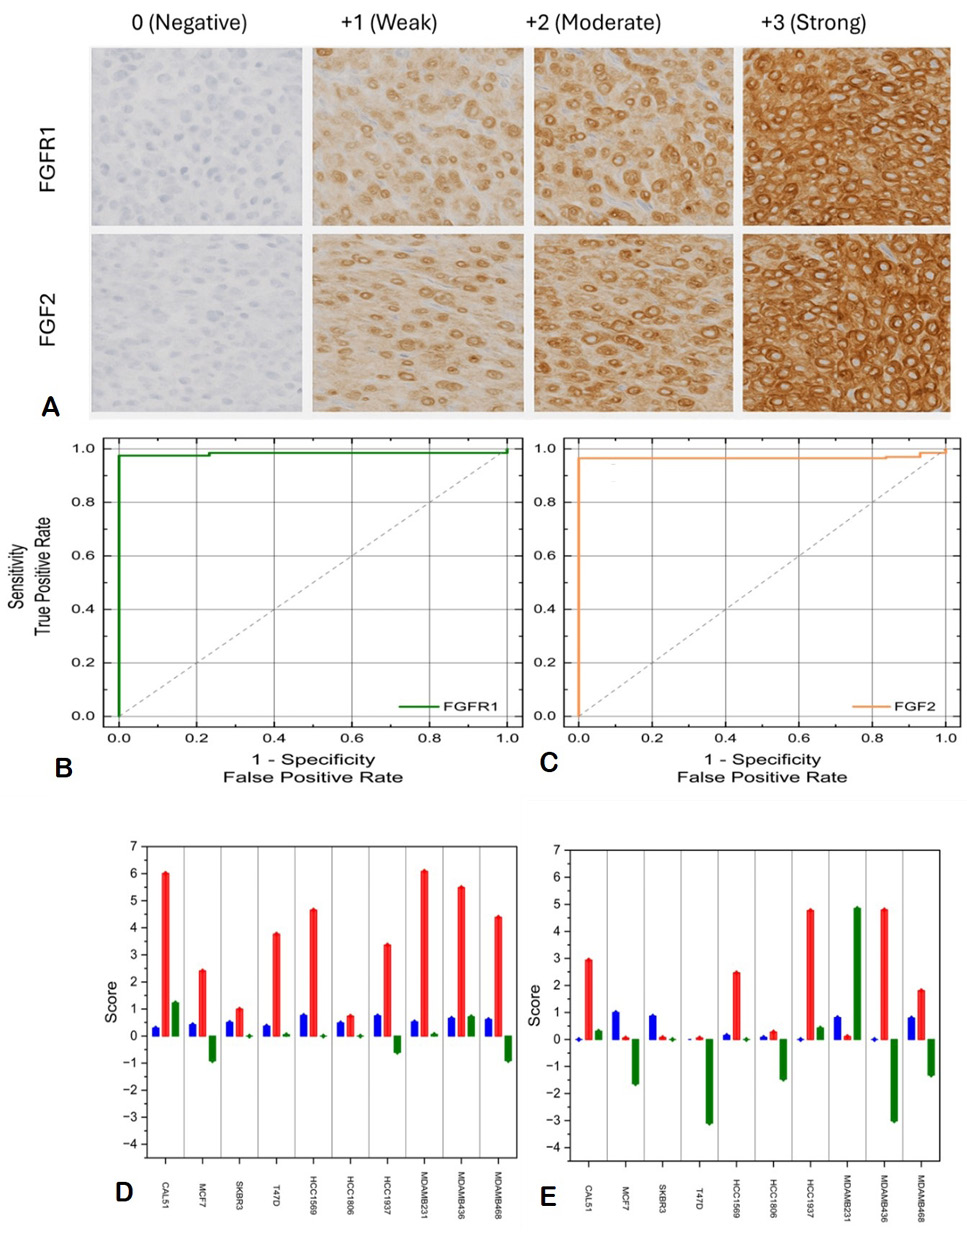
Immunohistochemical staining and ROC analysis. (A) Representative IHC images showing 0 to +3 staining intensity, (B) ROC curve for FGFR1 (AUC=0.88) and (C) ROC curve for FGFR2 (AUC=0.86). (D-E) Methylationexpression correlation from DepMap data.
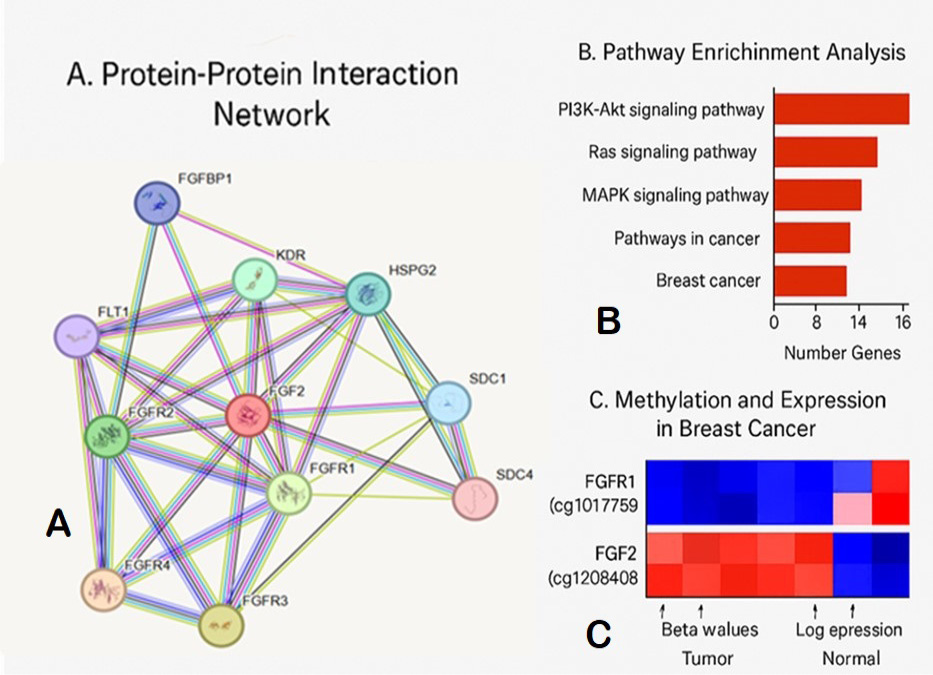
Bioinformatics analysis. A, PPI network showing FGFR1/FGF2 interactions; B, KEGG pathway mapping and C, TCGA methylation heatmaps by subtype.
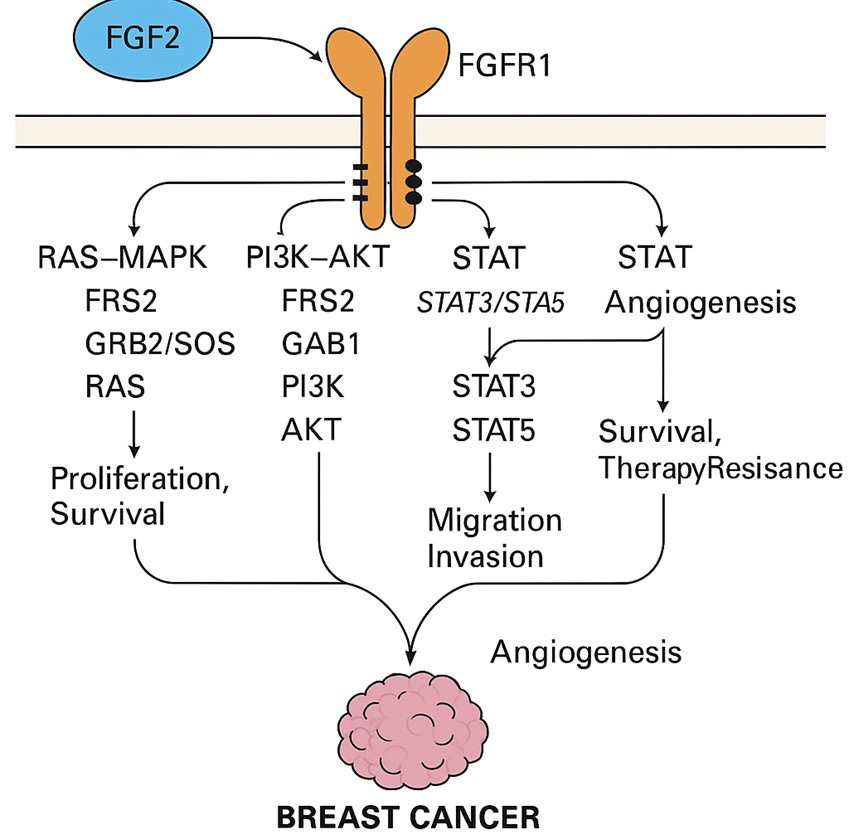
Proposed model of FGFR1/FGF2 epigenetic regulation in breast cancer subtypes.
References
- Beenken, Andrew, and Moosa, M., 2009. The FGF family: Biology, pathophysiology, and therapy. Nat. Rev. Drug Discov., 8: 235-253. https://doi.org/10.1038/nrd2792[CrossRef]
- Chen, X., Mei, L. and Hongjun, Z., 2023. m6A RNA methylation regulates FGF2 expression in triple-negative breast cancer. Epigenet. Chromat., 16: 1-15.
- Dai, W., Wang, L., Chen, Y., Zhang, H., Li, J., Liu, X., Zhao, Y., and Xu, T., 2024. Epigenetic plasticity in breast cancer cell lines: Implications for intratumoral heterogeneity. Cell Rep. Med., 5: 101389.
- Fleischer, T., Tekpli, X., Mathelier, A., Wang, S., Nebdal, D., Dhakal, H.P., Sahlberg, K.K., Schlichting, E., Oslo Breast Cancer Research Consortium, Børresen-Dale, A.L. and Kristensen, V.N., 2023. Early epigenetic alterations predict long-term survival in breast cancer. Clin. Epigenet., 15: 45.
- GLOBOCAN. 2024. Global cancer observatory: Breast cancer factsheet. International Agency for Research on Cancer, 2024. https://gco.iarc.fr/.
- Gong, Y., Liu, Y., Wang, J., Chen, X., Zhang, L. and Zhou, Q., 2024. FGF2 epigenetic regulation in breast cancer: Role of DNA methylation and RNA m6A modification. Oncogene, 43: 512-525.
- Heyn, H. and Manel, E., 2012. DNA methylation profiling in the clinic: Applications and challenges. Nat. Rev. Genet., 13: 679-692. https://doi.org/10.1038/nrg3270[CrossRef]
- Huang, Y., Liu, Z., Wang, H., Zhang, W., Chen, J. and Li, S., 2024. CRISPR/dCas9-mediated demethylation for functional epigenetic studies. Nat. Methods, 21: 264-271.
- Jones, P.A., Issa, J.P. and Baylin, S., 2023. Epigenetic dysregulation in cancer: Mechanisms and clinical implications. Nat. Rev. Cancer, 23: 408-426.
- Katoh, M. and Hitoshi, N., 2014. FGF receptors: Cancer biology and therapeutics. Cancer Res., 74: 1-8.
- Klein, E.A., Richards, D., Cohn, A., Tummala, M., Lapham, R., Cosgrove, D., Chung, G., Clement, J., Gao, J. and Hunkapiller, N., 2023. Liquid biopsy for early breast cancer detection: Current challenges and future directions. Cancer Cell, 41: 1025-1038.
- Li, W., Gao, Y., Zhang, M., Liu, J., Wang, X. and Chen, H., 2023. Multi-omics integration identifies FGFR1 and FGF2 as biomarkers in basal-like breast cancer. J. clin. Epigenet., 9: 45-60.
- Luo, H., Wei, W., Ye, Z., Zheng, J. and Xu, R.H., 2024. Circulating tumor DNA methylation as a non-invasive tool for early breast cancer detection. Nat. Commun., 15: 1024.
- Manoochehri, M., Borhani, N., Klett, H., Koitzsch, U. and Odenthal, M., 2022. DNA methylation signatures in triple-negative breast cancer. Clin. Epigenet., 14: 1-18.
- Presta, M., Dell’Era, P., Mitola, S., Moroni, E., Ronca, R. and Rusnati, M., 2005. Fibroblast growth factor/fibroblast growth factor receptor system in angiogenesis. Cytok. Growth Factor Rev., 16: 159-178. https://doi.org/10.1016/j.cytogfr.2005.01.004[CrossRef]
- Shan, L., Wang, F., Zhai, D., Meng, X. and Liu, J., 2024. FGF2-FGFR1 axis promotes metastasis in triple-negative breast cancer via epigenetic reprogramming. Cancer Res., 84: 321-335.
- Turner, N., and Richard, G., 2010. Fibroblast growth factor signalling: From development to cancer. Nat. Rev. Cancer, 10: 116-129. https://doi.org/10.1038/nrc2780[CrossRef]
- Wang, Q., Zhang, Y., Li, C. and Sun, B., 2023. Tumor microenvironment-driven FGFR1-FGF2 crosstalk in therapy resistance. Cell Rep., 42: 112345.
- Wang, H., Ding, Q., Huang, C., Liu, G., Zhao, X., Cheng, Z. and You, X., 2024. Dihydroart emisinin inhibited vasculoge nic mimicry in gastric cancer through the FGF2/FG FR1 signaling pathway. Phytomedicine, 134: 155962.
- Widschwendter, M. and Peter, A.J., 2002. DNA methylation and breast tumorigenesis. Oncogene, 21: 5462-5482. https://doi.org/10.1038/sj.onc.1205606[CrossRef]
- Ye, F., Liang, Y., Hu, Q., Wang, J., and Chen, X., 2023. Co-expression of FGF2 and FGFR1 predicts poor prognosis in HER2-enriched breast cancer. J. mol. Diagn. 25: 567-580.
- Zhang, R., Zhang, L., Yu, W., Shen, F., and Feng, J., 2020. Genome-wide DNA methylation profiling identifies novel biomarkers for breast cancer subtypes. Clin. Cancer Res., 26: 4246-4257.
- Zhang, Y., Liu, X., Wang, Z., and Chen, L., 2024. Multi-omics analysis reveals FGFR1 as a therapeutic target in aggressive breast cancers. Nat. Cancer, 5: 234-250.
Supplementary material
Services
Article usage statistics
Loading…