
Climate Change-Farmers’ Perception, Adaptation and Impact on Agriculture in the Lakki Marwat District of Khyber Pakhtunkhwa


Research Article
Climate Change-Farmers’ Perception, Adaptation and Impact on Agriculture in the Lakki Marwat District of Khyber Pakhtunkhwa
Rizwan Ahmad and Muhammad Zulfiqar*
The University of Agriculture, Peshawar, Khyber Pakhtunkhwa, Pakistan.
Abstract | One of the most complex problems faced by the world today is climate change. Agriculture in many ways is affected by climate change and has impact for productivity of crops particularly in rainfed areas. Climate change related research remained a poorly investigated area in KP and instant study filled that gap by investigating farmers’ perceptions and adaptation about change in climate and impact of change in climate on wheat productivity in Lakki Marwat. A combination of multi-stage sampling and simple random sampling used to select five Union Councils (UCs), one village council from each UC and one village from each village council. Out of 611 households (HHs), 180 head/elders selected through random sampling process were interviewed. The secondary data, spread over 30 years from 1984 to 2013 pertaining to temperature, precipitation, area under cultivation and yield of crops was collected. Analytical models used are Logit Model and ARDL Model. Regarding farmers perceptions, results show that age of farmers, farming experience and education level of the farmers are positively and significantly, except education, associated with perception regarding climate change. However, size of HH, farming types and area under cultivation are negatively associated. Whereas association is insignificant in respect of farming types and area under cultivation. Regarding farmers’ adaptation, results show that the coefficient of age of farmers and farming experience are positive and significant. The coefficient of household size, cropping date, mulching and crop varieties were found positive but insignificant while coefficient of intercropping is negative but insignificant. The results pertaining to impact of temperature and precipitation on wheat yield suggest long run relationship among the variables. Temperature is negatively and significantly related. The precipitation is positively and significantly related. Short run relationship implies that around 73% deviations from long-term equilibrium are adjusted every year. Based on objectives of the research study and field findings recommendations offered include; farmers awareness drive to enhance capacity to strengthen local resilience, participation of farming community in formulation of policies, making meteorological information available to farmers, Design research plans to evolve wheat varieties addressing changing climatic challenges, construct water harvesting structures for high efficiency irrigation and further research to estimate range of temperature and precipitation within which crops under study perform better.
Received | April 02, 2019; Accepted | July 08, 2019; Published | August 27, 2019
*Correspondence | Muhammad Zulfiqar, The University of Agriculture, Peshawar, Khyber Pakhtunkhwa, Pakistan; Email: [email protected]
Citation | Ahmad, R. and M. Zulfiqar. 2019. Climate change-farmers’ perception, adaptation and impact on agriculture in the Lakki Marwat district of Khyber Pakhtunkhwa. Sarhad Journal of Agriculture, 35(3): 880-889.
DOI | http://dx.doi.org/10.17582/journal.sja/2019/35.3.880.889
Keywords | Climate change, Wheat, Productivity, Rainfed, Lakki Marwat
Introduction
One of the most complex problems faced by the world today is climate change. Its negative effects are considered too high and expected to directly impact the challenges faced to food adequacy and poverty alleviation globally as well as this region. Agriculture in many ways is affected by climate change and has impact for productivity of crops (Ziervogel et al., 2006). Some of the important factors responsible for increase in poverty and under development throughout the world include recurrent droughts, floods and land deterioration resulting from climate change (Adger et al., 2007).
In rainfed areas, climate is key to crop productivity, thus droughts, floods or extreme temperatures could devastate agriculture sector in the rainfed areas. This devastating situation could result into poor and unsustainable livelihood of the communities depending on agriculture in the rainfed areas. (Calzadilla, 2009). There are number of areas in Pakistan which are entirely dependent on rainfall for agricultural activities. Khyber Pakhtunkhwa is no exception and some of its districts are rainfed and are most vulnerable to change in climatic conditions. The total cultivated area of KP is 1,620,803 out of which 856,488 hectares i.e. 52.8% is irrigated and 47.2% is rainfed. Whereas in case of Lakki district, about 69% cultivated area is rainfed out of 116,900 hectares of cultivated land.
IPCC’s (2007) declares that worldwide the temperature has increased by 1.5 degree Celsius and the increasing trend in temperature will continue even after the year 2100. However, in case of scenario with lower emissions of CO2, the increasing trend in temperature will be with lower pace. In case of higher CO2 emissions rate, global warming has been estimated to be exceeding by 2 degrees Celsius till the year 2100. According to IPCC (2014), the limit of global surface temperature increases to 1.5 degrees Celsius and continues to rise beyond 2100 in all scenarios except lower emissions scenario. In scenarios with higher rates of CO2 emissions, global warming is likely to exceed 2 degrees Celsius by the year 2100. To come out with evidence about adverse effects of climatic changes on agriculture including ecosystem services became a critical challenge for development practitioners around the globe. It is internationally recognized that decreased productivity of agriculture sector means GDP level loss, decrease in income and consumption for the most vulnerable populations and deterioration in households’ welfare. Thus, influence of climate changes continuously poses major threat to rural livelihoods. For example, the 2010 floods had crushing effects in terms of life and livelihoods of a great number of people in Pakistan. There has been no price tag on the lives lost but recovery cost of the remains was estimated by the various agencies to the tune of USD 8.74 to 10.85 billion.
Some very serious consequences of climate change can significantly affect human welfare with respect to food, energy and health. Climatic variations and resultant weather patterns have already marked as negative effects on agricultural resources, food production and food security globally. It also hinders efforts to reduce poverty and economic development in climate prone sectors like agriculture (Diao, 2010). Climate change may alter rainfall patterns, drought cycles and more frequent severe weather patterns and increased diseases (Yanda, 2010; Hewitson, 2010). Moreover, consequent to climatic changes, productivity of farms decreased in general (Makungwa, 2010).
Contribution of agriculture sector in the GDP is 19.53% (GoP, 2017). Being an agricultural based economy, Pakistan is under immediate risk because of global climatic variability. The country ranked 12th amongst the most vulnerable states expected to have brunt of the climatic changes (Global Climate Risk Index, 2015). These changes have led to increased vulnerabilities to agricultural resources upon which a large part of the economy and livelihood depend. Pakistan being a developing country is likely to face severe challenges on account of economic and social development, environmental sustainability and land degradation. The adverse outcome of climatic changes are already been felt in Pakistan because of recurring droughts, increased intensity of floods and unpredictable weather patterns and changes in behavior of agricultural production system. Losses of biological diversity and reduction in fresh water supply in the vulnerable regions are some of the other evident impacts of the climate. Pakistan’s vulnerability is more evident because of the agricultural based economy. There are different types of effects of changing climate on natural resources particularly agriculture sector across diverse agro-ecological zones. In the dry western mountain areas, temperature increase can enhance the process of removing glaciers affecting water resources (Zulfiqar et al., 2018) upon which country depends to produce energy and crops.
Climate change and its impacts are becoming increasingly evident in Pakistan. Its negative effects are considered too high. In South Asia, Pakistan is considered most vulnerable to the climate change impacts. It has been reported that within south-Asia, Pakistan would be facing worst impacts of changing climate scenario. Within the country, regions with arid land will be on the top of affected list. Such arid regions will face a whole brunt of adverse impacts in terms of their socio-economic conditions, physical, environmental as well as biological resources. Additionally, the biomass of the arid land may also increase along with shift in crop production cycle because of changes in climatic conditions (Kassie, 2012).
Agriculture is an important source of livelihood for the rural communities of rainfed areas. The majority of the 30.50 million masses living in Khyber Pakhtunkhwa are dependent on rain-fed agriculture (GoP, 2017). The food availability for such areas is dependent on agricultural productivity. The crop productivity/ yield is dependent on timely rainfall specially in rainfed areas. The adverse impact on time and distribution of rainfall could have devastating effect on crop production system through lowering yield or crop failures. Such negative impact on crop husbandry would have consequences for the livelihood of the masses depending on rainfed agriculture being their mainstay.
Realizing the importance of the issue, the research article aims at investigating the awareness level of farmers and impact of temperature and precipitation on wheat productivity in the rainfed areas of Lakki Marwat District of Khyber Pakhtunkhwa.
Materials and Methods
Selection of district
The instant research article is based on the data collected from district Lakki Marwat of Khyber Pakhtunkhwa that was selected based on its rainfed nature. The cultivated area of district Lakki Marwat is 116,900 hectares and out of which 69% is rainfed (GoKP, 2015-16). There are 33 Union Councils in the district. The population of Lakki Marwat District is 876, 182. The average annual minimum temperature in Lakki Marwat ranges from 4.7 to 27.8 C, while average annual maximum temperature in Lakki Marwat ranges from 19.2 to 41.5 C. Average annual precipitation in Lakki Marwat ranges from 3-71 mm (https://en.climate-data.org/location/768509/ dated 12.10.2017). The district is characterized by rainfed agriculture, thus putting the district among the most climate change-vulnerable districts in Khyber Pakhtunkhwa.
Selection of crop
Wheat crop selected in the study area is grown on vast area of the district and have direct impact on the livelihoods of the people. The area brought under cultivation during winter season is 19,066 hectares out of which 17,490 hectares is under wheat i.e. 91.73%.
Sampling techniques
A combination of multi-stage sampling and simple random sampling have been used to select the union councils, village councils and households where survey was carried out. Five UCs from a district have been selected based on rainfed area under cultivation, access to area and security situation. One village of the each village councils has been selected purposefully from the chosen UCs. The selection of village councils was entirely on rainfed cultivated area basis.
The farming households in the selected villages were 611 out of which a total of 180 farmers who themselves are cultivating lands were selected through simple random process as referred by Valerie et al. (1997). The UCs, village councils and village wise number of HH and farmers interviewed is given in the Table 1.
Data collection
The primary data was collected through individual questionnaire based survey from 180 farmers. The secondary data available spread over 1999 to 2013 pertaining to temperature, precipitation was collected from Meteorological Department, Govt. of Pakistan and data of area under cultivation and yield of crop from Crop Reporting Wing of Agriculture Department, Government of Khyber Pakhtunkhwa.
Analytical modeling
Keeping in view the objectives and data used, the Analytical Models used for the study included Logit Model and ARDL Model. For each component, statistically different means were separated using least significance difference (LSD) at 5% level (p ˂ 0.05). The variables were examined using the techniques of Gujarati (2003), Maddala (2002), Maddison (2006) and Kassie et al. (2012). The model was estimated using statistical software SPSS.
The choice of the explanatory variables in the model for have been based on literature review Ghazouani and Goaied (2001) and Mendels and Nordhaus (1994)
Table 1: Selected UCs, VCs, villages and farmers.
| S. No | Union Council | Village Council | Sample Village | Farming HHs | Farmers Interviewed |
| 1 | Mash Masti Khan | Vanda Mash | Azad Khel | 109 | 32 |
| 2 | Landiwah | Landiwah | Muhkum Khel | 98 | 29 |
| 3 | Tajori | Tajori | Bazu Khel | 114 | 33 |
| 4 | Lakki Marwat-I | Abba Khel | Ismail Khel | 154 | 46 |
| 5 | Mela Shahab Khel | Dalo Khel | Khanu Khel | 136 | 40 |
| Total | 611 | 180 | |||
Source: Field Survey.
and initial discussions with the stakeholders and keeping in view the nature of farming i.e. rainfed farming practices. It is pertinent to mention that there is a big difference in farming operations and use of inputs between irrigated agriculture and rainfed agriculture. The rainfed agriculture is constrained to use certain inputs which require regular scheduling of water applications. In order to investigate the effect of different variables on the perception of farmers regarding climate change, and adaptation measures taken by the farmers to address impact of climate change, the following general models was applied:

Its specific form is as under.

Whereas;
PCC= perception of farmers about the climate change and take the values 1 and 0 for Yes and No, respectively. It was considered as dependent variable; Age = age of the farmers which was measured in years; SHH= size of household which was measure in numbers and take the value 1 for household having size above 5, and 0 for 5 and below; Exp = denote the experience of farmers (in years) and take value 1 for above 5 years of farming experience and 0 for 5 and below; Edu = shows the level of education and take the value 1 for literate and 0 for illiterate farmer; FType = indicate farming type (system) and take the value 1 for commercial farming and 0 otherwise; CLand = shows the cultivated land in acres and take the value 1 for above 5 acres and 0 for 5 and below; ε= is the random error and assumed to follow normal distribution with zero mean and constant variance i.e. ε ~ N (0, σ2).
For adaptation by farmers following model was used:
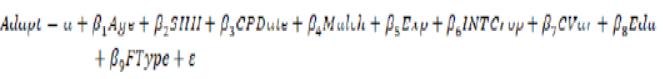
Whereas,
Adapt= dependent variable showing the adaptation of farmers with climate change and take the values 1 and 0 for Yes and No, respectively; CPDate = indicate the change in cropping date, and take the values 1 and 0 for Yes and No, respectively; Mulch = show mulching and take the values 1 and 0 for Yes and No, respectively; INTCrop = show the intercropping and take the values 1 and 0 for Yes and No, respectively;Cvar = represent change of sowing in crop variety and take the values 1 and 0 for Yes and No, respectively; The remaining variables in equation like Age, SHH, Exp, Edu and FType have the same meaning as explained under perception.
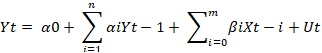
To investigate impact of rainfall and temperature on productivity of wheat Auto Regressive Distributed Lag (ARDL), Co-Integration Technique (Engle and Grander, 1987) and Bound Test of Co Integration (Pesaran and Shin, 1999; Pesaran et al., 2001; Johnsen and Juselius, 1990). The Autoregressive Distributed Lag (ARDL) model was used. The rationale behind use of ARDL model is that the combination of time series variables in the study is stationary at level and integration at order 1. Thus, in such a situation ARDL approach is most suitable econometric tool compared to some of the other econometric models. The common formula of ARDL model with n lags for variable Y and m lag for variable X stands as given below:
While general format of the ARDL ECM runs as below:

A regression analysis showed attribution of climatic changes to wheat productivity subject to model assumptions given at the end of this chapter. The productivity regression model used is as under:
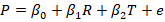
Where;
P= productivity per hectare; R= rain/precipitation; T= temperature; βs= coefficients; e= error term
Before analysis, following diagnostic tools have been used to satisfy various assumptions and to ensure that the results of the analytical model are without any bias:
- • ADF Unit Root Test was applied to decide on analytical model in light of arguments by Kwiatkowski et al. (1992), Maddala and Kim (1998) and Phillips and Xiao (1998).
- • Autocorrelation Test - Brush Godfrey LM Test as referred by Breusch et al. (1979) and Godfrey, L. G. (1978).
- • Heteroscedasticity Test- Breusch-Pagan-Godfrey Test in light of Breusch and Pagan, 1979.
- • Stability check Test - CUSUM Test and CUSUMSQ Test in light of Brown et al. (1975).
Results and Discussion
Farmers’ climate change perception
In order to investigate the effect of different factors on the perception of farmers about the climate change, Logistic Regression was applied and the results are summarized in Table 2.
It is evident that the coefficient of age of farmers is positive and significant (p<0.01) with expected (B) of 1.133 suggesting that farmers age is positively related to climate change perception. It suggests that that more is the age, more are the chances of having climate change perception. Econometrically it could be said that one year increase in age increases the understanding regarding climate change by about 1.133 times.
The coefficient of household size was found negative and significant (p<0.05) suggesting that greater the household size, lesser is the understanding about the climate change. In other words, the smaller the HHS (5 or less) will be 4.975 (1/0.201) times more understanding about the climate change as compared to those having SHH greater than 5 members. It suggests that with greater number of households, there is greater chance of livelihood diversification, so lesser dependence on farming which results in somewhat indifference towards climate change.
Table 2: Climate change perception.
| Factor | B | S.E. | Wald | Df | Sig. | Exp (B) |
| Age | 0.125 | 0.022 | 31.707 | 1 | 0.000 | 1.133 |
| SHH | -1.606 | 0.718 | 4.996 | 1 | 0.025 | .201 |
| FEXP | 1.358 | 0.598 | 5.160 | 1 | 0.023 | 3.890 |
| EDUL | 0.877 | 0.515 | 2.903 | 1 | 0.088 | 2.403 |
| FTYPE | -0.408 | 0.406 | 1.010 | 1 | 0.315 | 0.665 |
| CLAND | -0.231 | 0.394 | 0.344 | 1 | 0.557 | 0.794 |
| Constant | -2.634 | 0.614 | 18.380 | 1 | .000 | .072 |
Similarly, the positive sign of regression coefficient for farming experience indicates increase in farming experience will significantly (p<0.05) enhance the understanding of farmers regarding climate change. Its odd ratio suggests that all those farmers having experience greater than five years in farming is 3.89 times more understanding of climate change as compared to those having less than five years of experience in the farming. The result is in line with both the theory and logic. Greater the experience in any field results in greater understanding about that field. So, in this case, greater experience in farming particularly in rainfed areas will have greater understanding about climate change and its impact on crops.
The level of education showed significant effect (p<0.10) on perception of farmers regarding climate change understanding. It is evident from the odd ratio that the understanding of the educated farmers regarding climate change is 2.403 times more as compared to non-educated farmers. The result is in line with the theory and it is concluded that that some educated farmers have more chances of accessing greater information about the climate change.
The farming types have negative coefficient; however, it was found insignificant (p=0.315). The odd ratio of 0.665 indicate that commercial farmers have less understanding of climate change as compared to mixed farming types. In other words, the odds of all those farmers having mixed farming system is 1.504 (1/0.665) which means that mixed farms owners have 1.504 times more understanding about climate change.
Furthermore, coefficient of cultivated land was negative and insignificant (p=0.557) indicating that all those farmers having cultivated land up to 5 units have less understanding of climate change than the farmers having cultivated land more than 5 units. In other words, its odd ratio of 0.794 suggests that the odds of farmers having more than 5 unit cultivated land is 1.259 (1/0.794) times more about the understanding of climate change than the farmers having up to 5 units of cultivated land.
Farmers’ climate change adaptation
The adaptation measures and their affect were investigated using Logit Regression method and the results derived are reflected in Table 3.
Table 3: Climate change adaptation.
| Factor | B | S.E. | Wald | Df | Sig. | Exp(B) |
| Age | 0.140 | 0.024 | 34.092 | 1 | 0.000 | 1.150 |
| SHH | 1.133 | 0.840 | 1.818 | 1 | 0.178 | 3.105 |
| CPDATE | 1.086 | 0.692 | 2.467 | 1 | 0.116 | 2.963 |
| MULCH | 1.843 | 0.990 | 3.468 | 1 | 0.063 | 6.318 |
| FEXP | 3.052 | 0.711 | 18.418 | 1 | 0.000 | 21.160 |
| INTCROP | -1.784 | 0.621 | 8.268 | 1 | 0.004 | 0.168 |
| CROPVAR | 0.508 | 0.764 | 0.441 | 1 | 0.507 | 1.661 |
| EDUL | 0.451 | 0.742 | 0.369 | 1 | 0.543 | 1.570 |
| FTYPE | -1.236 | 0.632 | 3.830 | 1 | 0.050 | 0.290 |
| Constant | -4.152 | 1.020 | 16.552 | 1 | 0.000 | .016 |
Regarding age variable, the coefficient of age of farmers is positive which is in line with theoretical assumption and significant (p<0.001) with expected (B) of 1.150 suggesting that one-year increase in age increases the adaptation prospects of the farmers by about 1.150 times. The coefficient of household size was found positive but insignificant (p>0.17) but the odd ratio (3.105) suggest the trend that greater the household, greater is the chances of climate change adaptation by the farmers. In other words, one unit increase in the household size results in 3.105 times more chances of climate change adaptation by the farmers. In the same token, the positive sign of regression coefficient of cropping date with insignificant level of confidence (p>0.11) but odd ratio of 2.963 indicates that farmers vary cropping dates as a measure of climate change adaptation. Similarly, the positive sign of regression coefficient with slightly insignificant level (p = 0.063) for mulching and 6.318 odd ratio indicates farmers practicing mulching as one of the adaptation measures against the climate change. In other words, farmers practicing mulching will be 6.318 times more likely aware of climate change effect and taking adaptation measures compared to farmers who do not practice mulching. The positive sign of regression coefficient for farming experience indicates increase in farming experience will significantly (p <0.001) enhance the likelihood of farmers taking climate change adaptation measures against adverse effects of climate change on crop productivity. Its odd ratio suggests that all those farmers having experience greater than five years in farming are 21.610 times more active taking climate change adaptation measures as compared to those having less than five years of experience in the farming.
The intercropping showed negative coefficient, however it was found insignificant (p < 0.010). The odd ratio of 0.168 indicate that farmers doing intercropping have less likelihood of taking adaptation measures against climate change as compared to those farmers not exercising intercropping. In other words the odds of all those farmers having no intercropping is 5.952 (1/0.168) which means that farmers with no intercropping have 5.952 times more likelihood of taking climate change adaptation measures. However, it can be argued that intercropping in itself is a form of climate change adaptation by minimizing the risk.
Similarly, the positive sign of regression coefficient for crop varieties indicates farmers changing crop varieties as one of adaptation measure against the climate change. However, statistically the coefficient is highly insignificant (p > 0.50). With the same token, the positive sign of regression coefficient for education level shows farmers having more of education are likely to take adaptation measure against the climate change compared to farmers having no education. However, statistically the coefficient is highly insignificant (p > 0.50). Similarly, the negative sign of regression coefficient with significant level (p = 0.05) for farm type and 0.290 odd ratio indicates farms with commercial nature i.e. mono crop are taking less adaptation measures than farmers having mixed types of farms. In other words, the mixed type of farms will be 6.318 (1/0.290) times more likely to take adaptation measures compared to mono crop type farms.
Impact of temperature and precipitation on wheat yield
Augmented Dickey and Fuller test is used to omit the autocorrelation problem and justification for use of ARDL model. The results in Table 4 show that the data of variable ‘wheat yield’ is stationary at first difference while data of ‘temperature’ and ‘precipitation’ is stationary at level. The value of t-statistics is -7.572137 and Probability value is 0.0000. Thus, p value is less than 5% which means at 5% mean variable is stationary at level. Similarly, t-statistics and p values of temperature and precipitation reflects that both variables are stationary at level.
Table 4: Results of the ADF Unit Root Test.
| Variable | ADF Unit Root Test | Order | |
| T-statistics | Prob. Values | ||
| Wheat Yield | -7.572137 | 0.0000 | I(1) |
| Mean Temperature | -4.365865 | 0.0018 | I(0) |
| Mean precipitation | -4.396578 | 0.0016 | I(0) |
Brush God fray LM test was used that as per Table 5 determined that there is no autocorrelation problem in the data as p-values associated with test statistic is greater than the standard significant level [i.e. 0.7849> 0.05].
Table 5: Results of Brush God fray LM Test.
| F-statistic | 0.178373 | Prob. F (2,21) | 0.8379 |
| Obs*R-squared | 0.484420 | Prob. Chi-Square (2) | 0.7849 |
Breusch-Pagan-Godfrey test result shown in Table 6 reflect that there is no Heteroscedasticity problem in the data as at 5%, p-value associated with the test statistics is greater than the standard significance level [i.e. 0.4153> 0.05].
Table 6: Results of Breusch-Pagan-Godfrey test.
| F-statistic | 0.959399 | Prob. F (5,23) | 0.4627 |
| Obs*R-squared | 5.004603 | Prob. Chi-Square (5) | 0.4153 |
| Scaled explained SS | 3.374056 | Prob. Chi-Square (5) | 0.6425 |
For analyzing the stability of the long-run coefficients together with the short-run dynamics, the cumulative sum (CUSUM) and the cumulative sum of squares (CUSUM) test were applied. As shown in the Figures 1 and 2, the plot of both the CUSUM and the CUSUMQ residual are within the boundaries. That is to say that the stability of the parameters has remained within its critical bounds of parameter stability at 5% confirming the stability of the long-run coefficients along with the short-run dynamics.
After satisfying all the necessary assumptions, the relationship between wheat yield as a dependent variable and temperature and precipitation as independent variables was estimated using ARDL (bounds) test and results are shown in Table 7.
Table 7: ARDL bound test results.
| Test Statistic | Value | k |
| F-statistic | 7.181 | 2 |
| Critical Value Bounds | ||
| Significance | I0 Bound | I1 Bound |
| 10% | 3.17 | 4.14 |
| 5% | 3.79 | 4.85 |
| 2.5% | 4.41 | 5.52 |
| 1% | 5.15 | 6.36 |
The value of F Statistics in the table is 7.181 which is higher than upper boundary that showing long run relationship among the variables. We used Akike info criterion (AIC) to select the optimal lag length of variables included in the ARDL model. Table 8 presents the results of long-run relationship of the selected ARDL model (1,2,0) using AIC that shows that temperature negatively and precipitation positively related to the wheat yield in the long run.
Table 8: Long run estimation results ARDL (1,2,0) model.
| Long Run Coefficients | ||||
| Variable | Coefficient | Std. Error | t-Statistic | Prob. |
| Wheat_temp | -319.947 | 98.603137 | -3.244800 | 0.0036 |
| Wheat_precipit | 9.011 | 6.656190 | 1.353725 | 0.1890 |
| C | 6451.003 | 1980.950598 | 3.256519 | 0.0035 |
The scenario reveals that if 1% increase occurs in mean temperature wheat yield will decrease by 319.947%. The same trend was found by Phillips and Xiao (2005) who studies impact of temperature in low altitude areas. Paul et al. (1996) and Gbetibouo and Hassan (2004) also argued that South African region would have damaging effect on wheat yield due to temperature increase in future. Regarding precipitation, the above result shows that if precipitation increases by 1% the wheat yield will increase by 9.011% in the long run. The precipitation result gives similar trends as estimated by Wolf et al. (1996) . Wolf while comparing five wheat models at different level of agronomic conditions concluded that all models showed reduction in yield due to temperature increase but positive impact of increased level of precipitation on wheat yield. The Table 9 indicates the short run relationship between wheat yield and temperature and precipitation.
Table 9: Short run estimation of cointegration form (1,2,0) model.
| Cointegrating Form | ||||
| Variable | Coefficient | Std. Error | t-Statistic | Prob. |
| D(Wheat_temp) | -108.772758 | 53.422522 | -2.036084 | 0.0534 |
| D(Wheat_temp(-1)) | 72.745819 | 44.802318 | 1.623707 | 0.1181 |
| D(wheat_precipit) | 6.578420 | 4.309276 | 1.526572 | 0.1405 |
| CointEq(-1) | -0.730072 | 0.170186 | -4.289837 | 0.0003 |
| Cointeq = Wheat_yield_kg_hectares - (-319.9475*Wheat_temp + | ||||
| 9.0106*Wheat_precipit + 6451.0035 ) R=68 | ||||
Where the coefficient of ECT= -0.73 showing the speed of adjustment implying that around 73% deviations from long-term equilibrium are adjusted every year. The coefficient of determination 68% indicates that 68 percent of the dependent variable variation (wheat yield) in the form of explanatory variables is explained by the presented linear model. The results estimated are in line with a number of studies conducted in different regions of the world. Phillips and Xiao (2005) reported wheat yield decreasing trend. Paul et al. (1996) while analyzing impact of global warming argued that Africa would suffer most due to negative effects on agriculture productivity. Wolf et al. (1996) while comparing five wheat models at different level of agronomic conditions concluded that all models showed reduction in yield due to temperature increase but positive impact of increased level of precipitation on wheat yield. The results of Wolf at el. are same as results of this study pertaining to wheat in district Lakki Marwat, the results of a number of studies suggest that estimates derived in the instant study are purposeful and add to the existing knowledge about impact of climate change on agriculture.
Conclusions and Recommendations
Agriculture in many ways is affected by climate change and has impact for productivity of crops particularly in rainfed areas. Climate change related research remained a poorly investigated area in KP and instant study filled that gap by investigating farmers’ perceptions about change in climate and impacts of change in climate on wheat productivity in Lakki Marwat. A combination of multi-stage sampling and simple random sampling used to select, 180 head/elders for interview. The secondary data pertaining to temperature, precipitation, area under cultivation and yield of crops was collected. Analytical models used are Logit Model and ARDL Model. Regarding farmers perceptions, results show that age of farmers, farming experience and education level of the farmers are positively and significantly, except education, associated with perception regarding climate change. However, size of HH, farming types and area under cultivation are negatively associated. Whereas association is insignificant in respect of farming types and area under cultivation. Regarding farmers’ adaptation, results show that the coefficient of age of farmers and farming experience are positive and significant. The coefficient of household size, cropping date, mulching and crop varieties were found positive but insignificant while coefficient of intercropping is negative but insignificant. The results pertaining to impact of temperature and precipitation on wheat yield suggest long run relationship among the variables. Temperature is negatively and significantly related. The precipitation is positively and significantly related. Short run relationship implies that around 73% deviations from long-term equilibrium are adjusted every year.
Based on objectives of the research and findings, the following recommendations are offered.
- • Awareness drive in the rainfed areas is strongly recommended to make the farmers aware of the challenges and opportunities emerging from climatic changes.
- • Participation of farming community in formulation of policies pertaining to climate change to understand local context and utilizing local knowledge and experiences for a more effective land use and agricultural practices in the rainfed areas.
- • Making temperature, precipitation and other related meteorological information and alerts available to farmers in a form that is understandable by the farmers.
- • Government should design research plans for rainfed areas aiming at evolving crops varieties which offer high yields along with suitability to changing climatic scenarios such as heat and cold resistance, short duration maturity, needing less water, etc.
Author’s Contribution
The article is based on the PhD research of first author, Rizwan Ahmad. He carried out all necessary steps from collecting of data, analysis to writeup of article. Muhammad Zulfiqar supervised the research work of first author and reviewed the analysis and writeup of article.
Novelty Statement
This study is first of its kind to focus rainfed areas of Khyber Pakhtunkhwa pertaining to climate change, local level adaptation measures and impact on agriculture.
References
Adger. 2007. Assessment of adaptation practices, options, constraints. Cambridge Univ. Press.
Brown, R.L., J. Durbin and J.M. Evans. 1975. Techniques for testing the constancy of regression relationships over time. J. R. Stat. Soc. Ser. B (Methodol.) Vol. 37, No. 2 (1975), pp. 149-192. https://doi.org/10.1111/j.2517-6161.1975.tb01532.x
Calzadilla, A. 2009. Economy-wide impacts of climate change on agriculture in sub-Saharan Africa. Working Paper FNU-170. Hamburg: Hamburg Univ. Centre Marine Atmos. Sci.
Climate-Data.Org. 2017. Climate Lakki Marwat. https://en.climate-data.org/location/768509.
Diao, X. 2010. The role of agriculture in african development, world development. https://doi.org/10.1016/j.worlddev.2009.06.011
Engle, F. and W.J. Granger. 1987. Co-Integration and error correction: representation, estimation and testing. Econometrica. Vol. 55: No. 2. 251-276. https://doi.org/10.2307/1913236
Maddala, G.S. and I.M. Kim. 1998. Unit roots co-integration and structural change. Cambridge Univ. Press. ISBN 978-0-521-58257-5.
Gbetibouo, G.A. and R.M. Hassan. 2004. Measuring the economic impact of climate change on major South African field crops: a Ricardian approach. Centre Environ. Econ. Policy Africa (CEEPA), Dep. Agric. Econ. Univ. Pretoria, S. Africa
Global Climate Risk Index. 2015. Briefing paper on who suffers most from extreme weather events? Weather-related Loss Events in 2013 and 1994 to 2013. German Watch.
Godfrey, L.G. 1978. Testing for higher order serial correlation in regression equations when the regressors include lagged dependent variables. Econometrica. 46: 1303-1310. https://doi.org/10.2307/1913830
GoKP. 2015-16. Crops statistics of Khyber Pakhyunkhwa, crop reporting services, agriculture, livestock and cooperation department, GoKP.
GoP. 2017. Economic survey of Pakistan 2016-17. Finance division, GoP, Islamabad.
Gujarati, N.D. 2003. Basic econometrics. Fourth edition. McGRAW hill, New York, USA.
Hassan, R. and C. Nhemachena. 2008. Determinants of African farmers‟ strategies for adapting to climate change: Multinomial choice analysis. Afr. J. Agric. Resour. Econ. 2(1): 83-104.
Hewitson, B.C. 2010. Climate change scenario development in Sub-Saharan Africa” SARUA leadership dialogue series, Vol. 2, No.4, pp. 46-67.
IPCC. 2007. Climate change: impacts, adaptation and vulnerability. Contribution of working group II to the fourth assessment report of the intergovernmental panel on climate change, Cambridge Univ. Press, Cambridge, UK. pp. 976.
IPCC. 2014. Climate change. Synthesis report. Contribution of working groups I, II and III to the Fifth assessment report of the intergovernmental panel on climate change. IPCC, Geneva, Switzerland. pp. 51.
Johansen, S. and K. Juselius. 1990. Maximum likelihood estimation and inference on cointegration with applications to demand for money. Oxf. Bull. Econ. Stat. 52. https://doi.org/10.1111/j.1468-0084.1990.mp52002003.x
Kassie. 2012. Plot and household-level determinants of sustainable agricultural practices in rural Tanzania. Environ. Dev. Dis. Paper Ser.
Kwiatkowski, D., C.B. Peter, P. Schmidt and S. Shin. 1992. Testing the null hypothesis of stationarity against the alternative of a unit root How sure are we that economic time series have a unit root? J. Econ. 54 (1992): 159-178. https://doi.org/10.1016/0304-4076(92)90104-Y
Maddala, G.S. 2002. Introduction to econometrics. Third Edition. John Wiley and Sons, Ltd, New York.
Maddison, D. 2006. The perception and adaptation to climate change in Africa. CEEPA. Discussion Paper No. 10. Centre for environmental economics and policy in Africa. Univ. Pretoria, Pretoria, South Africa.
Makungwa, S. 2010. Adaptation, agriculture and food security. SARUA leadership dialogue series, Vol. 2, No.4: pp. 68-80.
Mendelsohn, Robert, D. William, Nordhaus and D. Shaw. 1994. The impact of global warming on agriculture: A Ricardian approach. Am. Econ. Rev. 84, no. 4 (September): 753–771.
Paul Winters (1996). Climate change, agriculture and developing economies. Working Paper No. 785. California Agricultural Experiment Station, USA.
Pesaran, M.H., Y. Shin and R. Smith. 2001. Bounds testing approaches to the analysis of level relationships. J. Appl. Econ. 16, pp. 289-326. https://doi.org/10.1002/jae.616
Pesaran, M.H. and Y. Shin. 1999. An autoregressive distributed lag modelling approach to cointegration analysis. Econometrics and economic theory in the 20th century: Ragnar Frisch Centennial Symp., Strom, S. (ed.) Cambridge Univ. Press.
Phillips, P.C.B. and Z. Xiao. 1998. A primer on unit root testing. J. Econ. Surv. Vol. 12. No. 5. https://doi.org/10.1111/1467-6419.00064
Ghazouani, S. and M. Goaied. 2001. The determinates of urban and rural poverty in Tunisia, working paper 0126, Econ. Res. Forum, Cairo.
Breusch, T.S. and A.R. Pagan. 1979. A simple test for heteroscedasticity and random coefficient variation. Econ. Vol. 47, No. 5 (Sep., 1979), pp. 1287-1294. https://doi.org/10.2307/1911963
Tanzania: A case of the South-western Highland of Tanzania. J. Geogr. Reg. Plan. Vol. 3(4), 66-72.
Valerie, J., Easton and H. John. McColl. 1997. Presenting data. Steps Stat. Glossary Web. Version 1.1. Vol. 40: 133–146.
Wolf, J., L.G. Evens, M.A. Semenov, H. Ekersten and A. Aglesias 1996. Comparison of wheat simulation models under climate change. I. Model calibration and sensitivity analyses. Climate Res. 7. 253-270.
Yanda, P.Z. 2010. Climate change impacts, vulnerability and adaptations in Southern Africa. SARUA Leadership Dialogue Series, 2(4): 11-30.
Ziervogel. 2006. Climate change scenarios and the development of adaptation strategies in Africa: challenges and opportunities. Clim. Res.
Zulfiqar, M. 2018. Threats of global warming for Pakistan’s agriculture. An evidence from Shigari Kalan watershed, Skardu. Sarhad J. Agric. 34(3): 569-574. https://doi.org/10.17582/journal.sja/2018/34.3.569.574
To share on other social networks, click on any share button. What are these?


