
Wound Healing Effectiveness Test of Dermal Patch Formulated with Green Synthesized Silver Nanoparticles from Plantago major L. Extract


Wound Healing Effectiveness Test of Dermal Patch Formulated with Green Synthesized Silver Nanoparticles from Plantago major L. Extract
Johan Sukweenadhi1*, Stefan Pratama Chandra1, Finna Setiawan2, Christina Avanti2, Kartini Kartini2, Arief Koeswanto3 and Deok-Chun Yang4
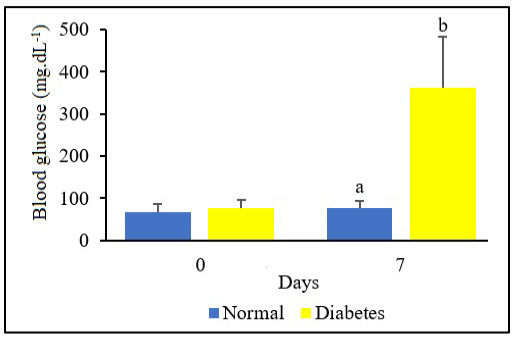
Bar chart to show the average fasting blood glucose of mice for each treatment on day-0 and day-7 after STZ injection. The difference in letters indicates a significant difference between the treatment groups (α = 5%).

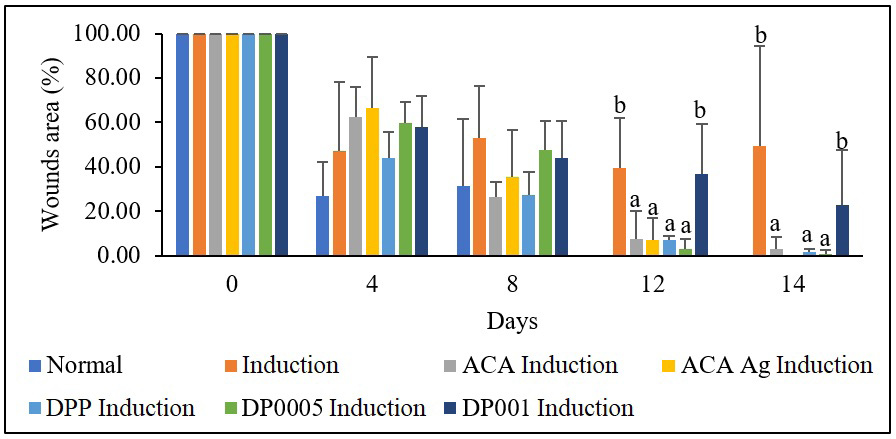
Bar chart to show average of wound area on each group for day 0, day 4, day 8, day 12, and day 14. The difference in letters indicates a significant difference between the treatment groups (α = 5%).

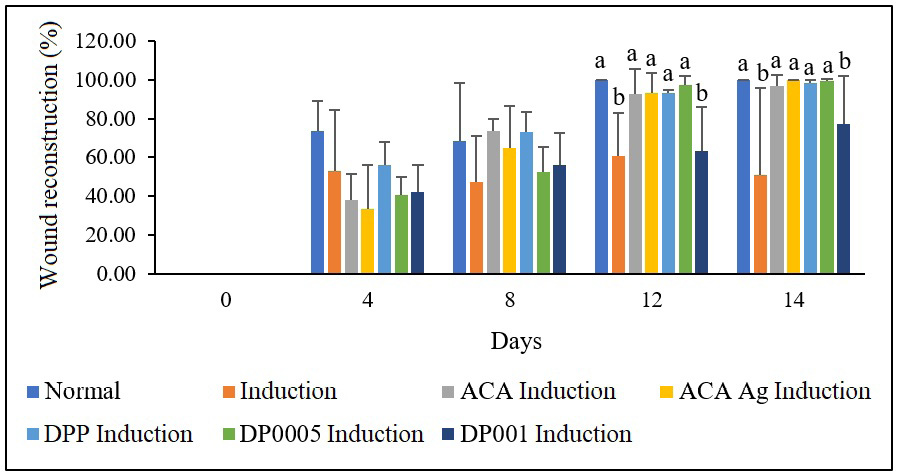
Bar chart to show average of epidermal reconstruction on each group for day 0, day 4, day 8, day 12, and day 14. The difference in letters indicates a significant difference between the treatment groups (α = 5%).
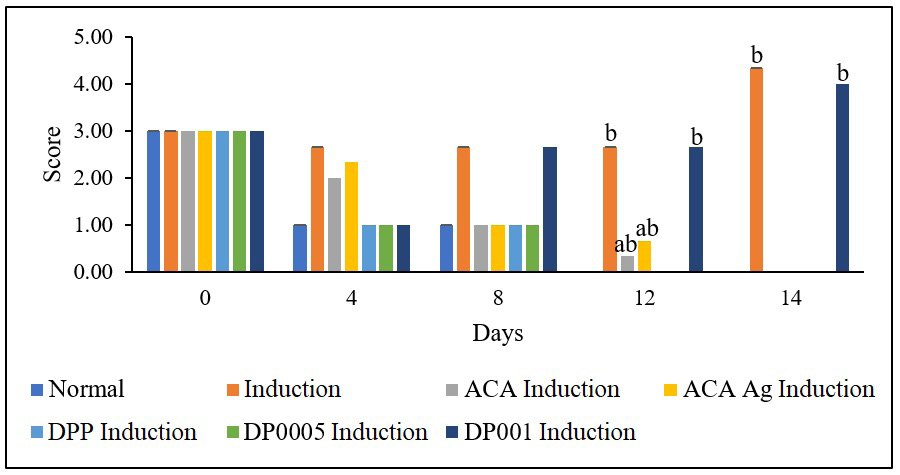
Bar chart to show average of TIME-H on each group for day 0, day 4, day 8, day 12, and day 14. The difference in letters indicates a significant difference between the treatment groups (α = 5%).

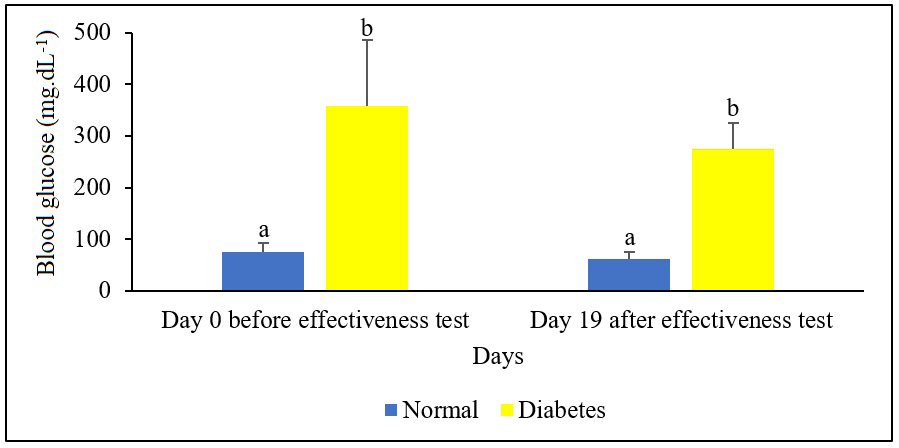
Bar chart to show the average fasting blood glucose of mice for each treatment before effectiveness test and after effectiveness test. The difference in letters indicates a significant difference between the treatment groups (α = 5%).

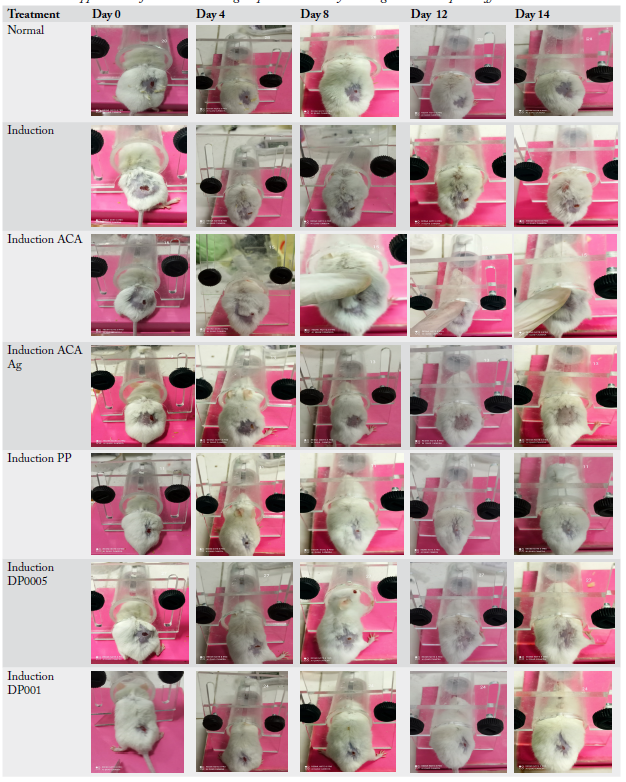
The appearance of wounds in each group on 0 to 14 days during the dermal patch effectiveness test.


