

Utilization of Agro-Industrial Waste for Chitinase Production by Locally Isolated Bacillus subtilis using Response Surface Methodology


Utilization of Agro-Industrial Waste for Chitinase Production by Locally Isolated Bacillus subtilis using Response Surface Methodology
Farah Deeba1, Hafiz Abdullah Shakir1, Muhammad Irfan2, Muhammad Khan1 and Javed Iqbal Qazi1*
1Industrial Biotechnology Lab. Department of Zoology, University of the Punjab, Lahore-54590, Pakistan
2Department of Biotechnology, University of Sargodha, Sargodha 40100, Pakistan.
ABSTRACT
Chitinase is most promising natural enzyme present in all life forms. It has various environmental, food, medical industrial and biotechnological applications. Twenty strains were isolated on chitinase producing medium (CPM) from soil samples collected from local termites’ influenced areas. Of all these, three isolates gave positive test for chitinase screened on the bases of clear zone on CPM following chitinase assay. The best chitinase producer was selected and identified as Bacillus subtilis employing 16S rRNA gene sequence identification technique. B. subtilis yielded highest chitinase on CPM at pH 7 with 3% inoculum size after incubating at 37 °C for 3 days. Plackett-Burman design was used for screening of medium components. The optimization of concentration of significantly impacted medium components for chitinase production was carried out using central composite design of response surface methodology. The maximum chitinase production was achieved employing 5% chitin, 0.5% rice straw, 0.05% peptone, 0.02% CaCl2, and 0.05% yeast extract. The utilization of agro-industrial waste (rice straw) not only decrease the production costs of microbial chitinase but can also providing positive way out for solving environmental pollution problem related to the waste.
Article Information
Received 17 July 2019
Revised 05 June 2020
Accepted 10 November 2020
Available online 15 Februay 2021
(early access)
Published 04 January 2022
Authors’ Contribution
FD performed the experiments. HAS and MK worked on arranging, interpreting and organizing the data. MI helped in statistical analysis. JIQ supervised and facilitated the whole project.
Key words
Bacillus, 16S rRNA, Chitinase, RSM, Submerged fermentation
DOI: https://dx.doi.org/10.17582/journal.pjz/20190717070735
* Corresponding author: qazi.zool@pu.edu.pk
0030-9923/2022/0002-0551 $ 9.00/0
Copyright 2022 Zoological Society of Pakistan
INTRODUCTION
Chitinase fascinating and diverse properties revealing its remarkable potential in different fields of life. Their presences in almost all kind of organisms including bacteria, fungi, insects and mammals highlight its distinctive miscellany (Deeba et al., 2016). Its prominent application depicts single cell protein formation, treatment of chitin containing wastes, pharmaceutical product preparation, controlling pathogenic fungi, biopesticide and as an insecticide (Dahiya et al., 2006; Islam and Datta, 2015).
Chitin is insoluble, hard, white, biopolymer, consist of smaller unites (N- acetylglucosamine) linked by β-1,4 bond. It is rich renewable natural source obtained from marine life such as invertebrates, algae, fungi and insects (Nicol, 1991; Wang and Chang, 1997). It is also a major component of insect’s cuticle (Fan et al., 2007). About 10% of the global aquatic products holds different types of chitinous wastes material. Deposition of chitin per year is more than 80,000 metric tons in the form of marine wastes (Wang and Chang, 1997). On the other hand, the dynamic process of sedimentation after removal of exoskeleton/molting (marine snow) is efficiently catabolized and degraded by bacteria (Wang and Chang, 1997; Cohen-Kupiec and Chet, 1998).
Chitin is degraded by chitinolytic enzyme (chitinase). Among microorganisms, bacterial chitinase play significant role in the degradation process but the use of bacterial chitinase in commercial market is restricted owing to huge production cost and lower enzyme yield (Patil et al., 2000; Huang and Chen, 2004). Almost all of the reported researches on chitinase producing strains use colloidal chitin or chitin as a main carbon source (Wang et al., 1999) which is one of the expensive medium ingredient. On the other hand, agri-wastes which are produced in developing agricultural countries like Pakistan in huge amounts are good potential candidates to use as component of chitinase producing medium. The utilization of these wastes in medium not only reduces the production cost but also support to reduce the waste pollution. Keeping this in mind, the present study was planned to design/optimized agri-waste based medium employing response surface methodology in order to deal with multifactorial components at a time for enhance low cost chitinase production.
MATERIALS AND METHODS
Isolation of chitinase producing bacteria
Samples were taken from local termites’ influenced different garden and agricultural areas in the vicinity of University of the Punjab, Lahore, Pakistan. Chitinase producing medium (CPM) was adapted from Tasharrofi et al. (2011), Jholapara et al. (2013) and Singh et al. (2013) with slight modification for isolation of chitinolytic bacteria. The composition of CPM was (g/L; chitin 12, ammonium sulfate 1.0, potassium dihydrogen phosphate 0.2, dipotassium hydrogen phosphate 1.6, sodium chloride 0.1, magnesium sulfate pentahydrate 0.2, calcium chloride dihydrate 0.02, and agar agar 15) with pH 7.0. Bacteria were enriched by adding 1 g of a soil sample in 10 ml of the chitinase producing broth (CPB) and incubated at 37 oC for 3 days at 180 rpm after heat shocked treatment at 80 oC for 10 min. Distinct colonies were appeared after spreading (50 µl) of above enriched culture on CMP plates incubated at 37 °C for 72 h. Colonies showing zones of chitin hydrolysis were selected and further processed for the pure culturing by streaking method. Only those colonies were elected which showed most prominent clear zones on CPM and proceeded to screen the highest chitinase producing strain based on chitinase assay. The chitinase producing strains cultured in CPB and incubated at 37 °C for 72 h. After incubation, the culture was centrifuged at 10,000 rpm for 20 minutes at 4 °C. The cultural filtrate was used in chitinase assay.
Colloidal chitin preparation
Demineralization
Chitin flakes was taken as a raw material for the formation of colloidal chitin. During demineralization, 5g of chitin was treated with 60 ml of concentrated HCl with shaking incubation at 37oC for 2 h. After filtration, 200 ml of 70% ethanol was added in filtrate with continuous stirring. The precipitate was separated using Whattman paper No. 1. The effect of acid was neutralized after washing the precipitates with distilled water (Jholapara et al., 2013; Kaya et al., 2015).
Deproteinization
The precipitates were further treated with 60 ml of 0.3 M NaOH solution for 1 h in shaking incubator at 60oC. The sample was further filtered using Whattman paper No. 1 treated with distilled water until pH 7 was maintained (Jholapara et al., 2013; Kaya et al., 2015).
Chitinase estimation
Chitinase was estimated by calculating released amount of reducing sugars from the substrate (chitin) as described by Sadfi et al. (2001). Reaction mixture containing 0.5 ml of a cultural filtrate and 0.5 ml of colloidal chitin suspension in 0.1 M acetate buffer of pH 5.0. Then reaction mixture was incubated at 50°C for 30 min. The reaction was terminated by adding 1 ml of DNS reagent and then reaction mixture was boiled at 100°C for 10 min in a boiling water bath. After cooling to room temperature, centrifugation of the mixture was carried out at 10,000 rpm for 10 min and absorption of the supernatant was measured at 540 nm. One unit of chitinase was described as 1 micromole of GlcNAc per milligram of protein per minute.
Molecular identification of bacterium
The strain having highest chitinase production potential was identified through 16S rRNA gene sequencing. The detailed procedure used for molecular identification of the bacterium was adapted from Majeed et al. (2016). The sequence was aligned using CLUSTAL W 1.81 (Thompson et al., 1994) and phylogenetic tree was constructed by Neighbor-Joining method in MEGA 5.0 software (Tamura et al., 2011).
Optimization of different physical parameters
Different physical parameters including pH, inoculum size, temperature and incubation period were optimized for the select bacterial isolate on the basis of chitinase production. The bacterial isolate (Bacillus subtilis) was cultivated at pH 5, 7 and 9 in to sterilized CPB. The culture was incubated at 37 oC for 3 days at 180 rpm. The chitinase production was estimation as described above. The CPB (optimized pH) were cultured with 1, 2, 3, 4, 5 and 6%, inocula and incubate at 37 ºC. Following 3 days of incubation, chitinase production was assayed. After optimization of pH and inoculum size, the bacterial isolate was inoculated with optimized inoculum size in sterilized CPB of optimized pH and incubated at 30 oC, 37 oC, 45 oC and 50 oC. Chitinase production was measured after 3 days of incubation. The select bacterial isolate was cultured in CPB at its predetermined growth optima (pH, inoculum size and temperature) for 2, 3, 4, 5 and 6 days. Chitinase at termination of each incubation period was assessed as described earlier.
Optimization of medium component by response surface methodology
Plackett-Burman design (PBD) was used to screen various medium components such as temperature, incubation time, inoculum size, pH, FeSO4.7H2O, KH2PO4, K2HPO4, MgSO4, NaCl, (NH4)2SO4, chitin, peptone, yeast extract, urea, CaCl2, rice straw, tryptone, Na2SO4 and NH4NO3). The higher (+1) and lower (-1) values of medium components are mentioned in Table I. The concentration of significant medium components that affecting chitinase production was optimized through central composite design (CCD) of response surface methodology. The CCD is most suitable for quadratic response surface and generates second order polynomial regression model. The relation between actual and coded values was described by the following equation.

Where xi and Xi are the coded and actual values of the independent variable, Xo is the actual value of the independent variable at the center point and ΔXi is the change of Xi. The response was calculated from the following equation using Minitab version 17 software (99th edition).
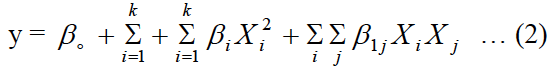
Where Y is the response, k is the number of variables, ß0 is the intercept, Xi and Xj are independent variables, ßi is the ith linear coefficient, ßii is the ith quadratic coefficient and ßij is the interaction coefficient.
Table I. Initial screening of chitinases production from Bacillus subtilis by using PB design.
|
Sr. No. |
Parameters |
Minimum value (-1) |
Maximum value (+1) |
|
1 |
Temperature ( oC) |
30 |
50 |
|
2 |
Time (h) |
24 |
96 |
|
3 |
Inoculum size (%) |
1 |
6 |
|
4 |
pH |
5 |
8 |
|
5 |
FeSO4. 7H2O (%) |
0.01 |
0.1 |
|
6 |
KH2PO4 (%) |
0.2 |
1 |
|
7 |
K2HPO4 (%) |
0.1 |
1.6 |
|
8 |
MgSO4 (%) |
0.05 |
0.2 |
|
9 |
NaCl (%) |
0.1 |
1 |
|
10 |
(NH4)2SO4 (%) |
0.1 |
1 |
|
11 |
Chitin (%) |
0.5 |
5 |
|
12 |
Peptone (%) |
0.05 |
5 |
|
13 |
Yeast extract (%) |
0.05 |
0.5 |
|
14 |
Urea (%) |
0.05 |
0.5 |
|
15 |
CaCl2 (%) |
0.02 |
0.2 |
|
16 |
Rice straw (%) |
0.5 |
5 |
|
17 |
Tryptone (%) |
0.5 |
5 |
|
18 |
Na2SO4 (%) |
0.33 |
3.24 |
|
19 |
NH4NO3 (%) |
0.03 |
0.3 |
RESULTS
Chitinase producing bacteria
In present study, twenty chitinase producing bacteria were isolated from termite affected soil on CPM. Among these twenty, three bacterial isolates (FA, FD and FI) were selected on the basis of clear zone formation (Fig. 1) and further tested for chitinase production in submerged fermentation (Fig. 2). Among these three, strain FD showed highest chitinase production which was identified by 16S rRNA gene sequencing. The sequence was aligned in BLAST for similarity which showed its resemblance with Bacillus subtilis having 100% similarity with other reported strains of Bacillus subtilis as shown by phylogenetic analysis (Fig. 3).
Optimization of physical parameter
Different physical parameters such as pH, inoculum size, temperature and incubation time was optimized by one factor at a time. B. subtilis showed different values for chitinase production for different pH values of CPB after 3 days of incubation at 180 rpm. The highest chitinase production (284.2 U/ml) was recorded at 7 pH. While at 5 pH, lowest chitinase production up to 83.22 U/ml was measured (Table II). Under the pre optimized conditions of pH, B. subtilis expressed best chitinase production (413.4 U/ml) with the inoculum size of 3%, after 3 days of incubation at 180 rpm. Whereas, at 1, 2, 4, 5, 6 inocula, chitinase production attain up to the levels of 92.40, 179.4, 309.6 and 246.9 U/ml, respectively (Table II). Optimization of incubation temperature of the B. subtilis for chitinase production was assessed at optimum pH and inoculum size. B. subtilis illustrated optimum chitinase production of 455.0 U/ml at 37 oC, after 3 days of incubation at 180 rpm. Minimum chitinase production 248.0 U/ml, 190.7 U/ml and 169.6 U/ml were recorded at 30 oC, 45 oC and 50 oC, respectively (Table II). The highest chitinase production (471.2U/ml) was obtained on 3rd day of incubation under pre-optimized pH, inoculum size and temperature condition. Chitinase production on 2nd, 4th, 5th and 6th days of incubation was 85.92, 197.7, 284.7, 232.9 and 126.4 U/ml, respectively (Table II).
Screening of medium components by Plackett–Burman design
In PBD, nineteen parameters were statistical analyzed. Among nineteen parameter, five parameters chitin, peptone, yeast extract, CaCl2 and rice straw with code K, L, M, O and P, respectively, were found significant and have prominently effects on chitinase production (Table III).
Optimum concentration of medium components using CCD
The CCD was conducted for the quantitative optimization of initially screened medium component (chitin, rice straw, CaCl2, peptone and yeast extract), by performing thirty two experiments. Among thirty-two runs, run No. 20 with concentration level of 5, 0.5, 0.05, 0.02 and 0.05 for chitin, rice straw, peptone, CaCl2 and yeast extract was calculated best for higher chitinase production, respectively Statistical analysis indicates significance of this model, showed maximum chitinase yields of 567.7 U/ml (Table IV).
These statistical design approach using PBD was used to study the interactive effects of various nutritional and physical factors on chitinase production by B. subtilis. The results obtained after CCD were then examined by standard analysis of variance (ANOVA), which gave the following regression equation (in terms of coded factors) of the levels of chitinase produced (Y) as a function of chitin (K), peptone (L), yeast extract (M), CaCl2 ( O) and rice straw ( P).
Table II. Optimization of physico-chemical parameters for chitinase production by Bacillus subtilis cultivated in CMB.
|
Parameter |
Magnitude |
Chitinase production (U/ml) |
|
Temperature (oC) |
30 |
248.0 b ±11.34 |
|
37 |
455.0 a ±14.59 |
|
|
45 |
190.7c±5.4040 |
|
|
50 |
169.6d ±10.26 |
|
|
pH |
5 |
83.22c±2.161 |
|
7 |
284.2a±0.013 |
|
|
9 |
101.5b±0.540 |
|
|
Inoculum size (%) |
1 |
92.40e±19.45 |
|
2 |
179.4d±19.99 |
|
|
3 |
413.4a±17.56 |
|
|
4 |
309.6b±14.05 |
|
|
5 |
246.9c±18.37 |
|
|
6 |
149.1d±5.944 |
|
|
Incubation time (days) |
1 |
85.92e±17.29 |
|
2 |
197.7c±5.404 |
|
|
3 |
471.2a±5.404 |
|
|
4 |
284.7b±0.648 |
|
|
5 |
232.9c±2.161 |
|
|
6 |
126.4d±7.025 |
Values represent Mean±SEM of three replicates (O.D at 540nm).
Statistical Analysis of the data by two-way ANOVA showing that there is significant variation (Significance level= 0.05) in growth among all bacterial isolates for respective parameters. Values which do not share an alphabet are significantly different from each other.
Chitinase (U/ml) = 264 + O (519) + K (108.6) + M (231) - L (557) - P (56.9) – O2 (7279) - K2 (8.12) - M2 (559) - L2 (261) + P2 (1.62) - O*K (199) + O*M (479) + O*L (2571) + O*P(279) - K*M (32.6) + K*L (58 .1) - K*P (7.47) + M*L (401) + M*P(77.7) + L*P (104.2)
ANOVA showed that the model was significant having P and F value of 0.014 and 3.76, respectively (Table V). The R2 value (a value of R2>0.75 indicates the aptness of the model) was in reasonable agreement with the adjusted R2. This certified a satisfactory adjustment of the experimental data in to quadratic model. The predicted value of chitinase was 542.4 U/ml which was near about to experimental value 567.7U/ml.
Table III. Plackett-burman design for chitinase production by Bacillus subtilis.
|
Run no. |
A |
B |
C |
D |
E |
F |
G |
H |
I |
J |
K |
L |
M |
N |
O |
P |
Q |
R |
S |
Chitinase (U/ml) |
|
1 |
50 |
24 |
1 |
5 |
0.004 |
0.4 |
0.64 |
0.02 |
0.4 |
0.2 |
0.2 |
0.02 |
0.2 |
0.2 |
0.08 |
2.0 |
0.2 |
1.296 |
0.012 |
599.8±11.34 |
|
2 |
50 |
24 |
6 |
8 |
0.004 |
0.08 |
0.64 |
0.08 |
0.4 |
0.2 |
0.2 |
0.2 |
0.02 |
0.2 |
0.008 |
0.2 |
0.2 |
0.132 |
0.12 |
142.6±14.59 |
|
3 |
50 |
96 |
1 |
8 |
0.04 |
0.08 |
0.04 |
0.08 |
0.4 |
0.2 |
2.0 |
0.02 |
0.2 |
0.02 |
0.08 |
0.2 |
0.2 |
0.132 |
0.012 |
197.7±5.404 |
|
4 |
30 |
24 |
6 |
8 |
0.04 |
0.4 |
0.04 |
0.08 |
0.004 |
0.2 |
0.2 |
0.02 |
0.02 |
0.02 |
0.08 |
2.0 |
0.2 |
1.296 |
0.12 |
193.4±2.161 |
|
5 |
30 |
96 |
1 |
8 |
0.004 |
0.08 |
0.04 |
0.02 |
0.4 |
0.2 |
0.2 |
0.2 |
0.2 |
0.02 |
0.008 |
2.0 |
2.0 |
1.296 |
0.12 |
345.8±10.26 |
|
6 |
30 |
24 |
1 |
5 |
0.04 |
0.4 |
0.04 |
0.08 |
0.4 |
0.04 |
0.2 |
0.2 |
0.2 |
0.2 |
0.08 |
0.2 |
2.0 |
0.132 |
0.12 |
319.3±17.29 |
|
7 |
30 |
96 |
6 |
5 |
0.04 |
0.4 |
0.04 |
0.02 |
0.4 |
0.2 |
2.0 |
0.2 |
0.02 |
0.2 |
0.008 |
2.0 |
0.2 |
0.132 |
0.012 |
399.3±5.404 |
|
8 |
30 |
24 |
6 |
8 |
0.004 |
0.4 |
0.64 |
0.02 |
0.004 |
0.2 |
2.0 |
0.2 |
0.2 |
0.02 |
0.08 |
0.2 |
2.0 |
0.132 |
0.012 |
87.5±2.161 |
|
9 |
30 |
96 |
1 |
5 |
0.004 |
0.08 |
0.64 |
0.08 |
0.004 |
0.2 |
2.0 |
0.02 |
0.02 |
0.2 |
0.08 |
2.0 |
2.0 |
0.132 |
0.12 |
76.7±7.025 |
|
10 |
50 |
24 |
1 |
8 |
0.04 |
0.4 |
0.64 |
0.02 |
0.4 |
0.04 |
2.0 |
0.02 |
0.02 |
0.02 |
0.008 |
2.0 |
2.0 |
0.132 |
0.12 |
471.2±0.648 |
|
11 |
50 |
96 |
1 |
5 |
0.04 |
0.4 |
0.64 |
0.08 |
0.004 |
0.2 |
0.2 |
0.2 |
0.02 |
0.02 |
0.008 |
0.2 |
2.0 |
1.296 |
0.012 |
322.3±15.29 |
|
12 |
30 |
96 |
6 |
5 |
0.004 |
0.4 |
0.64 |
0.08 |
0.4 |
0.04 |
2.0 |
0.02 |
0.2 |
0.02 |
0.008 |
0.2 |
0.2 |
1.296 |
0.12 |
344.2±1.161 |
|
13 |
30 |
24 |
1 |
5 |
0.004 |
0.08 |
0.04 |
0.02 |
0.004 |
0.04 |
0.2 |
0.02 |
0.02 |
0.02 |
0.008 |
0.2 |
0.2 |
0.132 |
0.012 |
235.6±19.37 |
|
14 |
30 |
24 |
1 |
8 |
0.04 |
0.08 |
0.64 |
0.08 |
0.004 |
0.04 |
2.0 |
0.2 |
0.2 |
0.2 |
0.008 |
2.0 |
0.2 |
1.296 |
0.012 |
348.0±19.99 |
|
15 |
50 |
24 |
6 |
5 |
0.04 |
0.08 |
0.04 |
0.02 |
0.004 |
0.2 |
2.0 |
0.02 |
0.2 |
0.2 |
0.008 |
0.2 |
2.0 |
1.296 |
0.12 |
405.3±0.648 |
|
16 |
30 |
96 |
6 |
8 |
0.04 |
0.08 |
0.64 |
0.02 |
0.4 |
0.04 |
0.2 |
0.02 |
0.02 |
0.2 |
0.08 |
0.2 |
2.0 |
1.296 |
0.012 |
73.4±0.480 |
|
17 |
50 |
96 |
1 |
8 |
0.004 |
0.4 |
0.04 |
0.02 |
0.004 |
0.04 |
2.0 |
0.2 |
0.02 |
0.2 |
0.08 |
0.2 |
0.2 |
1.296 |
0.12 |
128.0±0.823 |
|
18 |
50 |
96 |
6 |
8 |
0.004 |
0.4 |
0.04 |
0.08 |
0.004 |
0.04 |
0.2 |
0.02 |
0.2 |
0.2 |
0.008 |
2.0 |
2.0 |
0.132 |
0.012 |
231.2±5.404 |
|
19 |
50 |
96 |
6 |
5 |
0.04 |
0.08 |
0.64 |
0.02 |
0.004 |
0.04 |
0.2 |
0.2 |
0.2 |
0.02 |
0.08 |
2.0 |
0.2 |
0.132 |
0.12 |
114.5±2.304 |
|
20 |
50 |
24 |
6 |
5 |
0.004 |
0.08 |
0.04 |
0.08 |
0.4 |
0.04 |
2.0 |
0.2 |
0.02 |
0.02 |
0.08 |
2.0 |
2.0 |
1.296 |
0.012 |
23.7±0.404 |
Abbreviations: A, Temp; B, Incubation Time; C, Inoculum size; D, pH; E, FeSO4.7H2O; F, KH2PO4; G, K2HPO4; H, MgSO4; I, NaCl; J, (NH4)2SO4; K, Chitin; L, Peptone; M, Yeast extract; N, Urea; O, CaCl2; P, Rice straw; Q, Tryptone; R, Na2SO4; S, NH4NO3.
Contour plots of individual factors showing interaction of each other on chitinase production (Fig. 4). These plots indicated that each parameter exhibited significant effect on chitinase production by B. subtilis in submerge fermentation.
DISCUSSION
The chitinase producing bacteria were derived from termite influenced soil. Gohel et al. (2006) isolated chitinase producing bacteria from sea dump. Ali et al. (2020) isolated chitinase producing bacteria from marine shrimp shell wastes. Whereas, Singh et al. (2013) isolated chitinase producing bacteria from chick pea rhizosphere. Different sources of chitinase producing bacteria attributing the presence of chitin as a main carbon and nitrogen source for the chitinolytic bacterial growth. In present study, colloidal chitin was used for chitinase production. Taechowisan et al. (2003) reported that chitinase produced by Bacillus pumilus hydrolyzed colloidal chitin more rapidly than crude chitin (or from fungal cell walls derived chitin). Most of the commercially substantial chitinase is derived from Bacillus species. Thamthiankul et al. (2001) also produce chitinase from Bacillus thuringiensis subsp. pakistani. It is also believed that these bacteria are well known for their potentials to produce large amounts of chitinase with significant enzyme activity. The current study analyzed Bacillus subtilis for enhanced chitinase production.
Optimization of physical parameters plays significant role in enhanced production of enzyme. In present research work, optimization of pH, inoculum size, temperature and incubation period involved for chitinase production. Similarly, Jholapara et al. (2013) optimized physical conditions (pH and temperature) for chitinase production from soil derived chitinolytic bacteria. In this research, maximum chitinase production was recorded at pH 7. The variation in medium pH affect the production of enzymes. Similar findings reported by several researchers (Shanmugaiah et al., 2008; Gomaa, 2012). It means that optimal pH conditions of the medium are required for maximum enzyme production. Incubation temperature
Table IV. Relationship between chitinase production versus different concentration of medium components in central composite design.
|
Run # |
CaCl2 |
Chitin |
Yeast extract |
Peptone |
Rice straw |
Chitinase production (U/ml) |
|
1 |
0.29 |
2.75 |
0.275 |
0.275 |
2.75 |
197.25 |
|
2 |
0.11 |
7.25 |
0.275 |
0.275 |
2.75 |
296.32 |
|
3 |
0.02 |
0.5 |
0.05 |
0.5 |
0.5 |
71.87 |
|
4 |
0.11 |
2.75 |
0.275 |
0.275 |
2.75 |
407.64 |
|
5 |
0.02 |
5 |
0.5 |
0.5 |
0.5 |
301.00 |
|
6 |
0.02 |
0.5 |
0.05 |
0.05 |
5 |
91.33 |
|
7 |
0.11 |
2.75 |
0.275 |
0.275 |
2.75 |
423.31 |
|
8 |
0.11 |
2.75 |
0.275 |
0.275 |
7.25 |
522.03 |
|
9 |
0.02 |
5 |
0.05 |
0.5 |
5 |
306.23 |
|
10 |
0.11 |
2.75 |
0.275 |
0.275 |
2.75 |
333.79 |
|
11 |
0.2 |
0.5 |
0.05 |
0.05 |
0.5 |
96.37 |
|
12 |
0.11 |
2.75 |
0.275 |
-0.175 |
2.75 |
403.68 |
|
13 |
0.2 |
0.5 |
0.5 |
0.05 |
5 |
301.00 |
|
14 |
0.11 |
2.75 |
0.725 |
0.275 |
2.75 |
188.24 |
|
15 |
0.11 |
2.75 |
0.275 |
0.275 |
-1.75 |
241.20 |
|
16 |
0.2 |
5 |
0.05 |
0.5 |
0.5 |
298.30 |
|
17 |
0.11 |
2.75 |
0.275 |
0.725 |
2.75 |
188.24 |
|
18 |
0.2 |
0.5 |
0.05 |
0.5 |
5 |
302.98 |
|
19 |
0.11 |
2.75 |
-0.175 |
0.275 |
2.75 |
282.81 |
|
20 |
0.02 |
5 |
0.05 |
0.05 |
0.5 |
567.78 |
|
21 |
0.2 |
5 |
0.05 |
0.05 |
5 |
66.65 |
|
22 |
0.11 |
2.75 |
0.275 |
0.275 |
2.75 |
335.95 |
|
23 |
0.2 |
5 |
0.5 |
0.05 |
0.5 |
166.44 |
|
24 |
0.02 |
0.5 |
0.5 |
0.05 |
0.5 |
293.08 |
|
25 |
0.11 |
2.75 |
0.275 |
0.275 |
2.75 |
342.25 |
|
26 |
-0.07 |
2.75 |
0.275 |
0.275 |
2.75 |
28.64 |
|
27 |
0.02 |
0.5 |
0.5 |
0.5 |
5 |
141.40 |
|
28 |
0.11 |
-1.75 |
0.275 |
0.275 |
2.75 |
72.59 |
|
29 |
0.2 |
5 |
0.5 |
0.5 |
5 |
415.39 |
|
30 |
0.11 |
2.75 |
0.275 |
0.275 |
2.75 |
345.86 |
|
31 |
0.02 |
5 |
0.5 |
0.05 |
5 |
290.19 |
|
32 |
0.2 |
0.5 |
0.5 |
0.5 |
0.5 |
25.04 |
is also act as a main factor for the enzyme production. Different microbes showed different potential to produce chitinase under different temperature. Chitinase production increased with increase of inoculum size up to 3% and then decreased with further increase of inoculum size. Reduced enzyme production at higher concentrations of inoculum might be due to increased competition for nutrient uptake
Table V. ANOVA of chitinase production.
|
Sources |
df |
Adj SS |
Mean squares |
f-value |
p-value |
|
Model |
20 |
526908 |
26345 |
3.76 |
0.014 |
|
Linear |
5 |
124709 |
24942 |
3.56 |
0.037 |
|
CaCl2 (O) |
1 |
119 |
119 |
0.02 |
0.899 |
|
Chitin (K) |
1 |
98350 |
98350 |
14.05 |
0.003 |
|
Yeast extract (M) |
1 |
136 |
136 |
0.02 |
0.892 |
|
Peptone (L) |
1 |
8122 |
8122 |
1.16 |
0.304 |
|
Rice straw (P) |
1 |
17982 |
17982 |
2.57 |
0.137 |
|
Square |
5 |
163077 |
32615 |
4.66 |
0.016 |
|
O2 |
1 |
101974 |
101974 |
14.57 |
0.003 |
|
K2 |
1 |
49508 |
49508 |
7.07 |
0.022 |
|
M2 |
1 |
23519 |
23519 |
3.36 |
0.094 |
|
L2 |
1 |
5116 |
5116 |
0.73 |
0.411 |
|
P2 |
1 |
1975 |
1975 |
0.28 |
0.606 |
|
2-way interaction |
10 |
239121 |
23912 |
3.42 |
0.028 |
|
OK |
1 |
26093 |
26093 |
3.73 |
0.080 |
|
OM |
1 |
1503 |
1503 |
0.21 |
0.652 |
|
OL |
1 |
43380 |
43380 |
6.20 |
0.030 |
|
OP |
1 |
51127 |
51127 |
7.30 |
0.021 |
|
KM |
1 |
4353 |
4353 |
0.62 |
0.447 |
|
KL |
1 |
13826 |
13826 |
1.98 |
0.187 |
|
KP |
1 |
22909 |
22909 |
3.27 |
0.098 |
|
ML |
1 |
6607 |
6607 |
0.94 |
0.352 |
|
MP |
1 |
24772 |
24772 |
3.54 |
0.087 |
|
LP |
1 |
44551 |
44551 |
6.37 |
0.028 |
|
Error |
11 |
76990 |
6999 |
||
|
Lack of fit |
6 |
69070 |
11512 |
7.27 |
0.023 |
|
Pure error |
5 |
7921 |
1584 |
||
|
Total |
31 |
603898 |
and exhaustion of nutrients creating nutrient imbalance (Ramachandran et al., 2005; Roopesh et al., 2006). In present study, Bacillus subtilis produce highest chitinase production at 37 oC. Similarly, Bacillus cereus GS02 yielded highest chitinase production at 37 oC (Dukariya and Kumar, 2020). In another study, the highest chitinase yield from B.subtilis was measured at 30 oC (Narasimhan and Shivakumar, 2012). Karunya (2011) reported that B. subtitis yielded highest chitinase production at 35 oC. The variation in optimum temperature for chitinase production by different bacteria might be associated with the source of isolation of bacteria. In the present study, the crude enzyme increased with incubation time up to 3rd day and then decreased to end of the experiments (6 days).
In another study, characterization of chitinase from a new strain of Pseudomonas sp. also depicted optimization on 3rd day (Wang et al., 1999). Similar observations were also reported by Wang et al. (2001) that B. cereus, B. alvei and B. sphaericus produced highest chitinase after 48 h of incubation. Incubation for longer duration might cause decline in enzyme yield due to reduced nutrient level in the medium or it could also be the result of poisoning and denaturation of the enzyme by interaction with other components in the medium (Ramesh and Lonsane, 1987).
Chitinase production is significantly affected by the components presents in medium as well as environmental parameters on a larger scale. In this regard, PBD for nineteen variables was used for screening of medium components that prominently influenced chitinase formation. Ahmad et al. (2010) elucidated optimization of twelve variables by Stenotrophomonas maltophilia, using PBD. Narasimhan and Shivakumar (2012) also illustrated that PBD with eleven parameters for the optimization of chitinase formation by employing Bacillus subtilis. Gohel et al. (2006) studied effect of nineteen different medium components on chitinase production by marine isolate Pantoea dispersa, using PBD. The main purpose behind the use of this methodology is its efficiency and accuracy in results; as it is fast, relatively quicker, and easier to deal than other methods (Haddar et al., 2010).
Among nineteen factors, chitin, yeast extract, rice straw, peptone, CaCl2 showed positive effect on enzyme production while MgSO4 and FeSO4 7H2O, KH2PO4, K2HPO4, MgSO4, NaCl, (NH4)2SO4, Tryptone, Na2SO4 and NH4NO3 exhibited no significant . Agro-industrial waste (rice straw) is used for the formation of low cost medium for the production of chitinase enzyme. Chaiharn et al. (2013) also used rice straw as a substrate for chitinase by Bacillus thuringiensis. In the present study, after experimentation following CCD, it was observed that maximum chitinase produced corresponding to 0.02% CaCl2, 5% chitin, 0.05% yeast extract, 0.05% peptone and 0.5% rice straw Similarly, Sarker et al. (2019) optimize the concentrations of vermi wash, crab shell powder, Baker’s yeast and sugarcane molasses for maximizing the chitinase production using CCD. Similarly, Singh et al. (2013) optimized media components by employing central composite design to achieve the highest chitinase production. According to their results, among various nitrogen sources, yeast extract (0.1%) showed significant effect on chitinase as compare to ammonium sulphate and urea. Agro industrial wastes are alternative to fulfill the nutritive materials required for biotechnological fermentation. They are obviously economically advantageous due to low cost (Sánchez, 2009). Agro-industries is continuously adding massive amount of wastes to the environment exerting harmful effects to both plant and animal lives (Bacha et al., 2011).The bacterial isolates B. subtilis was cultivated in media containing rice straw (agro-industrial waste), showed chitinase yield up to 567.7 (U/ml) which was higher than CPM. Cultivation of the bacteria and its chitinase yield employing rice straw would render economic provision of the enzyme.
CONCLUSION
The present results could be considered as base line information for the development of enhance production of enzyme. In present study, the isolate Bacillus subtilis produce higher chitinase yield on rice straw based medium which was optimized following statistical designs of response surface methodology. The use of statistically designs tooptimize the medium components and concentration of medium components for maximum enzyme production is one of efficient approach. The present results also depicted that chitin may use as source of energy or inducer in medium for chitinase production.
ACKNOWLEDGMENT
Financial assistance by Pakistan Science Foundation for this study is gratefully acknowledged.
Statement of conflict of interest
The authors have declared no conflict of interest.
REFERENCES
Ahmad, K.M., Ahmad, M. and Javed, S., 2010. Optimization of culture media for enhanced chitinase production from a novel strain of Stenotrophomonas maltophilia using response surface methodology. J. Microbiol. Biotechnol., 20: 1597-1602. https://doi.org/10.4014/jmb.0909.09040
Ali, M.H., Aljadaani, S., Khan, J., Sindi, I., Aboras, M. and Aly, M.M., 2020. Isolation and molecular identification of two chitinase producing bacteria from marine shrimp shell wastes. Pakistan J. biol. Sci., 23: 139-149. https://doi.org/10.3923/pjbs.2020.139.149
Bacha, U., Nasir, M., Khalique, A., Anjum, A. and Jabbar, M. A., 2011. Comparative assessment of various agro-industrial wastes for Saccharomyces cerevisiae biomass production and its quality evaluation as single cell protein. J. Anim. Pl. Sci. Anim. Pl. Sci., 21: 844-849.
Chaiharn, M., Lumyong, S., Hasan, N. and Plikomol, A., 2013. Solid-state cultivation of Bacillus thuringiensis R 176 with shrimp shells and rice straw as a substrate for chitinase production. Annls Microbiol., 63: 443-450. https://doi.org/10.1007/s13213-012-0488-6
Cohen-Kupiec, R. and Chet, I., 1998. The molecular biology of chitin digestion. Curr. Opin. Biotechnol., 9: 270-277. https://doi.org/10.1016/S0958-1669(98)80058-X
Dahiya, N., Tewari, R. and Hoondal, G.S., 2006. Biotechnological aspects of chitinolytic enzymes: A review. Appl. Microbial. Biotechnol., 71: 773-782. https://doi.org/10.1007/s00253-005-0183-7
Deeba, F., Shakir, H.A., Irfan, M. and Qazi, J.I., 2016. Chitinase production in organisms: A review. Punjab Univ. J. Zool., 31: 101-106.
Dukariya, G. and Kumar, A., 2020. Chitinase production from locally isolated Bacillus cereus GS02 from chitinous waste enriched soil. J. Adv. Biol. Biotechnol., 23: 39-48. https://doi.org/10.9734/jabb/2020/v23i130137
Fan, Y., Fang, W., Guo, S., Pei, X., Zhang, Y., Xiao, Y., Li, D., Jin, K., Bidochka, M.J. and Pei, Y., 2007. Increased insect virulence in Beauveria bassiana strains overexpressing an engineered chitinase. Appl. environ. Microbiol., 73: 295-302. https://doi.org/10.1128/AEM.01974-06
Gohel, V., Chaudhary, T., Vyas, P. and Chhatpar, H.S., 2006. Statistical screenings of medium components for the production of chitinase by the marine isolate Pantoea dispersa. Biochem. Eng. J., 28: 50-56. https://doi.org/10.1016/j.bej.2005.09.002
Gomaa, E.Z., 2012. Chitinase production by Bacillus thuringiensis and Bacillus licheniformis: their potential in antifungal biocontrol. J. Microbiol., 50: 103-111. https://doi.org/10.1007/s12275-012-1343-y
Haddar, A., Fakhfakh-Zouari, N., Hmidet, N., Frikha, F., Nasri, M. and Kamoun, A.S., 2010. Low-cost fermentation medium for alkaline protease production by Bacillus mojavensis A21 using hulled grain of wheat and sardinella peptone. J. Biosci. Bioeng., 10: 288–294. https://doi.org/10.1016/j.jbiosc.2010.03.015
Huang, C.J. and Chen, C.Y., 2004. Gene cloning and biochemical characterization of chitinase CH from Bacillus cereus 28-9. Annls Microbiol., 54: 289-298.
Islam, R., and Datta, B., 2015. Diversity of chitinases and their industrial potential.
Int. J. appl. Res., 1: 55-60.
Jholapara, R.J., Mehta, R.S. and Sawant, C.S., 2013. Optimization of cultural conditions for chitinase production from chitinolytic bacterium isolated from soil sample. Int. J. Pharmaceut. biol. Sci., 4: 464-471.
Karunya, S.K., 2011. Optimization and purification of chitinase produced by Bacillus subtilis and its antifungal activity against plant pathogens. Int. J. Pharmaceut. biol. Arch., 2:1680–1685.
Kaya, M., Baublys, V., Šatkauskienė, I., Akyuz, B., Bulut, E. and Tubelytė, V., 2015. First chitin extraction from Plumatella repens (Bryozoa) with comparison to chitins of insect and fungal origin. Int. J. Biol. Macromol., 79: 126-132. https://doi.org/10.1016/j.ijbiomac.2015.04.066
Majeed, H.S., Irfan, M., Shakir, H.A. and Qazi, J.I., 2016. Filter paper activity producing potential of Aeromonas species isolated from the gut of Labeo rohita. Pakistan J. Zool., 48:1317-1323.
Muzzarelli, R.A., 1996. Chitin Enzymology. Atec. Edizioni, 20: 12-16.
Narasimhan, A. and Shivakumar, S., 2012. Optimization of chitinase produced by a biocontrol strain of Bacillus subtilis using Plackett-Burman design. Eur. J. exp. Biol., 2: 861-865.
Nicol, S., 1991. Life after death for empty shells. New Sci., 129: 46-48.
Patil, R.S., Ghormade, V. and Deshpande, M.V., 2000. Chitinolytic enzymes: An exploration. Enzyme Microbial Technol., 26: 473-483. https://doi.org/10.1016/S0141-0229(00)00134-4
Ramachandran, S., Bairagi, A. and Ray, A.K., 2005. Improvement of nutritive value of grass pea (Lathyrus sativus) seed meal in the formulated diets for rohu, Labeo rohita (Hamilton) fingerlings after fermentation with a fish gut bacterium. Bioresour. Technol., 96: 1465-1472. https://doi.org/10.1016/j.biortech.2004.12.002
Ramesh, M.V. and Lonsane, B.K., 1987. Solid state fermentation for production of α-amylase by Bacillus megaterium 16M. Biotechnol. Lett., 9: 323–328. https://doi.org/10.1007/BF01025797
Roopesh, K., Ramachandran, S., Nampoothiri, K.M., Szakacs, G. and Pandey, A., 2006. Comparison of phytase production on wheat bran and oilcakes in solid-state fermentation by Mucor racemosus. Bioresour. Technol., 97: 506-511. https://doi.org/10.1016/j.biortech.2005.02.046
Sadfi, N., Cherif, M., Fliss I., Boudabbous A. and Antoun H., 2001. Evaluation of Bacillus isolates from salty soils and Bacillus thuringiensis strains for the biocontrol of Fusarium dry rot of potato tubers. J. Pl. Pathol., 83: 101-118.
Sánchez, C., 2009. Lignocellulosic residues: biodegradation and bioconversion by fungi. Biotechnol. Adv., 27: 185-194. https://doi.org/10.1016/j.biotechadv.2008.11.001
Sarker, K.N., Mohapatra, P.K.D. and Dutta, S., 2019. Use of low cost natural resources for enhanced chitinase production and optimization using CCD and RSM: A new initiative for bio-control of plant pathogen. Indian Phytopathol., 72: 281–300. https://doi.org/10.1007/s42360-019-00143-8
Shanmugaiah, V., Mathivanan, N., Balasubramanian, N. and Manoharan, P.T., 2008. Optimization of cultural conditions for production of chitinase by Bacillus laterosporous MML2270 isolated from rice rhizosphere soil. Afr. J. Biotechnol., 7: 2562-2568.
Singh, R.K., Kumar, D.P., Solanki, M.K., Singh, P., Srivastva, A.K., Kumar, S. and Arora, D.K., 2013. Optimization of media components for chitinase production by chickpea rhizosphere associated Lysinibacillus fusiformis B-CM18. J. Basic Microbiol., 53: 451-460. https://doi.org/10.1002/jobm.201100590
Taechowisan, T., Peberdy, J.F. and Lumyong, S., 2003. Chitinase production by endophytic Streptomyces aureofaciens CMU Ac 130 and its antagonism against phytopathogenic fungi. Annls Microbiol., 53: 447–461.
Tamura, K., Stecher, G., Peterson, D., Filipski, A. and Kumar, S., 2013. MEGA6: Molecular evolutionary genetics analysis version 6.0. Mol. Biol. Evol., 30: 2725-2729.
Tasharrofi, N., Adrangi, S., Fazeli, M., Rastegar, H., Khoshayand, M.R., and Faramarzi, M.A., 2011. Optimization of chitinase production by Bacillus pumilus using Plackett-Burman design and response surface methodology. Iran. J. Pharmaceut. Res., 4: 759-768.
Thamthiankul, S., Suan-Ngay, S., Tantimavanich, S. and Panbangred, W., 2001. Chitinase from Bacillus thuringiensis subsp. pakistani. App.. Microbiol. Biotechnol., 56: 395-401. https://doi.org/10.1007/s002530100630
Thompson, J.D., Higgins, D.G., and Gibson, T.J.,1994. CLUSTAL W: Improving the sensitivity of progressive multiple sequence alignment through sequence weighting, position-specific gap penalties and weight matrix choice. Nucleic Acids Res., 22: 4673-4680.
Wang, S.L. and Chang, W.T., 1997. Purification and characterization of two bifunctional chitinases/lysozymes extracellularly produced by Pseudomonas aeruginosa K-187 in a shrimp and crab shell powder medium. Appl. environ. Microbiol., 63: 380-386. https://doi.org/10.1128/AEM.63.2.380-386.1997
Wang, S.L., Yieh, T.C. and Shih, L., 1999. Production of antifungal compounds by Pseudomonas aeruginosa K-187 using shrimp and crab shell powder as a carbon source. Enzyme Microb. Technol., 25: 142-148. https://doi.org/10.1016/S0141-0229(99)00024-1
Wang, S.Y., Moyne, A.L., Thottappilly, G., Wu, S.J., Locy, R.D. and Singh, N.K., 2001. Purification and characterization of a Bacillus cereus exochitinase. Enzyme Microb. Technol., 28: 492-498. https://doi.org/10.1016/S0141-0229(00)00362-8
To share on other social networks, click on any share button. What are these?


