

Uncovering the Role of Ribosomal Protein L8 in Milk Fat Synthesis Mechanisms in Yak Mammary Epithelial Cells


Uncovering the Role of Ribosomal Protein L8 in Milk Fat Synthesis Mechanisms in Yak Mammary Epithelial Cells
Nan Jiang1,2, Chaochao Luo3, Mingying Shao4, Ziping Zheng4, Qudrat Ullah6, Muhammad Zahoor Khan5,6*, Guangming Sun2, Dun-Zhu Luosang2, Rubina Mushtaq7, Yulin Ma5 and Wang-Dui Basang1,2*
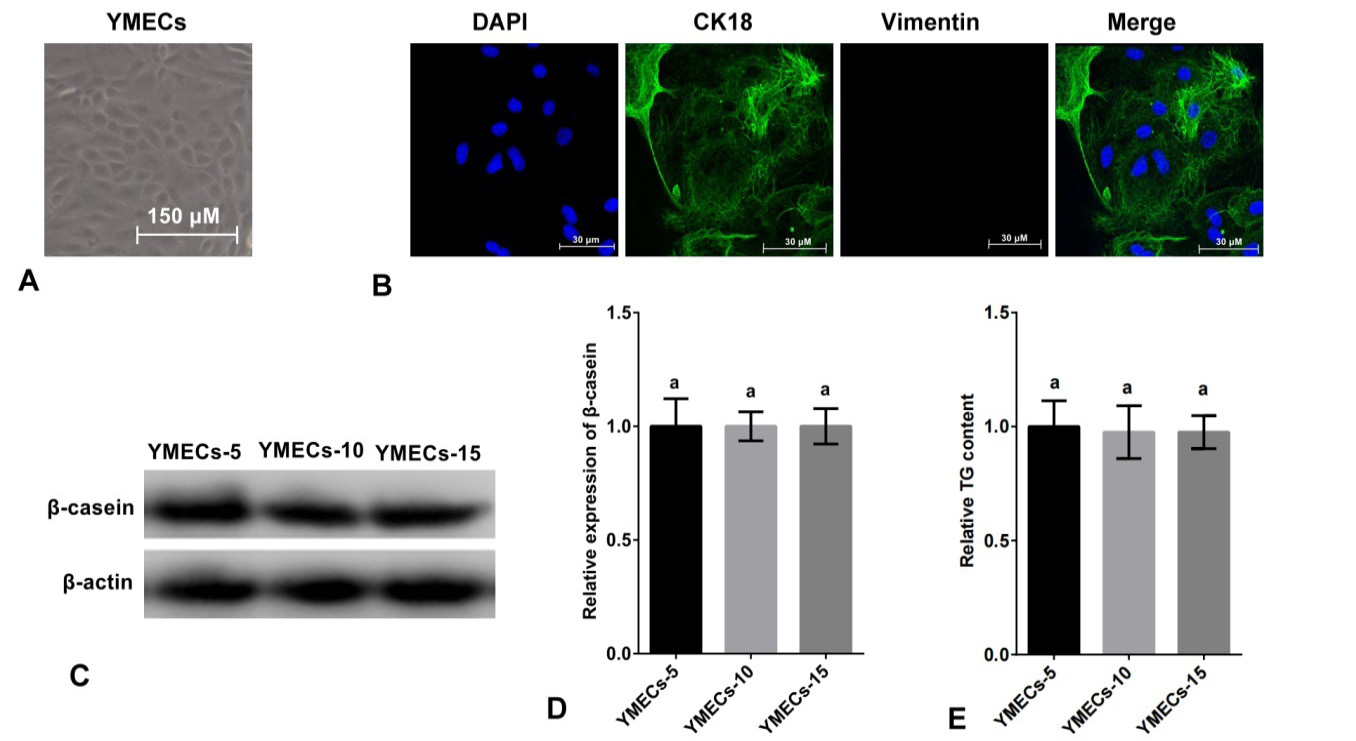
Identification of purified YMECs. A: Cell morphology (100×). B: Expression of CK18 in YMECs (400×). Cell nucleus were dyed with DAPI (blue), CK18 was visualized with Alexa Fluor 488 conjugated antibody (green) and vimentin (a marker of fibroblast, used as negative control) was visualized with Alexa Fluor 647 conjugated antibody red. C-D: Expression of β-casein in YMECs within 15 generations. E: Secretion of TG of YMECs within 15 generations. YMECs-5, 10 or 15: YMECs were 5, 10 or 15 generations, respectively.
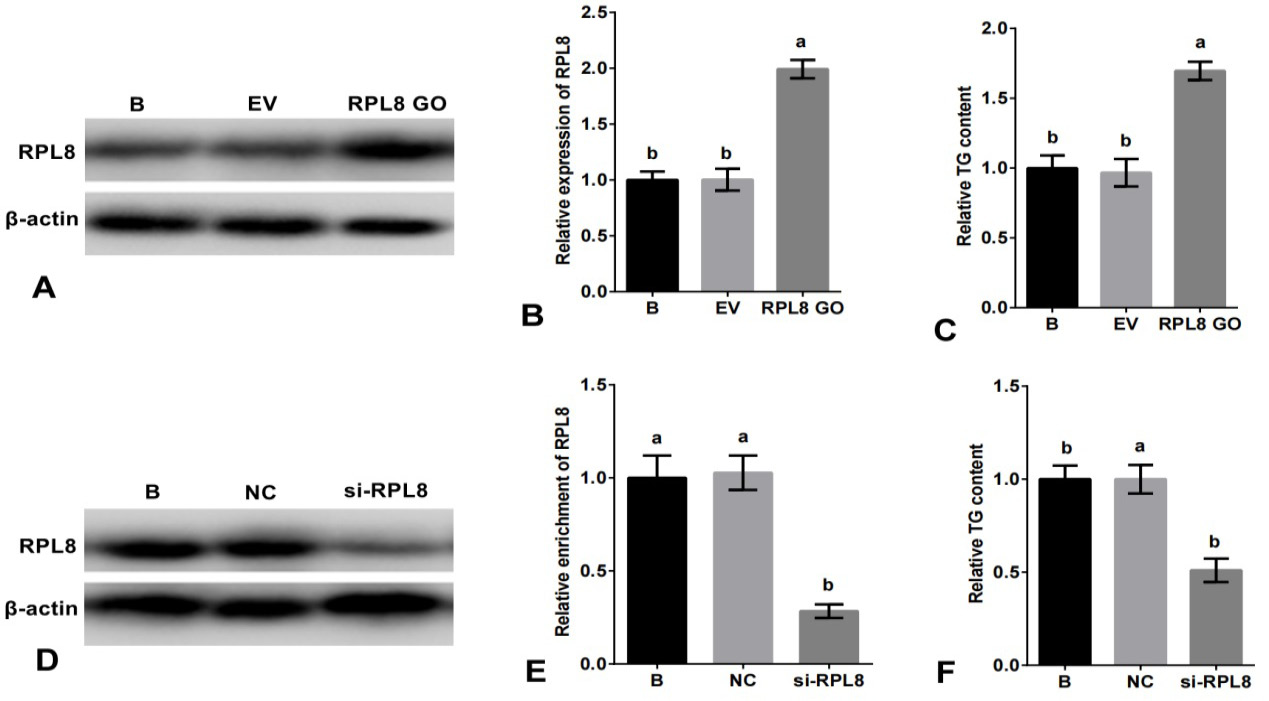
Role of RPL8 in promoting milk fat synthesis in YMECs. In A-B, the expression of RPL8 was increased in YMECs subjected to RPL8 over-expression. Similarly, C shows increased TG secretion following RPL8 over-expression in YMECs. On the other hand, D-E demonstrates a decrease in RPL8 expression in YMECs treated with RPL8 silencing. Furthermore, F depicts a decrease in TG secretion in YMECs subjected to RPL8 silencing. In B and E, the expression of RPL8 in the “B” group was set to “1”, while in C and F, the secretion of TG in the “B” group was also set to “1”. Cells were divided into different groups, including those that were not transfected B, those that were transfected with the empty vector (EV), those that were transfected with the RPL8 over-expression vector (RPL8 GO), those that were transfected with the negative control siRNA (NC), and those that were transfected with the RPL8 siRNA (Si-RPL8). In the bar charts, different superscript letters indicate significant differences (p<0.05), while the same letters indicate no significant difference (p>0.05).
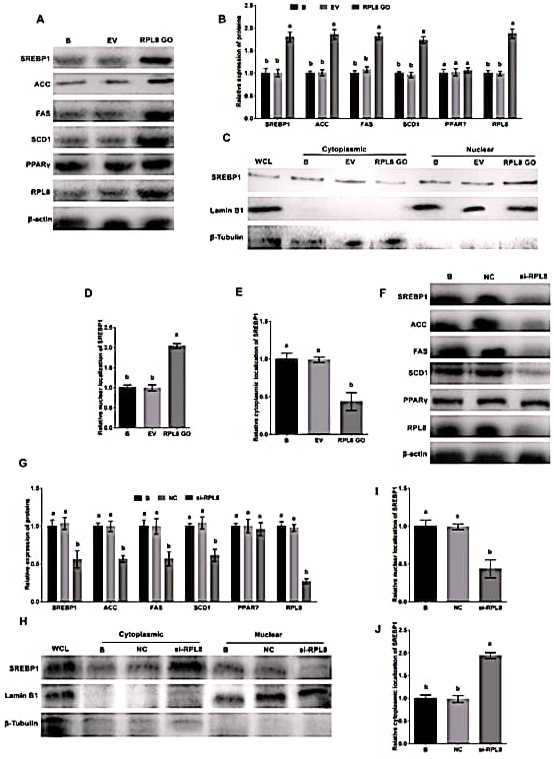
Activation of SREBP1 pathway by RPL8 in YMECs. In A-B, the expression of RPL8, ACC, FAS, SCD1, SREBP1, and PPARγ was evaluated in YMECs subjected to RPL8 overexpression. The nuclear and cytoplasmic localization of SREBP1 was also assessed in cells treated with RPL8 overexpression, as depicted in C-E. The results showed that the expression of these proteins, as well as the nuclear localization of SREBP1, was significantly increased in cells with RPL8 overexpression. Conversely, F-G displays the expression of RPL8, ACC, FAS, SCD1, SREBP1, and PPARγ in YMECs treated with RPL8 silencing. Similarly, H-J demonstrates the nuclear and cytoplasmic localization of SREBP1 in cells treated with RPL8 silencing. The results showed that the expression of these proteins, as well as the nuclear localization of SREBP1, was significantly decreased in cells with RPL8 silencing. In B and G, the expression of proteins in the “B” group was set to “1”. In D and I, the nuclear localization of SREBP1 in the “B” group was set to “1”, while in E and J, the cytoplasmic localization of SREBP1 in the “B” group was also set to “1”. Cells were divided into different groups, including those that were not transfected B, those that were transfected with the empty vector (EV), those that were transfected with the RPL8 overexpression vector (RPL8 GO), those that were treated with whole cell lysate (WCL), those that were transfected with the negative control siRNA (NC), and those that were transfected with the RPL8 siRNA (Si-RPL8). In the bar charts, different superscript letters indicate significant differences (p<0.05), while the same letters represent no significant difference (p>0.05).
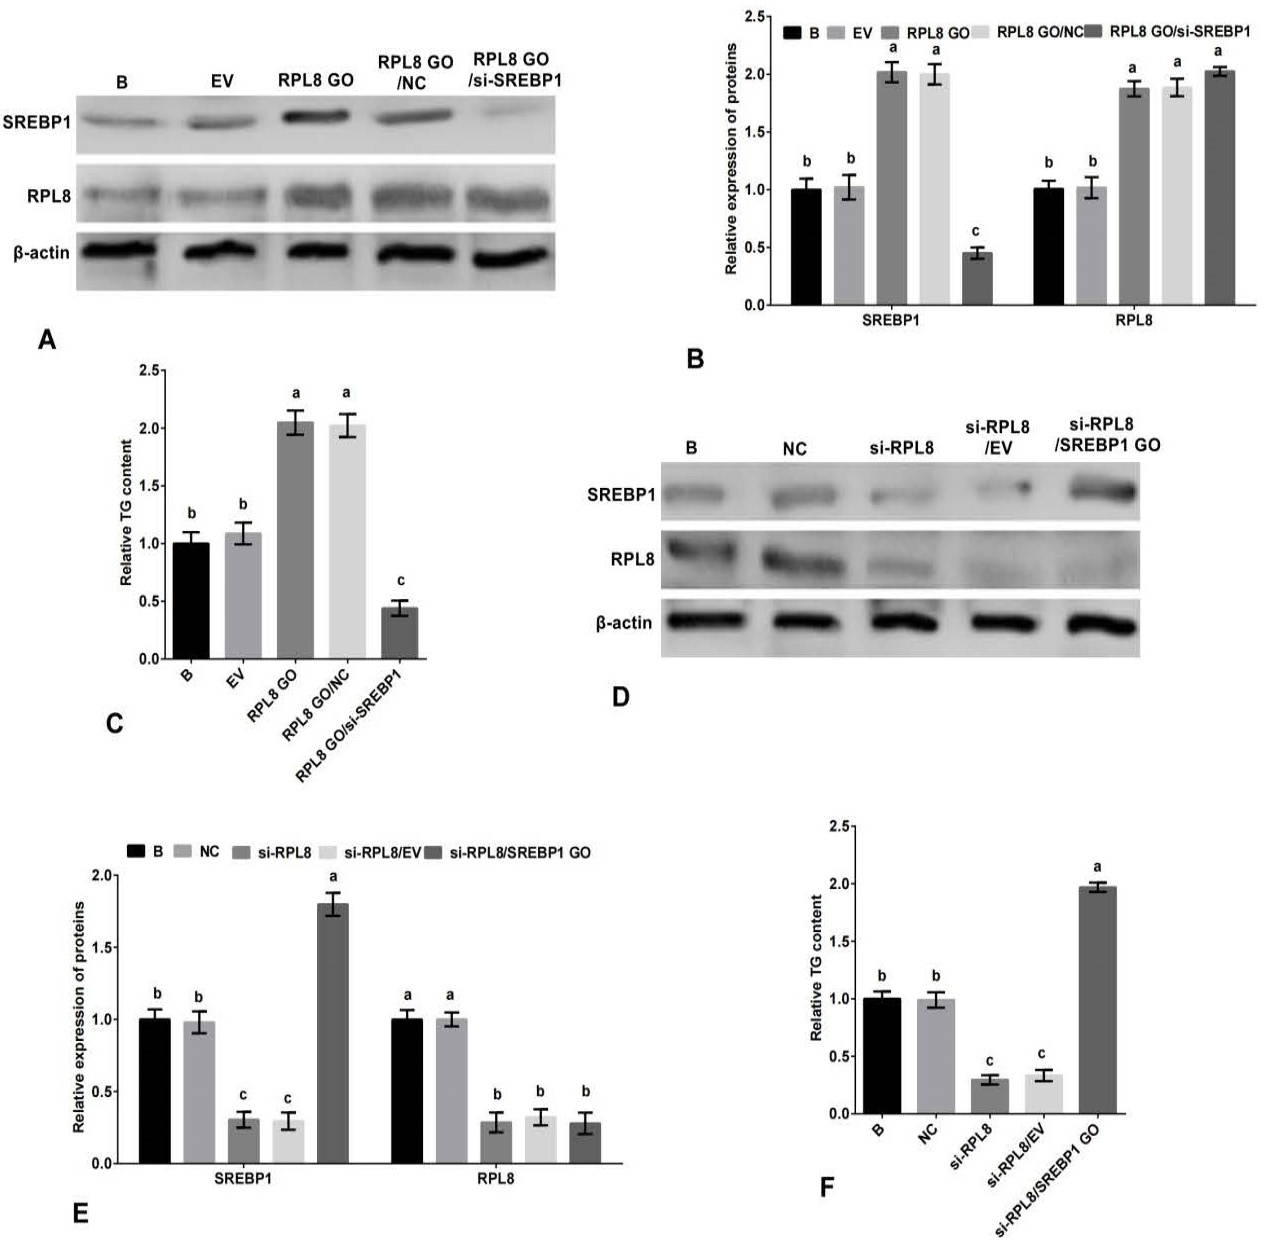
Promotion of milk fat synthesis by RPL8 through the SREBP1 pathway in YMECs. A-B The expression of RPL8 and SREBP1 in YMECs treated with RPL8 overexpression or RPL8 overexpression/SREBP1 silencing. C, The secretion of TG in YMECs treated with RPL8 overexpression or RPL8 overexpression/SREBP1 silencing. D-E, The expression of RPL8 and SREBP1 in YMECs treated with RPL8 silencing or RPL8 silencing/SREBP1 overexpression. F, the secretion of TG in YMECs treated with RPL8 silencing or RPL8 silencing/SREBP1 overexpression. In B and E, the expression of RPL8 and SREBP1 in “B” group was set to “1”. In C and F, the secretion of TG in “B” group was set to “1”. B: cells were no transfected. EV: cells were transfected with the empty vector. RPL8 GO: cells were transfected with RPL8 overexpression vector. NC: cells were transfected with the negative control siRNA. si-RPL8: cells were transfected with the RPL8 siRNA. RPL8 GO/ si-SREBP1: cells were co-transfected with the RPL8 overexpression vector and SREBP1 siRNA. In the bar charts, different superscript letters indicate significant differences (p<0.05), while the same letters represent no significant difference (p<0.05).
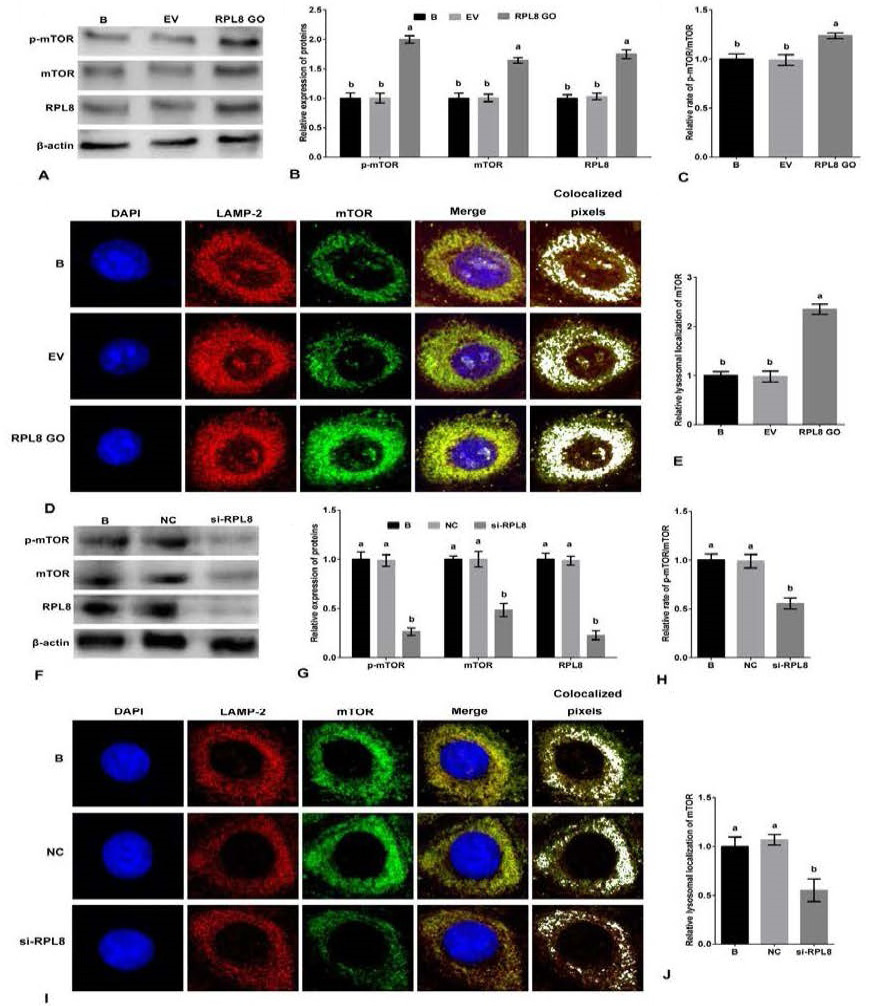
Activation of mTORC1 pathway by RPL8 in YMECs. A-B, the expression of mTOR and p-mTOR in YMECs treated with RPL8 overexpression. C, the rate of p-mTOR/mTOR in YMECs treated with RPL8 overexpression. D-E, the lysosomal localization of mTOR in YMECs treated with RPL8 overexpression. F-G, the expression of mTOR and p-mTOR in YMECs treated with RPL8 silencing. H, the rate of pmTOR/mTOR in YMECs treated with RPL8 silencing. I-J, the lysosomal localization of mTOR in YMECs treated with RPL8 silencing. In B and G, the expression of mTOR and p-mTOR in “B” group was set to “1”. In C and H, the rate of p-mTOR/mTOR in “B” group was set to “1”. In D and I, the colocalization between LAMP2 (green) and mTOR (red) was visualized and quantified using the ImageJ colocalization finder plugin (white). B: cells were no transfected. EV: cells were transfected with the empty vector. RPL8 GO: cells were transfected with RPL8 overexpression vector. NC: cells were transfected with the negative control siRNA. si-RPL8: cells were transfected with the RPL8 siRNA. In the bar charts, different superscript letters indicate significant differences (p<0.05), while the same letters represent no significant difference (p<0.05).
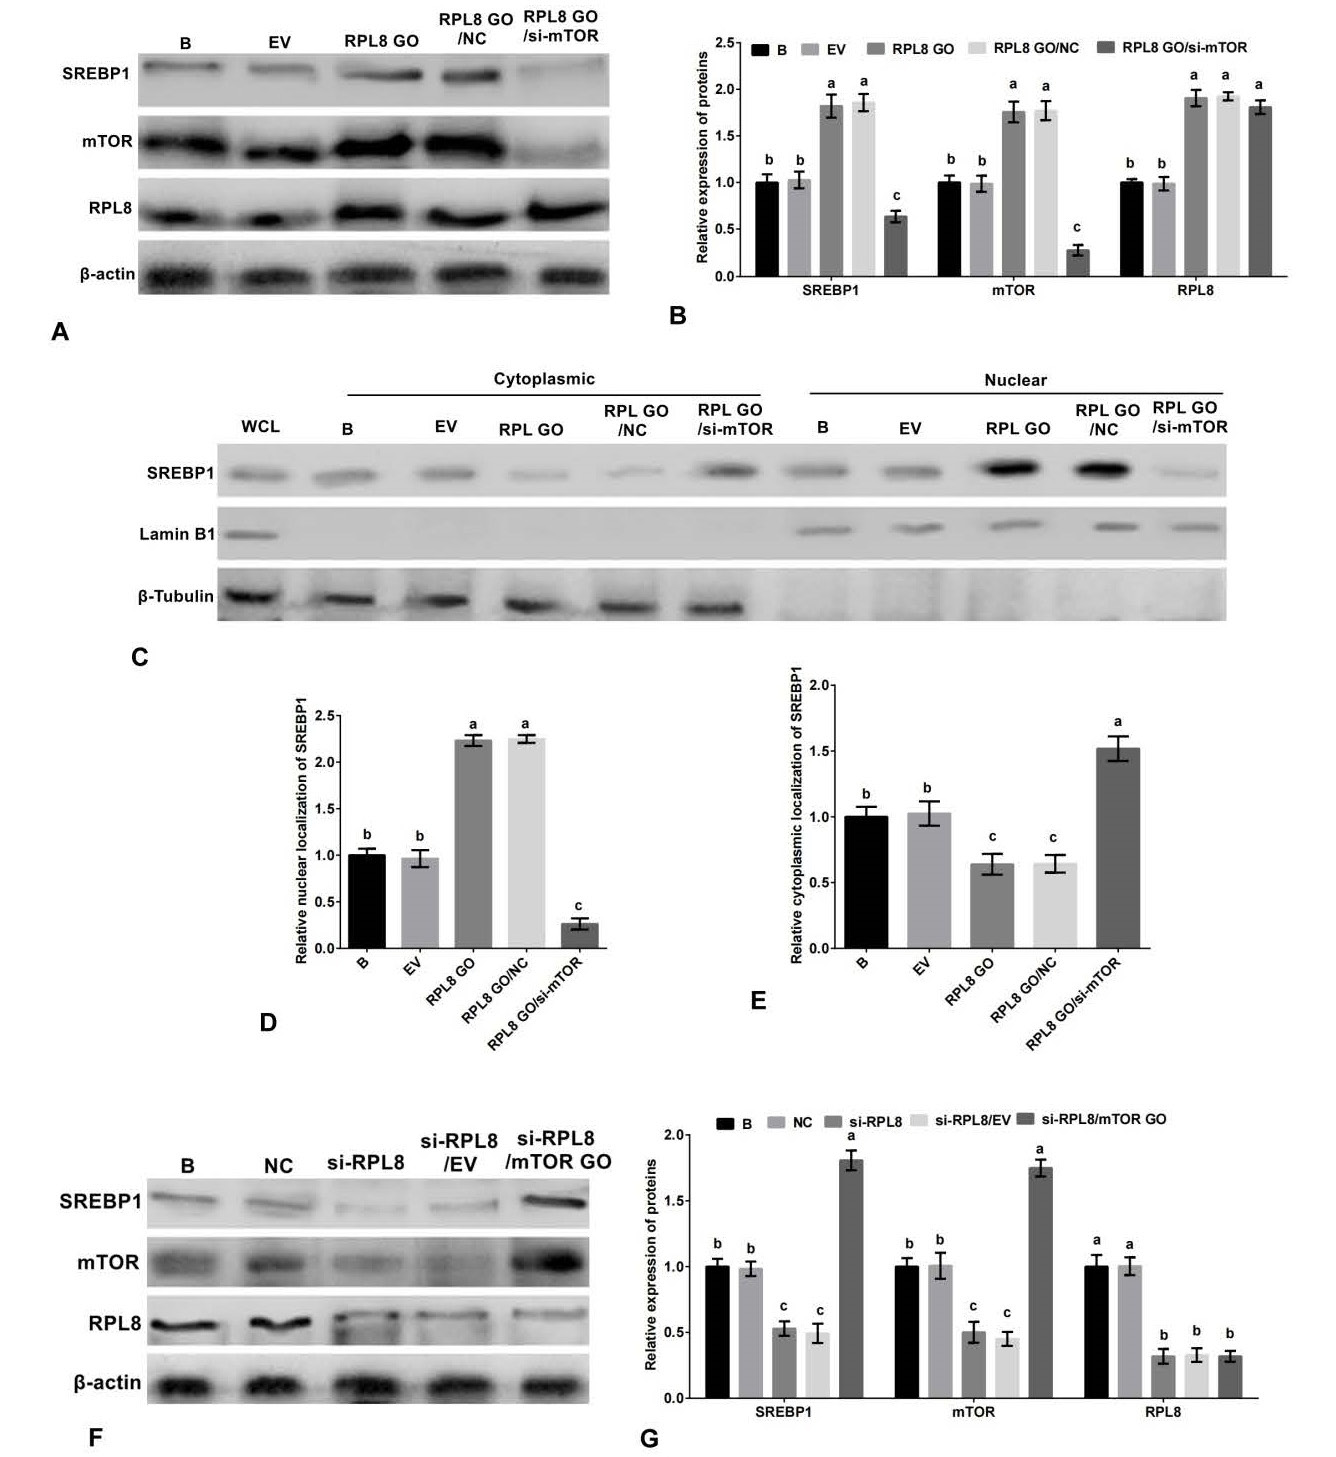
RPL8 activates the SREBP1 pathway through mTORC1 in YMECs. A-B, the expression of SREBP1, mTOR and RPL8 in YMECs treated with RPL8 overexpression or RPL8 overexpression/mTOR silencing. C-E, the nuclear localization (C-D) and cytoplasmic localization (C and E) of SREBP1 in cells treated with RPL8 overexpression or RPL8 overexpression/mTOR silencing. F-G, the expression of SREBP1, mTOR and RPL8 in YMECs treated with RPL8 silencing or RPL8 silencing/mTOR overexpression. Protein expression in the “B” group was standardized to “1” in B and G, while SREBP1 localization in the nucleus and cytoplasm of the “B” group was standardized to “1” in D and E, respectively. The experimental groups were categorized as WCL (whole cell lysate), B (non-transfected cells), EV (cells transfected with empty vector), RPL8 GO (cells transfected with RPL8 overexpression vector), NC (cells transfected with negative control siRNA), Si-RPL8 (cells transfected with RPL8 siRNA), and RPL8 GO/si-mTOR (cells co-transfected with RPL8 overexpression vector and mTOR siRNA). The bar charts display superscript letters indicating significant differences (p<0.05) between different experimental groups, while identical letters indicate no significant difference (p<0.05).
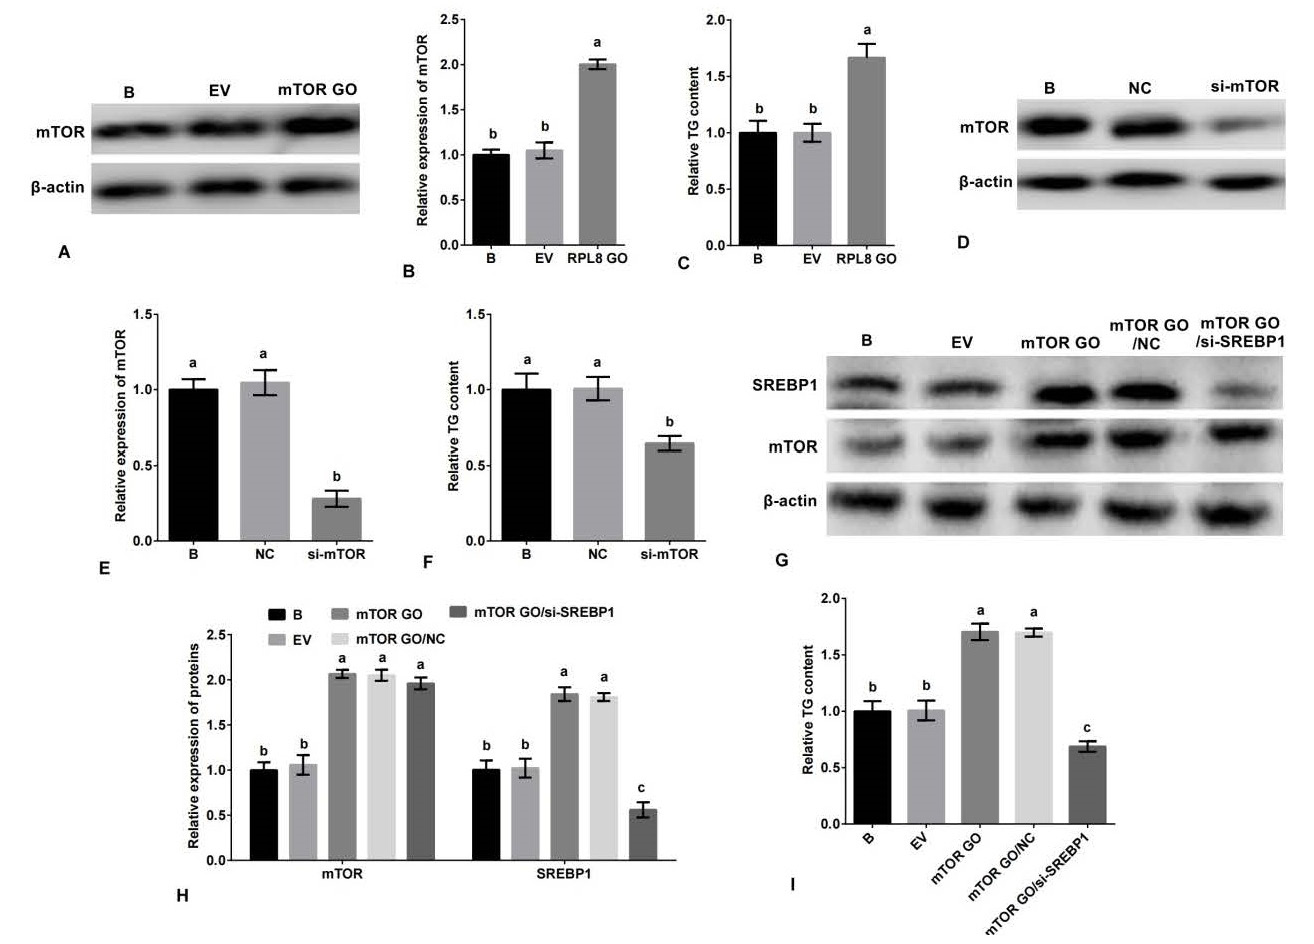
mTORC1 promotes milk fat synthesis in YMECs through the SREBP1 pathway. Specifically, the expression of mTOR in YMECs treated with mTOR overexpression is shown in A-B, while C displays the secretion of TG in YMECs treated with mTOR overexpression. The expression of mTOR in YMECs treated with mTOR silencing is depicted in D-E, and F shows the secretion of TG in YMECs treated with mTOR silencing. The expression of mTOR and SREBP1 in YMECs treated with mTOR overexpression or mTOR overexpression/SREBP1 silencing is shown in G-H, while I displays the secretion of TG in YMECs treated with mTOR overexpression or mTOR overexpression/SREBP1 silencing. In B, E, and H, the expression of mTOR or/and SREBP1 in the “B” group was set to “1”. In C, F, and I, the secretion of TG in the “B” group was set to “1”. The experimental groups were categorized as B (non-transfected cells), EV (cells transfected with empty vector), mTOR GO (cells transfected with mTOR overexpression vector), NC (cells transfected with negative control siRNA), si-mTOR (cells transfected with mTOR siRNA), and mTOR GO/si-SREBP1 (cells co-transfected with mTOR overexpression vector and SREBP1 siRNA). The bar charts display superscript letters indicating significant differences (p<0.05) between different experimental groups, while identical letters indicate no significant difference (p>0.05).
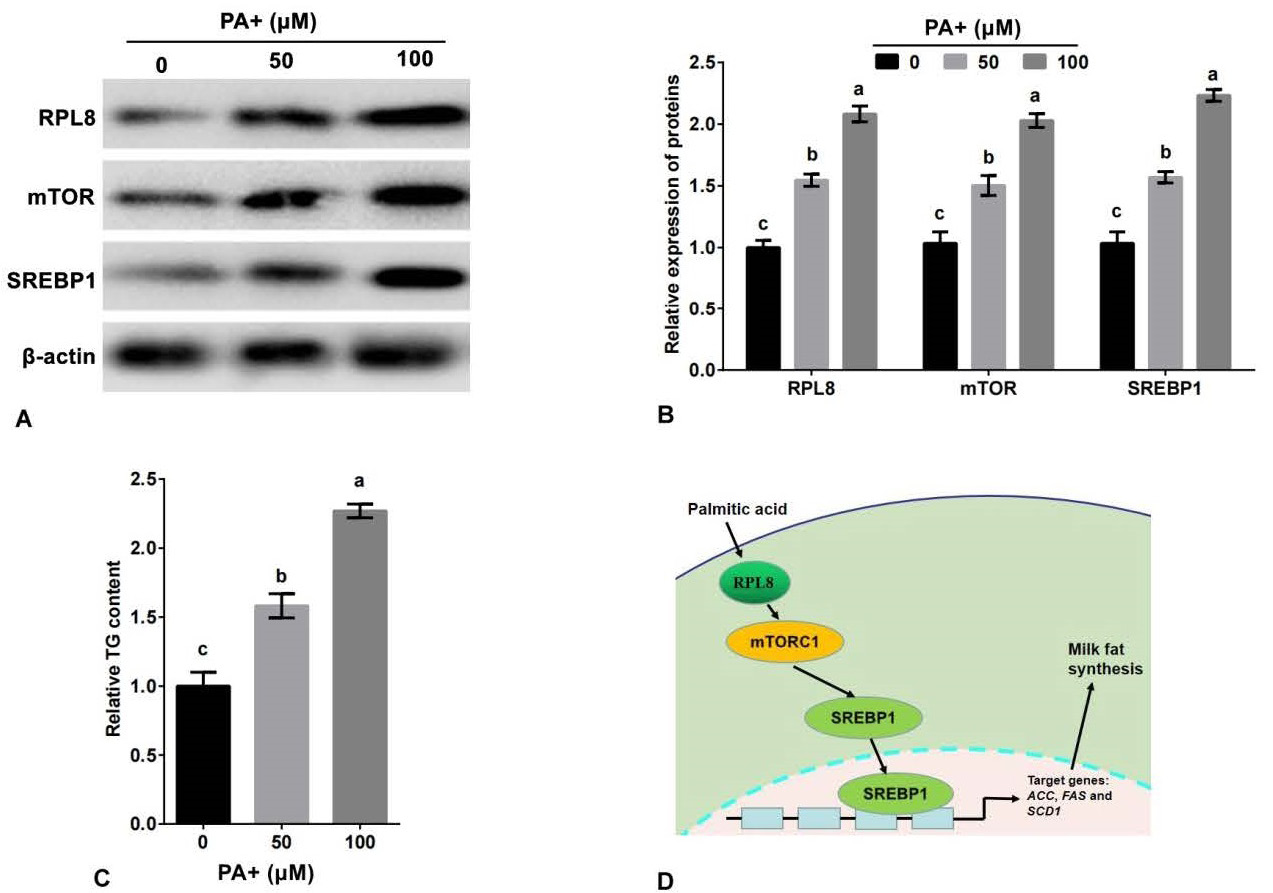
Palmitic acid promotes the expression of RPL8 and secretion of TG in YMECs. The expression of RPL8, mTOR, and SREBP1 in cells treated with 0, 50, and 100 μM of PA is shown in A-B, while C displays the secretion of TG in cells treated with the same concentrations of PA. D Shows a schematic model of how RPL8 promotes milk fat synthesis via the mTORC1-SREBP1 pathway in YMECs. In B, the expression of RPL8, mTOR, and SREBP1 in cells treated with 0 μM of PA was set to “1”. In C, the secretion of TG in cells treated with 0 μM of PA was set to “1”. PA refers to palmitic acid. The bar charts display superscript lowercase letters indicating significant differences (p<0.05) between different experimental groups, while identical letters indicate no significant difference (p>0.05).


