Trend Analysis of Climate Variables in Urban Microclimate of Peshawar District


Research Article
Trend Analysis of Climate Variables in Urban Microclimate of Peshawar District
Ali Nawaz*, Qazi Bilal Ahmed, Anwar Ali, Nowsherwan Zarif, Faizan Ahmad and Asim Karim
Pakistan Forest Institute Peshawar-25000, Pakistan.
Abstract | The study explores the temporal trends of climate variables in Peshawar’s micro-urban climate, focusing on maximum temperature, minimum temperature, relative humidity, and annual rainfall from 1985 to 2022. Data sourced from the PFI Meteorological Observatory reveals significant trends in these variables. The findings indicate an upward trajectory in both maximum and minimum temperatures, with rates of 0.6°C per decade for maximum temperature and 0.4°C per decade for minimum temperature. Conversely, relative humidity displays a declining trend of 2.83% per decade, while annual rainfall demonstrates a notable decrease of 63.2 mm per decade. These trends underscore the dynamic nature of climate variables and highlight the impact of human land use activities on accelerating climate change patterns. The study emphasizes the necessity of comprehending and monitoring climate trends in urban settings, particularly in light of climate change and urban development challenges. The observed trends in Peshawar’s micro-urban climate offer crucial insights for policymakers and urban planners to prioritize sustainable urban development measures. This research serves as a valuable indicator for informed decision-making processes aimed at mitigating the adverse effects of climate change and fostering resilient urban environments. By recognizing these trends and their implications, stakeholders can implement effective strategies to address climate-related challenges and promote sustainable urban development practices in Peshawar and similar contexts globally.
Received | March 12, 2024; Accepted | June 15, 2024; Published | June 25, 2024
*Correspondence | Ali Nawaz, Pakistan Forest Institute, Peshawar-25000, Pakistan; Email: alialinawaz1997@gmail.com
Citation | Nawaz, A., Q.B.`Ahmed, A. Ali, N. Zarif, F. Ahmad and A. Karim. 2024. Trend analysis of climate variables in urban microclimate of Peshawar District. Pakistan Journal of Forestry, 74(2): 9-17.
DOI | https://dx.doi.org/10.17582/journal.PJF/2024/74.1.9.17
Keywords | Temperature, Relative humidity, Rainfall, Urban planning, Climate trend, Climate trend
Copyright: 2024 by the authors. Licensee ResearchersLinks Ltd, England, UK.
This article is an open access article distributed under the terms and conditions of the Creative Commons Attribution (CC BY) license (https://creativecommons.org/licenses/by/4.0/).
Introduction
The major threat to ecosystems and people around the world is climate change [International Panel on Climate Change (IPCC, 2014)]. There has been a significant increase in the temperature from 0.95 to 1.2°C in the last decade while an increase in average surface temperature of 1.09°C was observed during the period 1850–2020. The intensity and frequency of heavy rainfall events have increased due to the changing climate (Bucchignani et al., 2017). There are more accidents of more frequent and intense droughts evident as well (Dai, 2011). From region to region, the impacts of climate change vary (Sharma and Goyal, 2020).
In the current era, natural phenomena as well as anthropogenic activities such as land use changes and greenhouse gas emissions from the combustion of fossil fuels are responsible for recorded fluctuations in precipitation, temperature, and relative humidity in the current era (Tabari et al., 2011). The urban areas expansion leads to unsustainable land use planning caused due to urban areas where vegetation is covered and replaced by commercial and residential areas and other infrastructure development which helps to increase the land surface temperature (LST) (Faqe and G, 2017).
The climate variables especially temperature and rainfall are directly linked with agriculture, flora, and socioeconomic conditions of the people (Ouhamdouch and Bahir, 2017). The hydrological cycle and environmental processes change with changes in precipitation and temperature (Feng et al., 2016). The hydrological cycle has been accelerated and intensified by global warming causing more violent storms, frequent floods, and droughts (Syed et al., 2010). Human activities, such as human health, exploitation, ecosystems, water energy, food security, and industrial and municipal water supplies are influenced by the intensified water cycle (Chu et al., 2010).
Due to the variability in temperature and precipitation, climate change has significant impact which attracted attention during the past few decades from researchers (Easterling et al., 1999). An increased number of warm days and nights and a significant decrease in the number of cool days and nights globally while in larger areas, there is increased precipitation than the areas with decreased precipitation as reported by International Panel on Climate Change (IPCC) (Masson et al., 2018).
Pakistan is the fifth most vulnerable country in the world in the current era of climate change disastrous impacts (Eckstein et al., 2019). The water reserves and agriculture of Pakistan have been impacted by variations in precipitation patterns (Jain et al., 2013). Being an agriculture-dependent country, Pakistan is under climate threat (Rasul et al., 2012). Mean Annual Temperature (MAT) ranged from 0.78 to 1.5°C observed during the last three decades, and there is an estimated temperature to be raised 2 to 4°C at the end of this century (Abbas et al., 2017).
Due to climate variable fluctuations, the century’s worst flood of July 2010 was experienced in the Khyber Pakhtunkhwa province of Pakistan (Rahman and Khan, 2013). About 2,000 people died and 700,000 houses were destroyed during the 2010 flood (Rahman et al., 2018). More than half of the people live in cities which growing at a phenomenal rate in size as this land use change of urbanization-driven affects the hydrometeorological processes of the locality which causes change in climate variables especially the precipitation (Pathirana et al., 2014).
The state of the climate of a region can be assessed by the key process of trend analysis of climate variables which provides an overview for estimate of trends in the climate variables. (Mahmood and Jia, 2017). Similarly, a good description of the variability of temperature and precipitation trends is considered a good description for hydrology, climatology, agriculture and many other related studies (Feng et al., 2016).
The purpose of the current study is to examine the temporal trends of climate variables, with a specific focus on maximum and minimum temperatures, relative humidity, and rainfall patterns in the urban district surrounding the Greater University campus in Peshawar. By analysing these variables over time, the study aims to gain insights into the changing climatic conditions in this urban area. This research can provide valuable information for understanding the local climate dynamics, assessing potential impacts on the environment and society, and informing adaptation and mitigation strategies to address climate change challenges in the region.
Materials and Methods
Study area
The University Campus Peshawar is located on the main Road leading toward Torkham Gate near the Afghanistan border. The Greater University Campus area comprise of University of Agriculture, University of Peshawar, Islamia College, Pakistan Forest Institute, University of Engineering and Technology and Khyber Medical College. The Campus covers an area of approximately 426 hectares (4 km2). The land use of the study area comprises built-up areas such as academic buildings 208 hectares and open spaces including sports grounds, lawns, gardens, and parks interspersed with plenty of green spaces and roads 81 hectares at an elevation of 1150 feet from mean above sea level. The climate has both the summer and winter weather conditions are extreme. The University Campus has significant tree diversity ranging from 10m to 20m in height at rotation age. Trees diversity belongs to a total of 13 tree species including 10 different families, of which Gymnosperm are 7.69% species while the remaining 92.30% belong to Angiosperms, which constitute 92.30% Dicots and 7.69% Monocots (Basit et al., 2021). Majority plants are planted for ornamental purposes, shade and aesthetic values along with educational sites and roads.
The Campus area forms microclimate due to dense tree cover which makes the temperature comparatively less to the surrounding of the city. Due to a large number of academic constructions and other residential buildings and projects, a change has occurred during the last decades. Pakistan Forest Institute has the densest tree cover as compared to universities on the campus while most of the Agriculture University area consists of cultivated lands.
Study Area lies in the tropical thorn forest, which comprise of phulai (Acacia modesta Linn.Wall.), Ber (Ziziphus mauritiana Lam.), Shisham (Dalbergia sissoo Roxb.) (Sheikh et al., 1993), Jand (Prosopis cineraria Linn.) Bakain (Melia azedarach Linn), Toot (Morus alba Linn.), and Black siris (Albizzia lebbek) (Khattak et al., 1965).
Data collection
Climatic data for this study including monthly mean, maximum and minimum temperature, humidity and total precipitation was obtained from Pakistan Forest Institute (PFI) meteorological Observatory station of Watershed Management Branch, Forestry Research Division, Pakistan Forest Institute, Peshawar. The 38-years compiled climate data (1985-2022) used to determine the seasonal and annual trend analysis.
Trend analysis
The long-term trend series in annual maximum temperature, annual minimum temperature, relative humidity and total annual rainfall was detected with the help of Mann–Kendall test and estimator of Sen’s slope. The climate data was graphically and statistically presented and summarized using Excel version 2019 and XLSTAT Software version 2023.
Mann-kendall test and Sen’s slope estimator– trend detection
The climate variables in meteorology and hydrology fields are is widely detected with help of non-parametric called Mann-Kendall test (Kendall, 1945; Nikolakopoulos et al., 2021).
Statistic S can be obtained by Equation (1).
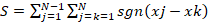 .........(1)
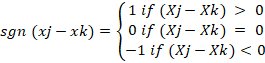 ....(2)
where n represent the length of the sample, 𝑥 and 𝑥 are from 𝑘=1, 2, …, n-1 and 𝑗= 𝑘+1, …, n. If n is greater than 8, then statistic S is approximately normally distributed.
The mean of S is 0 and the variance of S calculated as follows:
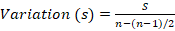 .........(3)
The test statistic Z can be represented by Equation 4:
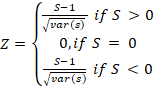 ..........(4)
The Z represents the magnitude of trends. When Z > 0, then there is an ascending trend and vice versa. Similarly, Z = 0 shows that there is no trend or change during given period. Given a confidence level α, the study hypothesized that there is a statistically significant trend in climate variables if |Z| > Z (1-α/2), where Z (1-α/2) is the corresponding value of P=α/2 following the standard normal distribution at given confidence interval.
The magnitude of a time series trend at 0.05 confidence level which was evaluated simply with the help of non-parametric test as developed by Sen.
The trend was assessed as follow:
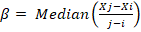
The 𝛽 gives Sen’s slope estimate. 𝛽 > 0 shows ascending trend in a time series, when 𝛽 < 0 then data series shows descending trend during the time period.
Table 1: Statistical summary of Mean Monthly Maximum Temperature (0C) for the University Campus Area over period of 1981-2021
|
Statistic |
January |
Feb-ruary |
March |
April |
May |
June |
July |
August |
Sep-tember |
Oct-ober |
No-vember |
De-cember |
|
No of observations |
38 |
38 |
38 |
38 |
38 |
38 |
38 |
38 |
38 |
38 |
38 |
38 |
|
Minimum |
14.8 |
14.2 |
13.2 |
25.6 |
24.6 |
23.1 |
25.4 |
30.4 |
24.8 |
27.5 |
17.1 |
13.2 |
|
Maximum |
23.3 |
30.7 |
35.2 |
38.9 |
47.9 |
47.2 |
76.5 |
39.3 |
55.8 |
37.0 |
31.6 |
31.4 |
|
Median |
17.7 |
20.0 |
24.4 |
30.1 |
35.2 |
38.7 |
36.9 |
35.2 |
34.6 |
31.0 |
24.8 |
20.9 |
|
Mean |
17.7 |
20.6 |
24.4 |
30.3 |
35.9 |
38.5 |
38.0 |
35.5 |
35.0 |
31.1 |
24.7 |
21.0 |
|
Standard deviation (n) |
1.8 |
2.7 |
3.7 |
3.0 |
4.3 |
3.6 |
6.9 |
2.4 |
4.1 |
1.8 |
2.8 |
3.3 |
|
Variation coefficient (n) |
0.1 |
0.1 |
0.2 |
0.1 |
0.1 |
0.1 |
0.2 |
0.1 |
0.1 |
0.1 |
0.1 |
0.2 |
|
Skewness (Pearson) |
1.0 |
0.9 |
0.3 |
0.9 |
0.7 |
-2.0 |
4.5 |
-0.5 |
3.1 |
0.6 |
-0.5 |
0.8 |
|
Kurtosis (Pearson) |
1.3 |
4.0 |
2.5 |
1.0 |
1.8 |
8.3 |
23.2 |
-0.5 |
16.3 |
1.7 |
1.6 |
2.0 |
|
Kendall's tau |
-0.11 |
0.08 |
0.17 |
0.30 |
0.21 |
0.23 |
0.27 |
0.35 |
0.28 |
0.21 |
-0.21 |
0.07 |
|
p-value |
0.32 |
0.48 |
0.14 |
0.01 |
0.06 |
0.04 |
0.02 |
0.00 |
0.01 |
0.07 |
0.07 |
0.53 |
|
Sen's slope |
-0.03 |
0.01 |
0.07 |
0.10 |
0.10 |
0.06 |
0.07 |
0.11 |
0.07 |
0.04 |
-0.06 |
0.02 |
Table 2: Statistical summary of Average Monthly Minimum Temperature (0C) for the University Campus Area over period of 1985-2022
|
Statistic |
January |
Feb-ruary |
March |
April |
May |
June |
July |
August |
Sep-tember |
Octo-ber |
No-vember |
De-cember |
|
No of observations |
38 |
38 |
38 |
38 |
38 |
38 |
38 |
38 |
38 |
38 |
38 |
38 |
|
Minimum |
0.1 |
2.7 |
7.1 |
10.0 |
8.3 |
8.8 |
13.4 |
4.9 |
20.2 |
12.4 |
0.0 |
0.0 |
|
Maximum |
7.4 |
10.8 |
46.4 |
21.8 |
30.2 |
40.0 |
33.3 |
33.7 |
31.7 |
27.2 |
22.2 |
24.6 |
|
Median |
3.5 |
5.7 |
10.8 |
14.6 |
19.7 |
22.9 |
25.9 |
25.3 |
22.2 |
15.0 |
8.7 |
4.6 |
|
Mean |
3.6 |
6.4 |
12.2 |
15.1 |
19.6 |
23.1 |
25.9 |
25.2 |
22.8 |
16.2 |
9.0 |
5.9 |
|
Standard deviation (n) |
1.9 |
2.2 |
6.8 |
2.0 |
3.9 |
5.3 |
2.7 |
3.9 |
2.2 |
3.7 |
3.1 |
5.0 |
|
Variation coefficient (n) |
0.5 |
0.3 |
0.6 |
0.1 |
0.2 |
0.2 |
0.1 |
0.2 |
0.1 |
0.2 |
0.3 |
0.8 |
|
Skewness (Pearson) |
0.4 |
0.3 |
3.8 |
0.9 |
0.2 |
0.6 |
-2.1 |
-3.4 |
2.2 |
1.6 |
1.5 |
2.1 |
|
Kurtosis (Pearson) |
-0.8 |
-1.0 |
15.6 |
2.7 |
1.7 |
3.0 |
11.1 |
17.1 |
5.8 |
2.1 |
8.5 |
4.6 |
|
Kendall's tau |
0.19 |
0.28 |
0.33 |
0.12 |
0.02 |
-0.05 |
0.40 |
0.22 |
0.12 |
0.19 |
0.23 |
0.05 |
|
p-value |
0.10 |
0.02 |
0.00 |
0.31 |
0.84 |
0.65 |
0.00 |
0.06 |
0.29 |
0.10 |
0.05 |
0.69 |
|
Sen's slope |
0.05 |
0.08 |
0.10 |
0.03 |
0.01 |
-0.01 |
0.07 |
0.03 |
0.02 |
0.06 |
0.06 |
0.02 |
Results and Discussion
There is statistically significant decreasing trend for average monthly maximum temperature for the months of January, February, March, June, July, October, November and December while the analysis further revealed that there are no significance trends in monthly maximum temperature for the months of April, June, July, August and September. Mann-Kendall statistic value varies between 0.00 in September to 0.53 in December as shown in (Table 1).
Statistic, Kendall’s tau and p-value were for annual maximum temperature, 168, 0.283 and 0.018 respectively at 95% confidence level. Negative value of Kendall’s tau and S statistics showed that there is increasing trend in temporal series of annual maximum temperature (A TMax) as given in the Table 5.
Minimum temperature (Tmin)
There is statistically significant warming trend in average monthly minimum temperature for the months of January, April, May, June, August, September, October, and December while the analysis further revealed that there are no significance trends in monthly minimum temperature for the months of February, March, April, July and November. Mann-Kendall statistic value varies between 0.00 in March and July to 0.84 in May as shown in (Table 2).
While S statistic, Kendall’s tau and p-value were for annual minimum temperature, 88, 0.148, 0.216 and 0.018 respectively at below 95% confidence level. Positive sign of Kendall’s tau and S statistics showed that there is warming trend in the series of annual minimum temperature (Tmin) as given in the Table 5.
There is statistically significant increasing trend analysis of average monthly relative humidity for the months of February, May, June, September, October, November and December while the analysis further revealed that there are no significant trends in monthly relative humidity for the months of March, April, July and August. Mann-Kendall statistic value varies between 0.00 in August to 0.99 in December as shown in (Table 3).
Kendall’s tau, S statistic and p-value were found -0.300, -178 and 0.012 for annual relative humidity (R.H) respectively at below 95% confidence level. S statistic and Kendall’s tau tests revealed that decreasing trend of relative humidity for the temporal over period of (1985-2022) (Table 5).
Total annual rainfall (A R.F)
There is statistically significant decreasing trend analysis of average monthly maximum temperature for all the months while the there are no increasing significant trends in any month as shown in (Table 4).
Table 3: Statistical summary of Mean Monthly Relative Humidity (0C) for the University Campus Area over period of 1985-2022
|
Statistic |
January |
Feb-ruary |
March |
April |
May |
June |
July |
August |
Sep-tember |
Octo-ber |
No-vember |
De-cember |
|
No of observations |
38.0 |
38.0 |
38.0 |
38.0 |
38.0 |
38.0 |
38.0 |
38.0 |
38.0 |
38.0 |
38.0 |
38.0 |
|
Minimum |
0.0 |
33.0 |
2.5 |
0.6 |
9.7 |
0.0 |
41.5 |
25.3 |
34.6 |
6.6 |
14.7 |
0.0 |
|
Maximum |
87.6 |
90.3 |
91.6 |
97.9 |
86.8 |
81.4 |
93.8 |
89.2 |
90.8 |
82.6 |
81.5 |
90.6 |
|
Median |
73.7 |
68.5 |
64.9 |
62.4 |
47.6 |
53.0 |
68.2 |
74.2 |
70.0 |
66.4 |
68.4 |
69.8 |
|
Mean |
71.9 |
67.1 |
63.7 |
63.3 |
48.0 |
52.5 |
66.9 |
73.0 |
69.0 |
64.7 |
65.1 |
66.4 |
|
Standard deviation (n) |
14.7 |
12.8 |
15.9 |
20.1 |
16.7 |
16.9 |
10.2 |
11.7 |
11.5 |
14.1 |
15.1 |
19.8 |
|
Variation coefficient (n) |
0.2 |
0.2 |
0.2 |
0.3 |
0.3 |
0.3 |
0.2 |
0.2 |
0.2 |
0.2 |
0.2 |
0.3 |
|
Skewness (Pearson) |
-3.2 |
-0.9 |
-1.6 |
-0.5 |
-0.1 |
-0.5 |
-0.1 |
-2.0 |
-0.8 |
-2.2 |
-1.5 |
-1.8 |
|
Kurtosis (Pearson) |
13.1 |
0.7 |
4.2 |
1.0 |
0.2 |
1.0 |
0.4 |
6.0 |
2.1 |
6.3 |
2.1 |
3.2 |
|
Kendall's tau |
-0.10 |
0.06 |
-0.23 |
-0.27 |
-0.04 |
0.01 |
-0.19 |
-0.35 |
-0.09 |
-0.15 |
0.05 |
0.00 |
|
p-value |
0.40 |
0.61 |
0.05 |
0.02 |
0.71 |
0.95 |
0.10 |
0.00 |
0.44 |
0.20 |
0.68 |
0.99 |
|
Sen's slope |
-0.12 |
0.08 |
-0.34 |
-0.63 |
-0.05 |
0.01 |
-0.19 |
-0.37 |
-0.11 |
-0.15 |
0.04 |
0.01 |
Table 4: Statistical summary of Mean Monthly Rainfall (mm) for the University Campus Area over period of 1985-2022
|
Statistic |
January |
Feb-ruary |
March |
April |
May |
June |
July |
August |
Sep-tember |
Octo-ber |
No-vember |
De-cember |
|
No of observations |
38 |
38 |
38 |
38 |
38 |
38 |
38 |
38 |
38 |
38 |
38 |
38 |
|
Minimum |
0.0 |
0.0 |
0.0 |
0.0 |
0.0 |
0.0 |
0.0 |
0.0 |
0.0 |
0.0 |
0.0 |
0.0 |
|
Maximum |
170.0 |
444.0 |
491.0 |
168.5 |
130.0 |
110.5 |
660.0 |
730.0 |
211.0 |
518.9 |
79.0 |
181.2 |
|
Median |
25.2 |
32.3 |
54.7 |
21.8 |
14.0 |
10.5 |
27.0 |
34.5 |
12.0 |
6.1 |
2.2 |
5.0 |
|
Mean |
43.9 |
66.3 |
83.7 |
35.1 |
24.4 |
17.7 |
59.9 |
75.1 |
23.5 |
36.5 |
11.3 |
23.1 |
|
Standard deviation (n) |
51.7 |
102.2 |
115.2 |
37.3 |
26.9 |
24.3 |
123.1 |
152.6 |
36.6 |
90.7 |
18.5 |
36.3 |
|
Variation coefficient (n) |
1.2 |
1.5 |
1.4 |
1.1 |
1.1 |
1.4 |
2.1 |
2.0 |
1.6 |
2.5 |
1.6 |
1.6 |
|
Skewness (Pearson) |
1.5 |
2.9 |
2.5 |
1.7 |
2.2 |
2.4 |
3.7 |
3.5 |
3.7 |
4.2 |
2.4 |
2.6 |
|
Kurtosis (Pearson) |
0.8 |
7.8 |
6.1 |
2.9 |
5.2 |
6.0 |
13.9 |
11.1 |
15.8 |
19.0 |
5.6 |
7.9 |
|
Kendall's tau |
0.04 |
-0.07 |
-0.10 |
-0.15 |
-0.13 |
-0.09 |
-0.10 |
0.05 |
-0.20 |
-0.05 |
0.03 |
-0.17 |
|
p-value |
0.74 |
0.52 |
0.41 |
0.20 |
0.24 |
0.46 |
0.41 |
0.69 |
0.08 |
0.67 |
0.83 |
0.15 |
|
Sen's slope |
0.09 |
-0.25 |
-0.51 |
-0.33 |
-0.22 |
0.00 |
-0.20 |
0.08 |
-0.32 |
0.00 |
0.00 |
-0.08 |
Kendall’s tau, S statistic and p-value for annual rainfall were -0.267, -159 and 0.025 respectively at 95% confidence level. The negative value of Kendall’s tau and S statistics showed decline in the temporal series data of annual rainfall (A R. F) as given in the Table 5.
During the observed period of 1985-2022 the mean annual maximum temperature range was between 17.24°C and 38.52°C with an average value of 29.25°C. The mean annual minimum temperature range was 3.34°C and 25.91°C with an average value of 15.43°C. While mean temperature for the whole period was recorded as 22.34°C. The highest maximum temperature and minimum temperature were recorded in the month of June and July respectively as shown in Figure 6.
Table 5: Mann-Kendall’s Statistic for climatic Variables
|
Climatic Variable |
Kendall's tau |
S statistic |
p- value |
Confidence level (95%) |
Test Results |
|
|
0.283 |
168 |
0.018 |
0.95 |
Increasing |
||
|
A MiT |
0.148 |
88 |
0.216 |
0.95 |
Increasing |
|
|
A R.H |
-0.300 |
-178 |
0.012 |
0.95 |
Decreasing |
|
|
A R. F |
-0.267 |
-159 |
0.025 |
0.95 |
Decreasing |
Table 6: Summary of test statistics of Sen’s slope estimator at 95% confidence level
|
S. No |
Climatic Variable |
Confidence Interval (%) |
Sen’ S Slope |
Intercept |
|
A MxT |
95 |
0.063 |
-97.504 |
|
|
2 |
A MiT |
95 |
0.043 |
-70.841 |
|
A R.H |
95 |
0.286 |
637.429 |
|
|
4 |
A R. F |
95 |
-6.322 |
12930.588 |
Table 7: Statistics summary of Sen’s slope estimator at 95% confidence level
|
S. No |
Climatic Variables |
Year |
Maximum |
Minimum |
Mean |
Standard Deviation |
|
A MxT |
1885-2022 |
23.67 |
33.89 |
29.45 |
1.98 |
|
|
2 |
A MiT |
1885-2022 |
11.70 |
22.43 |
15.46 |
2.13 |
|
3 |
A R.H |
1885-2022 |
5.32 |
77 |
62.48 |
12.89 |
|
4 |
A R. F |
1885-2022 |
58 |
785.7 |
307.67 |
189.18 |
A MxT= Annual Maximum Temperature (0C); A MiT= Annual Minimum Temperature (0C); A R.H= Annual Relative Humidity (%); T A R. F= Total Annual rainfall (mm).
The results of the Mann Kendall test were used for trends in annual and monthly maximum temperature, minimum temperature, relative humidity and total rainfall over a period of 1985–2022 at University Campus in urban district. The University Campus provide a microclimate for the whole urban population due to dense cover of vegetation. A non-parametric Mann Kendal test and Sen’s slope was applied to detect the trend in climate variables. The results revealed that there is a non-significant increasing trend in annual maximum temperature and minimum temperature were recorded while non-significant decrease in relative humidity and total annual rainfall.
The maximum temperature has a discernible trend of fluctuation in some months, as seen in Table 1. Except for the months of January and November, climate variables showing increasing trend. There is a significant increase for the month of March, April, May, June, July, August and September at the 0.05 level of significance. For the months of February, October and there is a non-significant maximum temperature increase at the 0.05 confidence level. The Sen’ slope shows an increase in the maximum temperature of 0.6°C/decade
For the month of June, it shows a decreasing tendency in minimum temperature, however, for all other months, it shows an increasing trend. There is a substantial rise in the minimum temperature of 0.4°C/decade at the 0.05 level of significance. In our study, warming trend in the annual maximum and minimum temperature were of 0.6 and 0.4°C/decade. The results of this study matched with results obtained (Latrech et al., 2023) revealed same significant warming trend in annual Tmax, of 0.065 and 0.045°C/year for the period 1982-2020 in meteorological station of Nabeul, Cap-Bon region of Tanzania. This warming trend in the annual Tmax and Tmin occurs due to the increased landuse changes into urbanization and industrialization in the Urban district of Peshawar. Same results reported by (Panda and Sahu, 2019) in Kalahandi, Bolangir and Koraput districts of Odisha, India. Similarly, (Latrech et al., 2023) reported −37.5 mm/decade which is slightly decreased as compared to our study i.e., 63.22 mm /decade.
The Total monthly rainfall shows different trend of fluctuation during observed period. Precipitation shows decreasing trend for the months of February, March, April, May, July, September and December. There is a significant increase in the month of January, June, August, October and November at the 0.05 level of confident. The Sen’ slope shows decrease in the total annual rainfall of 63.22 mm /decade. Similarly results reported by (Chandniha et al., 2017) declining slope of precipitation 65.49 mm/decade trend line for the period of 1901–1949 in the 5 out of 18 stations Jharkhand, an eastern state of India.
Conclusion and Recommendations
The research was conducted in a semi-arid region of Pakistan, known for its annual fluctuations in climate variables. This investigation focused on four primary climate metrics: annual maximum and minimum temperatures, relative humidity, and rainfall. For the period, 1985 to 2022, both maximum and minimum temperatures exhibited a rising trend on the time series plots, whereas relative humidity and rainfall demonstrated declining trends. Utilizing the Mann-Kendall (MK) test and the Sen slope estimator, significant patterns of change were identified in these climatic parameters. Specifically, the maximum and minimum temperatures have been increasing by 0.6°C per decade, respectively. Conversely, relative humidity and rainfall are on a downward trajectory, decreasing by 2.83% and 63.2 mm per decade, respectively. Given these findings, and considering the data was sourced from the PFI Meteorological Observatory located within this distinct microclimate, it is imperative to advocate for additional research across various urban districts nationwide. This would help deepen the understanding of urban climatic trends and assist in crafting sustainable urban land use strategies.
Novelty Statement
This research article will be used for climate trend and flood prevention in Peshawar valley.
Author’s Contribution
Ali Nawaz: Wrote the manuscript.
Qazi Bilal Ahmed: Wrote the manuscript and reviewed.
Nowsherwan Zarif: Investigation.
Anwar Ali: Conceptualization.
Faizan Ahmed: Edited and corrected the draft.
Asim Karim: Visualization.
Conflict of interest
The authors have declared no conflict of interest.
References
Abbas. G., S. Ahmad, A. Ahmad, W. Nasim, Z. Fatima, S. Hussain, H.H. Rehman, M.A. Khan, M. Hasanuzzaman, and S. Fahad. 2017. Quantification the impacts of climate change and crop management on phenology of maize-based cropping system in Punjab, Pakistan. gric. For. Meteorol., 247: 42–55. https://doi.org/10.1016/j.agrformet.2017.07.012
Basit. A., S. Shah and S. Khan. 2016. Morphological features of various selected tree species on the greater university campus Peshawar, Pakistan. https://doi.org/10.22271/botany/2019
Bucchignani. E., A.L. Zollo, L. Cattaneo, M. Montesarchio, and P. Mercogliano. 2017. Extreme weather events over China: Assessment of COSMO-CLM simulations and future scenarios. Int. J. Climatol., 37: 1578–1594. https://doi.org/10.1002/joc.4798
Chandniha, S. K., S.G. Meshram, J.F. Adamowski, and C. Meshram. 2017. Trend analysis of precipitation in Jharkhand State, India: investigating precipitation variability in Jharkhand State. Theoretical Appl. Climatol., (130): 261-274.
Chu. J., J. Xia, C.Y. Xu, and V. Singh. 2010. Statistical downscaling of daily mean temperature, pan evaporation and precipitation for climate change scenarios in Haihe River https://doi.org/10.1007/s00704-009-0129-6, China. Theor. Appl. Climatol., 99:149–161.
Dai. A. 2011. Drought under global warming: A Review Wiley Interdisciplinary. Rev. Clim. Change, 2: 45–65. https://doi.org/10.1002/wcc.81
Easterling. D.R., J.L. Evans, P.Y. Groisman, T.R. Karl, K.E. Kunkel and P. Ambenje. 2000. Observed variability and trends in extreme climate events: A brief review. Bull. Am. Meteorol. Sociol., 81: 417- 426. https://doi.org/10.1175/1520-0477(2000)081<0417:OVATIE>2.3.CO;2
Easterling, D.R., H.F. Diaz, A.V. Douglas, W.D. Hogg, K.E. Kunkel, J.C. Rogers and J.F. Wilkinson. 1999. Long-term observations for monitoring extremes in the Americas. Climatic Change. 42(1): 285-308.
Eckstein. D., V. Künzel, L. Schäfer and M. Winges 2019. Global Climate Risk Index 2020. Who Suffers Most from Extreme Weather Events? German watch, Bonn, Germany.,
Faqe, I.G.R. 2017. Urban land use land cover changes and their effect on land surface temperature: Case study using Dohuk City in the Kurdistan Region of Iraq. Climate., 5(1), 13. https://doi.org/10.3390/cli5010013
Feng. G. 2016. Trend analysis and forecast of precipitation, reference evapotranspiration, and rainfall deficit in the Blackland Prairie of Eastern Mississippi. J. Appl. Meteorol. Clim., 55: 1425–1439. https://doi.org/10.1175/JAMC-D-15-0265.1
Intergovernmental Panel on Climate Change (IPCC), Climate Change. 2014. Synthesis Report. Contribution of Working Groups I, II and III to the Fifth Assessment Report of the Intergovernmental Panel on Climate Change (IPCC, Geneva, Switzerland., 2014).
Jain. S.K. V. Kumar, and M. Saharia, M. 2013. Analysis of rainfall and temperature trends in northeast India. Int. J. Climatol., 33: 968–97 https://doi.org/10.1002/joc.3483 8.
Jain. S.K and K.M. Saharia. 2022. Meteorological Trend Analysis in Chandaka Wildlife Sanctuary, Odisha, India using Statistical Techniques. Int. J. Zool. Invest. 08: (special issue), 179–190. https://doi.org/10.33745/ijzi.2022.v08i0s.023
Kendall, M. G. 1945. The treatment of ties in ranking problems. Biometrika, 33: (3), 239–245. https://doi.org/10.2307/2332303
Kendall, M. G. and J. Dickinson Gibbons 1990. Rank correlation methods. Oxford University Press,
Khattak, G.M., S.H. G. Champion, and S.K. Seth. 1965. Manual of Silviculture for Pakistan. Pakistan Forest Institute, Peshawar.
Latrech. B., S. Yacoubi, T. Hermassi, A. Slatni, F. Jarray, and L. Pouget. 2023. Homogeneity and Trend Analysis of Climatic Variables in Cap-Bon Region of Tunisia. Appl. Sci., 13: 10593. https://doi.org/ 10.3390/app13191059. https://doi.org/10.3390/app131910593
Mahmood. R. and S. Jia. 2017. Spatial and temporal hydro-climatic trends in the transboundary Jhelum River basin. J. Water and Clim. Change, 8: 423–440. https://doi.org/10.2166/wcc.2017.005
Mann. H. B. 1945. Nonparametric tests against trend. Econometrica, 13(3): 245–259. https://doi.org/10.2307/1907187
Masson- Delmotte. V., P.Zhai, H.O.Pörtner, D.Roberts, J.Skea, P.R. Shukla, and T. Waterfield. 2018. Global warming of 1.5 C. An IPCC Special Report on the impacts of global warming.
Nikolakopoulos. S., E. Cator, and M.P. Janssen. 2021a. Extending the Mann-Kendall test to allow for measurement uncertainty. https://doi.org/10.1080/02331888.2023.2214942
Ouhamdouch S., and M. Bahir. 2017. Climate change impact on future rainfall and temperature in semi-arid areas (Essaouira Basin, Morocco). Environ. Processes., 4: 975-990. https://doi.org/10.1007/s40710-017-0265-4
Panda. A. and N. Sahu. 2016. Trend analysis of seasonal rainfall and temperature pattern in Kalahandi, Bolangir and Koraput districts of Odishawiley onlinelibrary.com/journal/asl2. DOI: 10.1002/asl.932. https://doi.org/10.1002/asl.932
Pathirana. A., H.B. Denekew, W. Veerbeek, C. Zevenbergen, and A.T. Banda. 2014. Impact of urban growth-driven landuse change on microclimate and extreme precipitation- A sensitivity study. Atmos. Res., 138, 59-72. https://doi.org/10.1016/j.atmosres.2013.10.005
Rahman. A. and A.N. Khan 2013. Analysis of 2010-flood causes, nature and magnitude in the Khyber Pakhtunkhwa, Pakistan. Nat. Hazards, 66 (2): 887–904.Rahman. G., A. Rahman, S. Ullah and M. Dawood. 2018. Spatial and temporal variation of rainfall and drought in Khyber Pakhtunkhwa Province of Pakistan during 1971–2015. Arabian J. Geosci., 11 (3): 1–13. https://doi.org/10.1007/s12517-018-3396-7
Rahman, G., Samiullah, and M. Dawood. 2018. Spatial and temporal variation of rainfall and drought in Khyber Pakhtunkhwa Province of Pakistan during 1971–2015. Arabian J. Geosci., (11): 1-13.
Rasul. G., A. Mahmood, A. Sadiq, S.I. Khan. 2012. Vulnerability of the Indus delta to climate change in Pakistan. Pak. J. Meteorol., 8: 89–107.
Sharma., A. and M.K. Goyal. 2020. Assessment of the changes in precipitation and temperature in Teesta River basin in Indian Himalayan Region under climate change. Atmospheric Research. (231):104670
Sheikh, M.I. 1993. Trees of Pakistan. Pakistan Forest Institute, Peshawar.
Syed. T. H., J.S. Famiglietti, D.P. Chambers, J.K. Willis and K. Hilburn. 2010. Satellite-based global-ocean mass balance estimates of interannual variability and emerging trends in continental freshwater discharge. Proc. Nat. Acad. Sci., 107: 17916-17921. https://doi.org/10.1073/pnas.1003292107
Tabari. H., B.S. Somee and M.R. Zadeh. 2011.Testing for long-term trends in climatic variables in Iran. Atmos. Res., 100: 132–140. https://doi.org/10.1016/j.atmosres.2011.01.005
Wang. X., and L. Liu. 2023. The Impacts of Climate Change on the Hydrological Cycle and Water Resource Management. Water, 15(13): 234. https://doi.org/10.3390/w15132342
To share on other social networks, click on any share button. What are these?