

Transcriptome Analysis Reveals the Immune Response of Chicken Erythrocytes to Marek’s Disease Virus Infection


Transcriptome Analysis Reveals the Immune Response of Chicken Erythrocytes to Marek’s Disease Virus Infection
Guan-bao Ning1, Sheng Niu1, Yue-jian Li1,2, Xiao-xiao Lu1,3, Shi-xiong Yang1, Ali-Raza Jahejo1, Ding Zhang1, Wei-fang Hao4, Wen-wei Gao1, Yu-jun Zhao1, Jian-hui Li1, Fang Yan1, Rong-kun Gao1, Yu-hai Bi1,5, Wen-xia Tian1* and Ling-xia Han6*
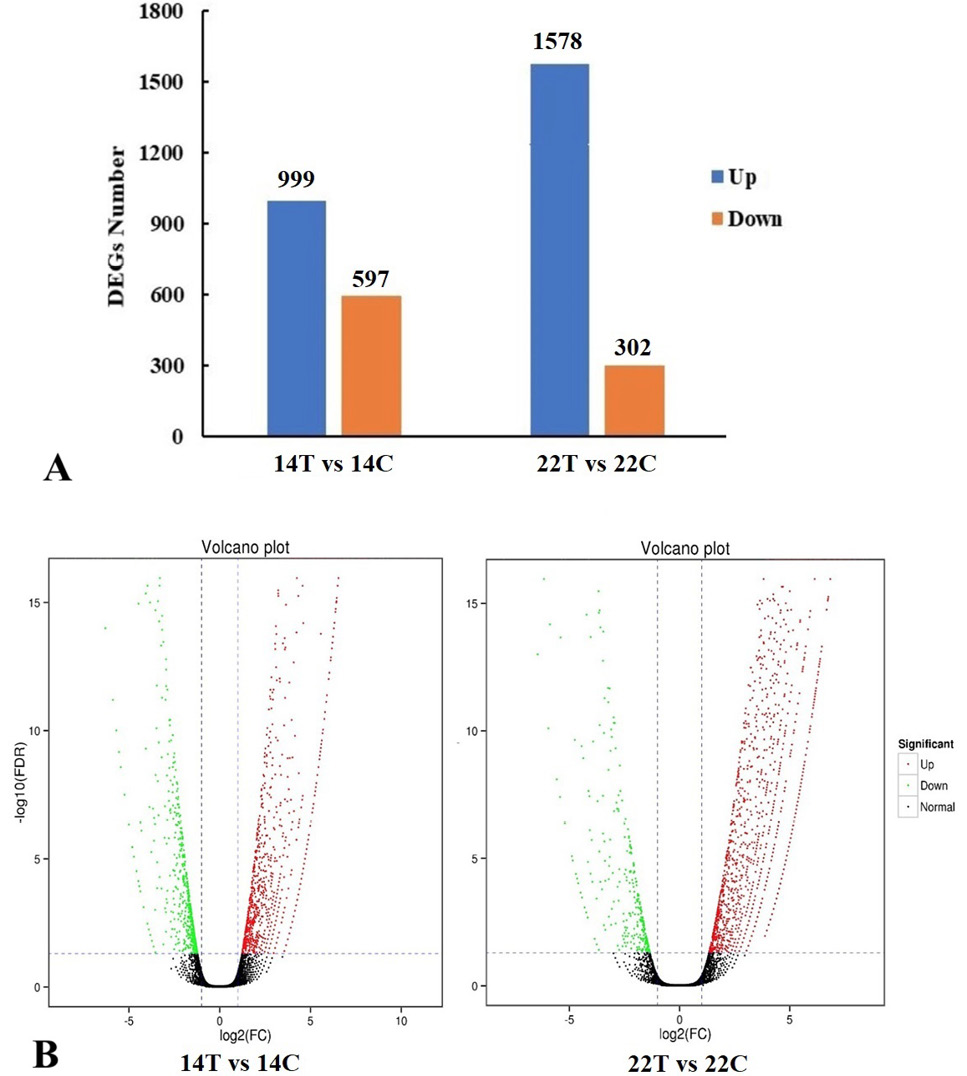
(A) Numbers of up-regulated and down-regulated DEGs between different cDNA libraries. Blue color represents up-regulated expression of DEGs; Brown color represents down-regulated expression of DEGs. (B) Volcano plot between different cDNA libraries. The log 2 fold represents the mean expression level. Red dots represent up-regulated genes, black dots represent no significant DEGs, the green dots represent down-regulated genes. 14T/14C, the DEGs were generated from the treatment group relative to the control group at 14 dpi; 22T/22C, the DEGs of treatment group relative to the control group at 22 dpi.
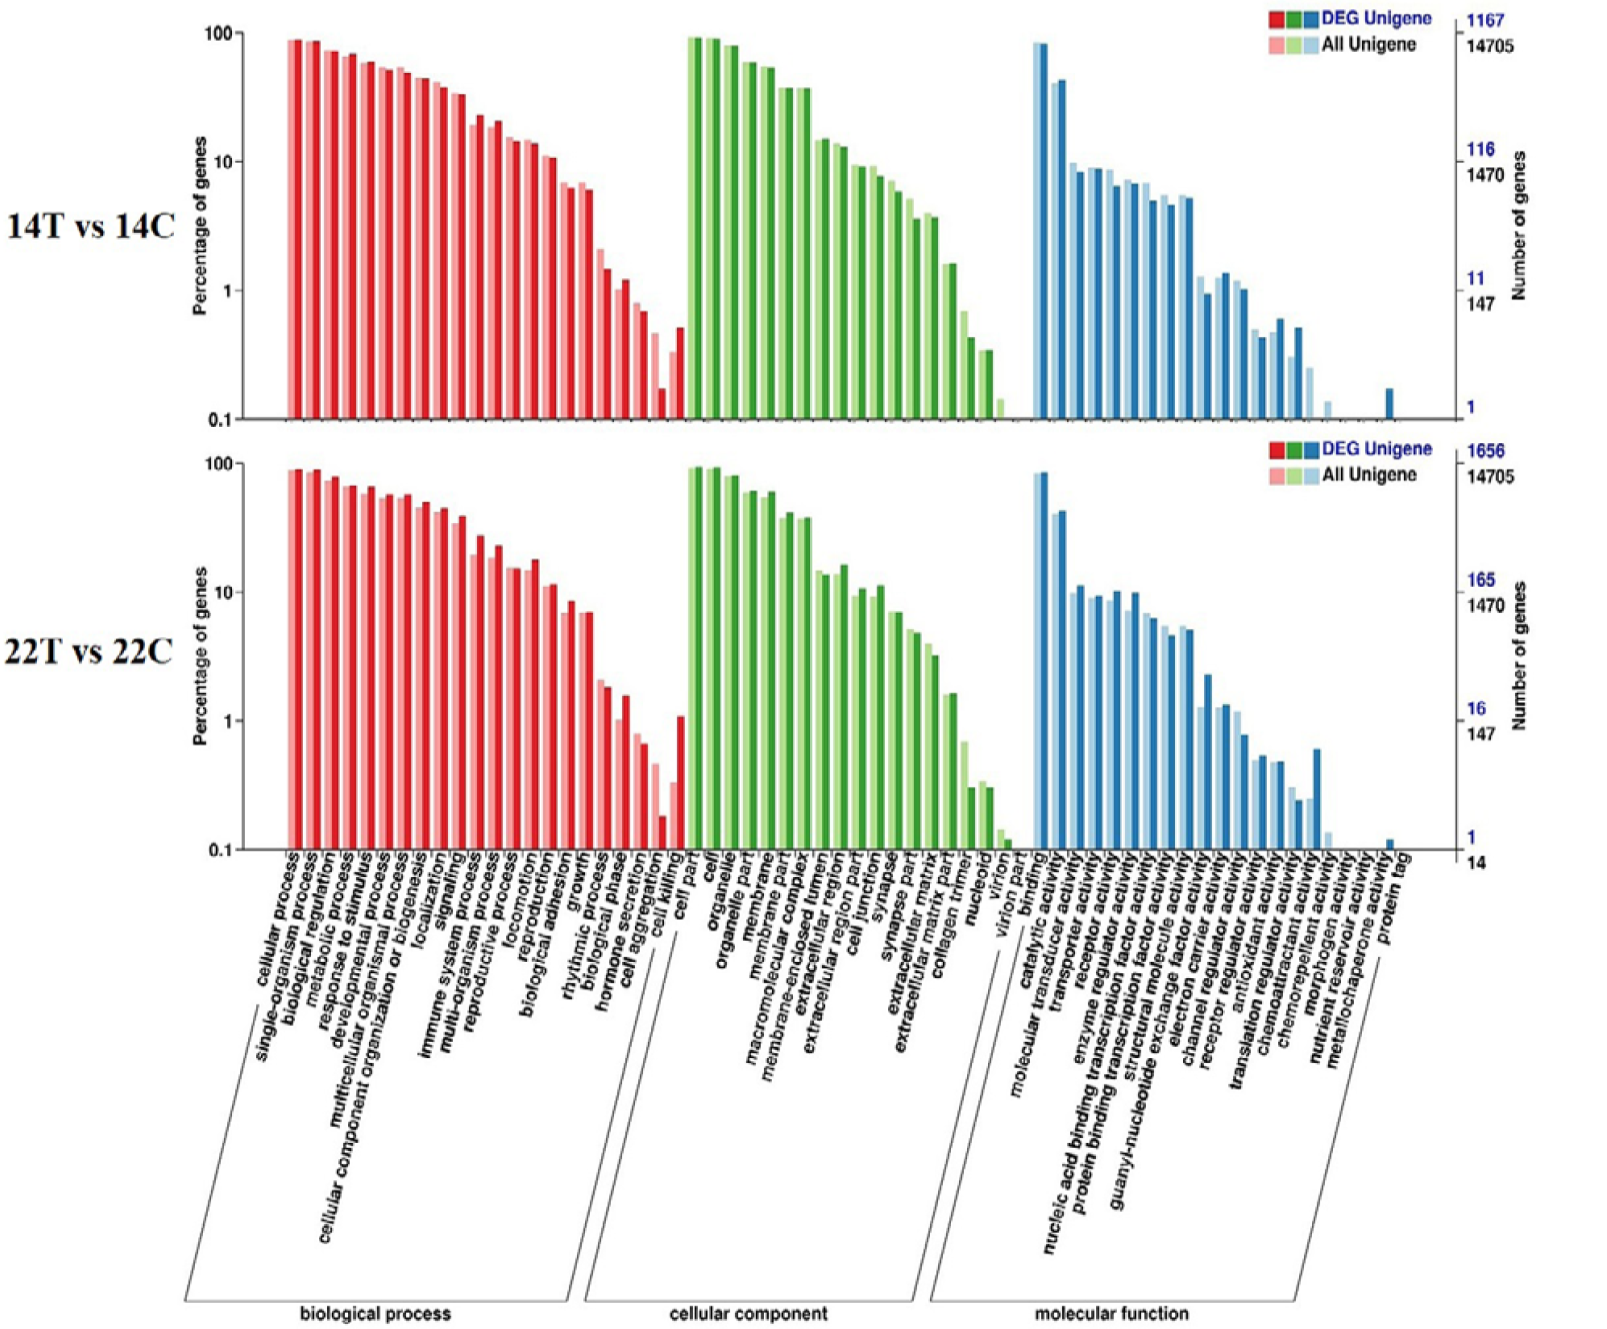
Gene ontology (GO) categorization of the differentially expressed unigenes (DEG unigenes) in the comparisons (14T/14C and 22T/22C).
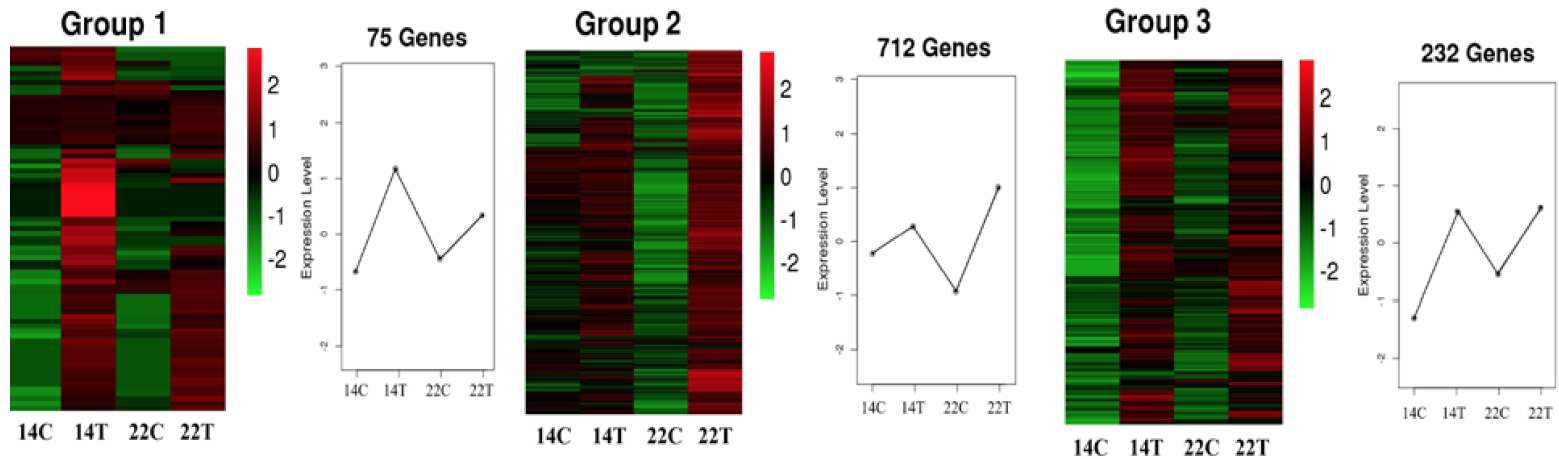
The heat map of DEGs in three immune-related clusters. X-axis indicated different samples, and the y-axis indicated the gene expression level. Color key ranging from -2 to 2 represents log2 (FPKM+1), indicating low (green) to high (red) expression.

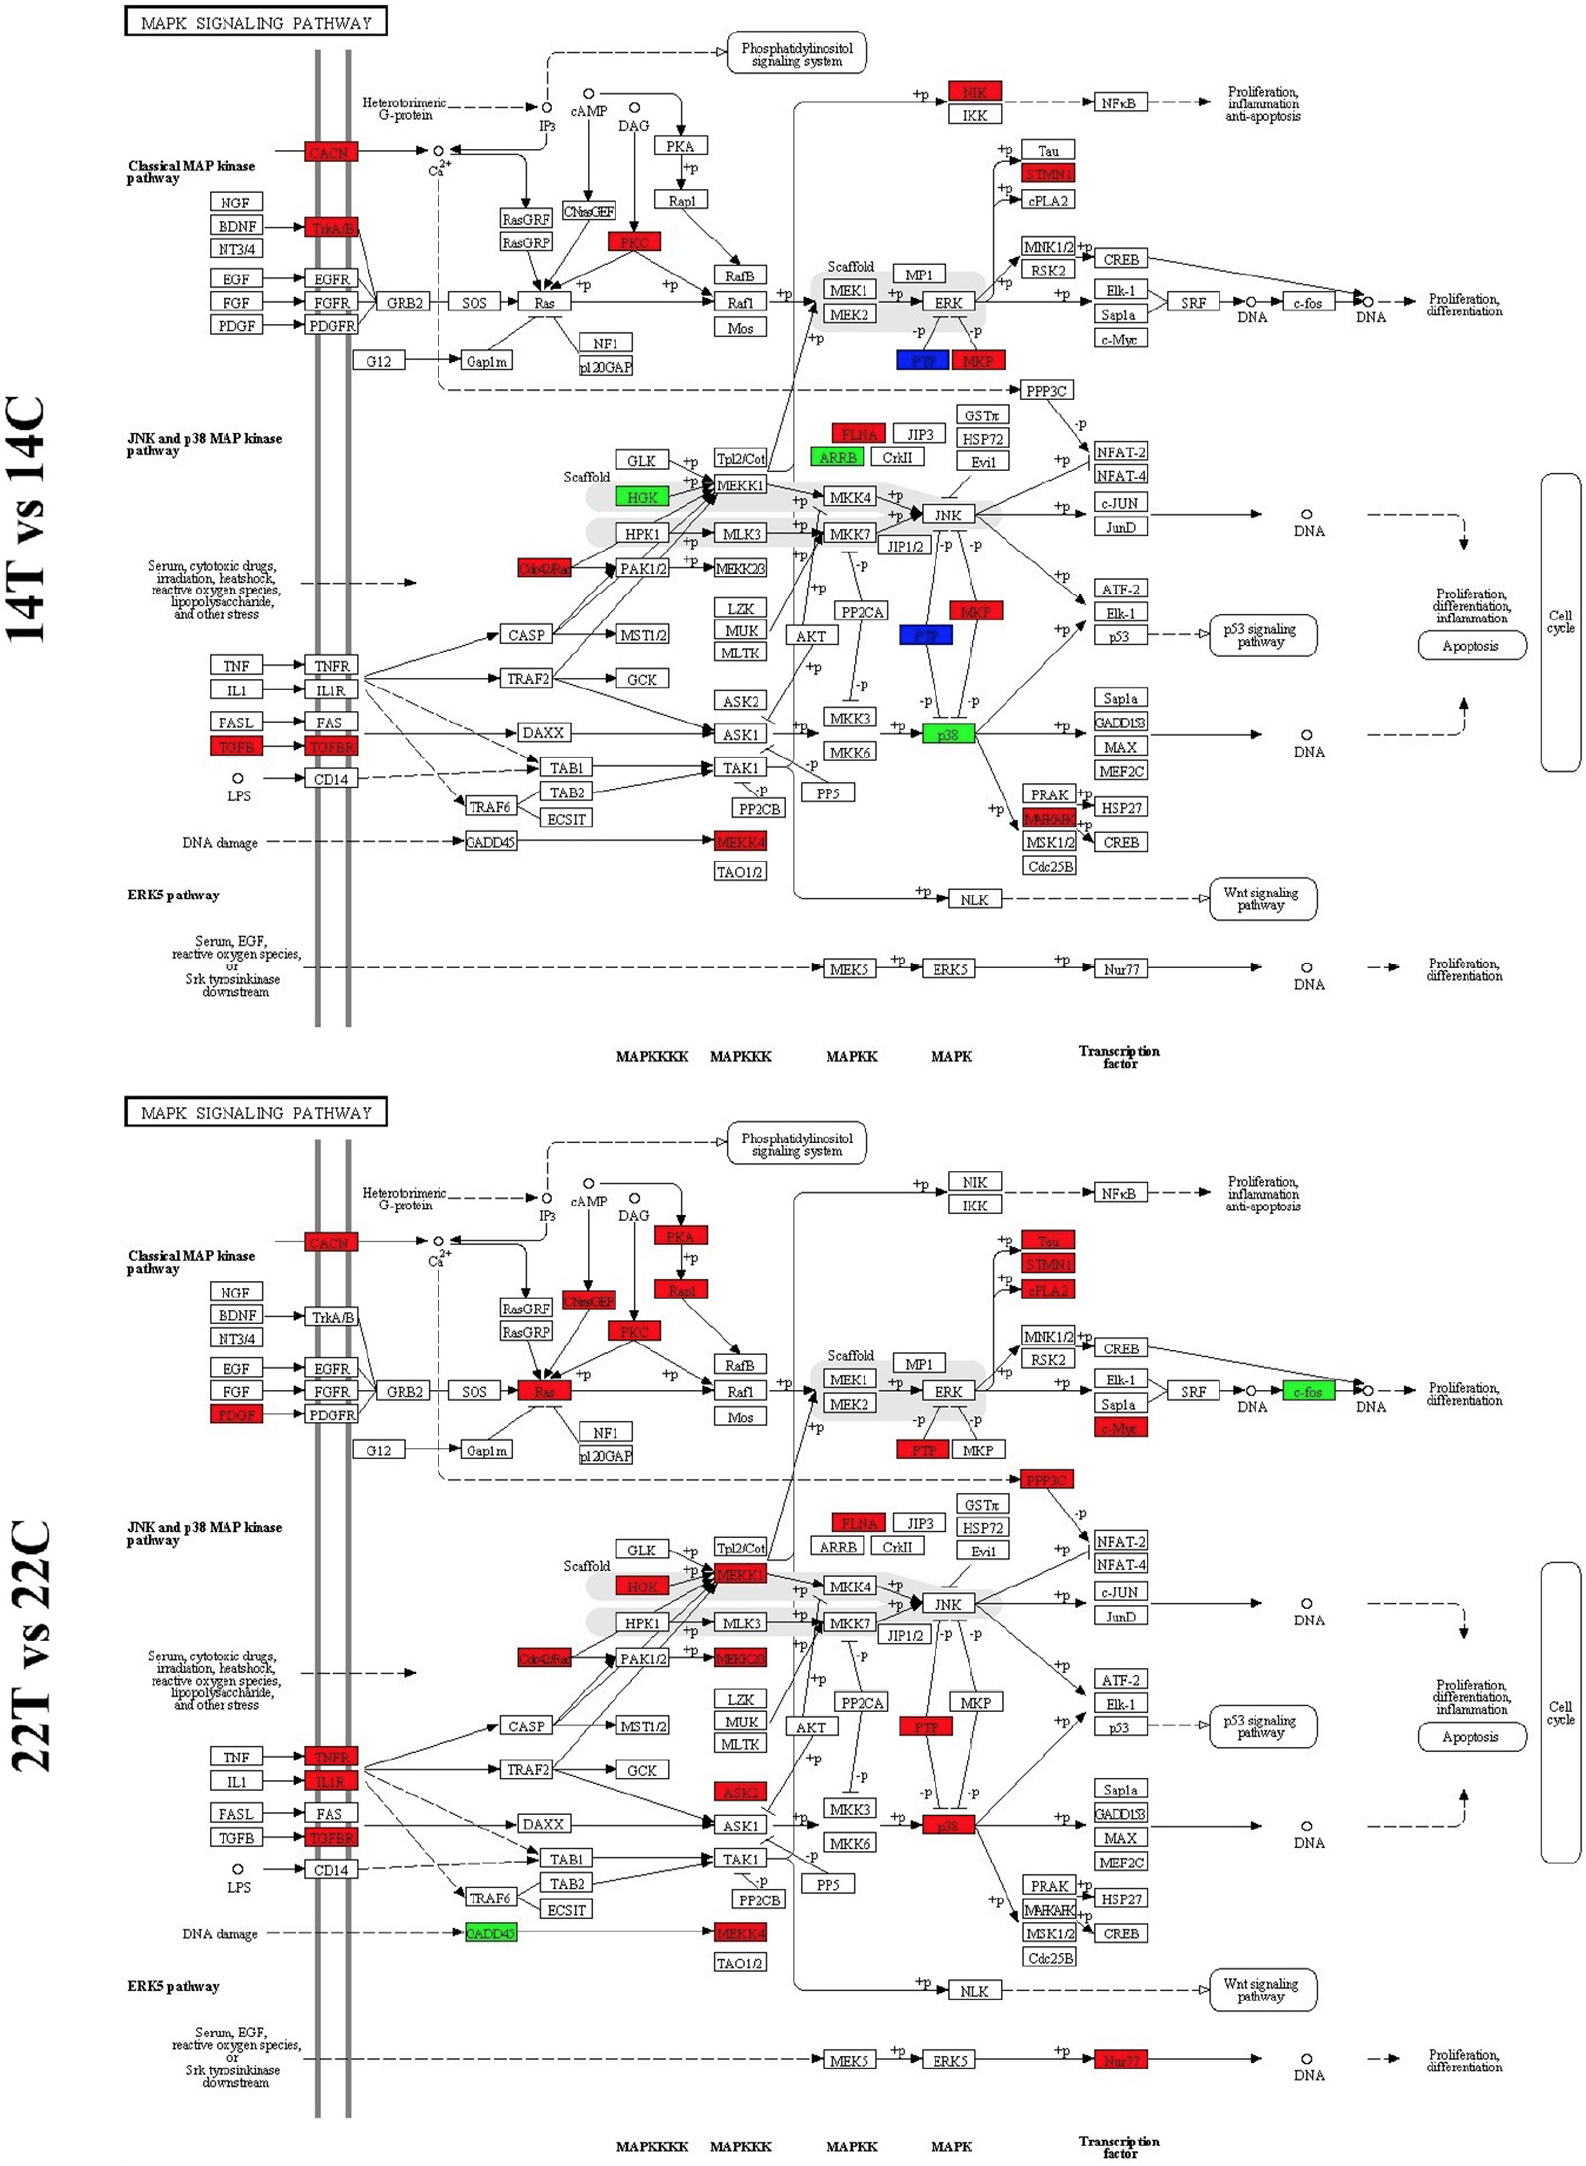
Schematic diagrams of cytokine-cytokine receptor interaction. Genes marked in red indicate up-regulated expression in the treatment group relative to the control group, genes marked in green indicate down-regulated expression, genes marked in blue indicate both of upregulated and downregulated expression.
Schematic diagrams of the toll-like receptor signaling pathway.
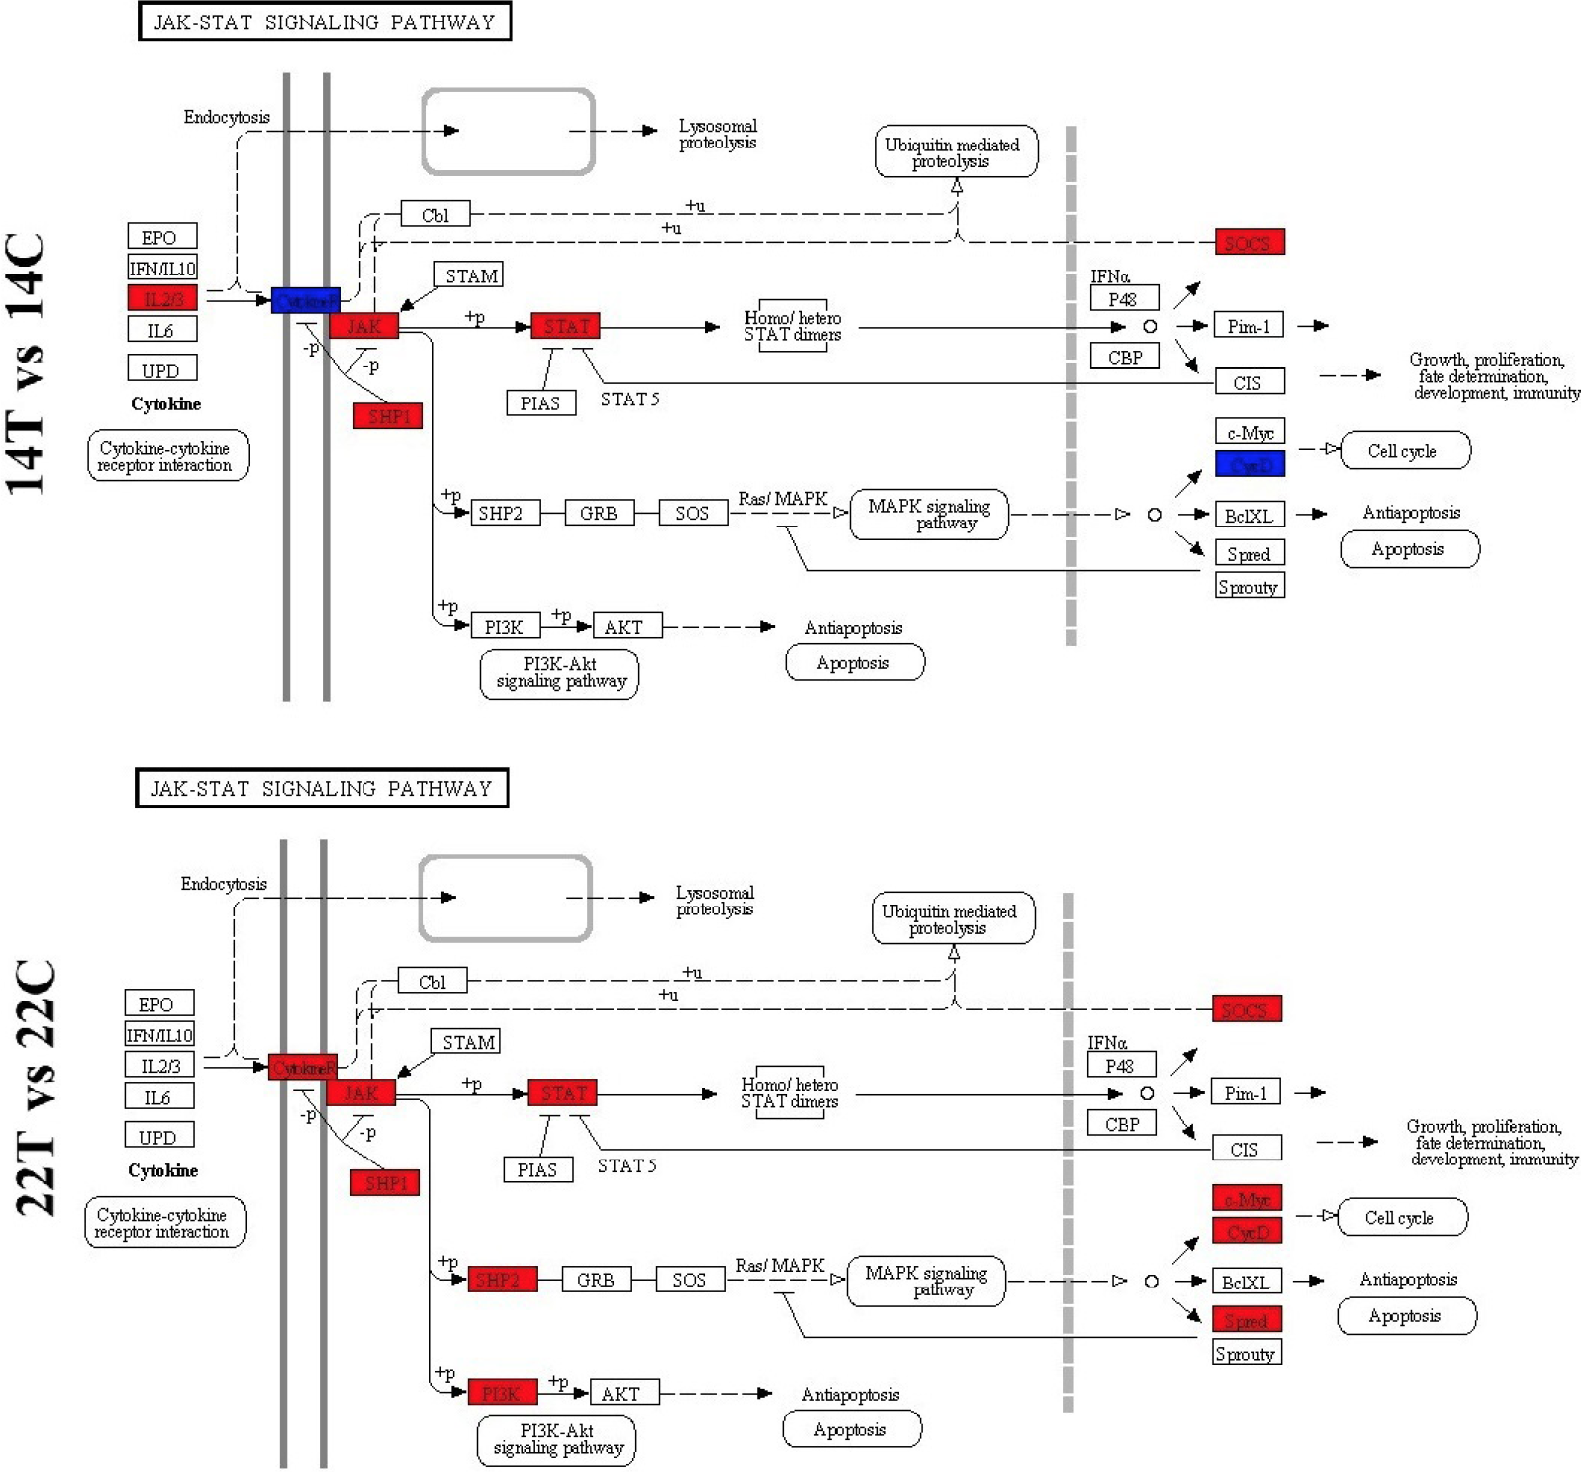
Schematic diagrams of the JAK-STAT signaling pathway.


