

Transcriptome Analysis in the Fat Body of Two Silkworm (Bombyx mori) Strains with Different Susceptibility to Fenvalerate


Transcriptome Analysis in the Fat Body of Two Silkworm (Bombyx mori) Strains with Different Susceptibility to Fenvalerate
Guo-dong Zhao1,2*, He-ying Qian1,2, Yi-ling Zhang1,2, Gang Li1, 2, Jian Tang1, 2 and An-ying Xu1,2*
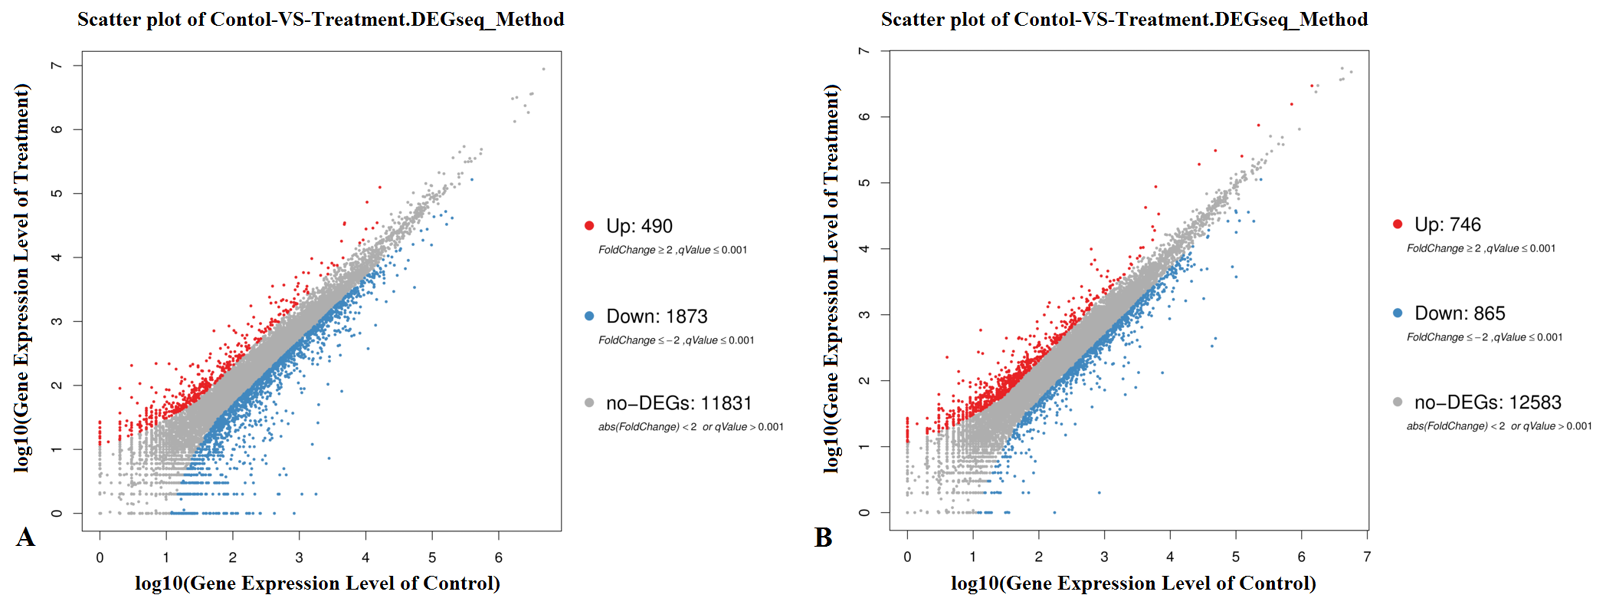
Scatter plot of differentially expressed genes. (A) Lan5; (B) Mysore. X and Y axis represents log10 transformed gene expression level, red color represents the up-regulated genes, blue color represents the down-regulated genes, gray color represents the non-DEGs.

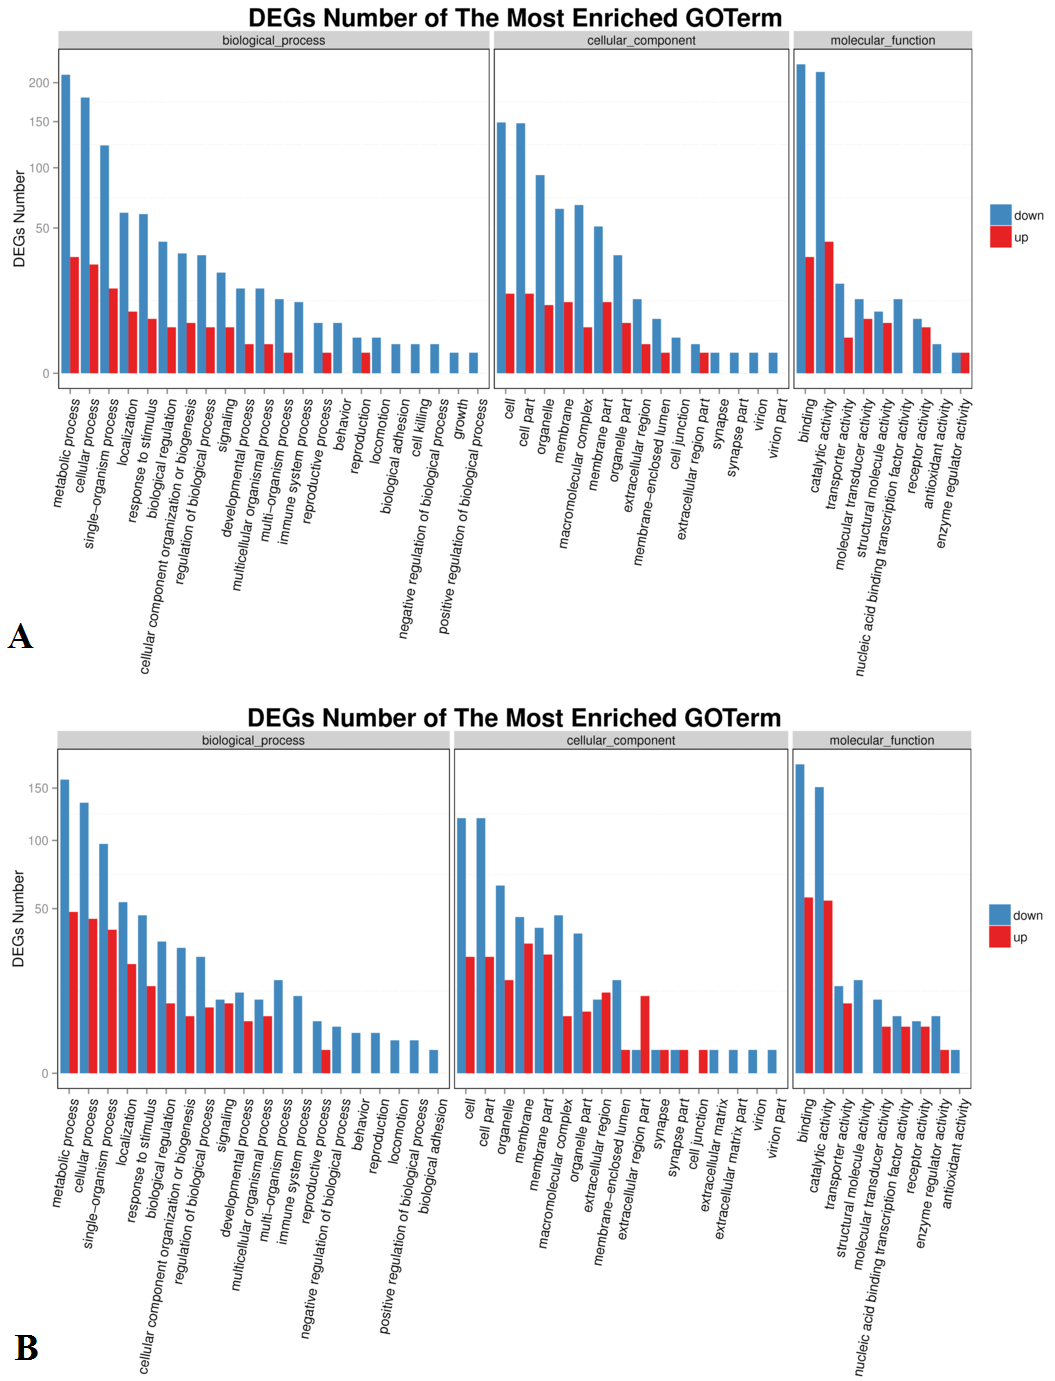
GO classification of up-regulated and down-regulated genes. (A) Lan5; (B) Mysore. X axis represents GO term. Y axis represents the amount of up/down-regulated genes in a category.
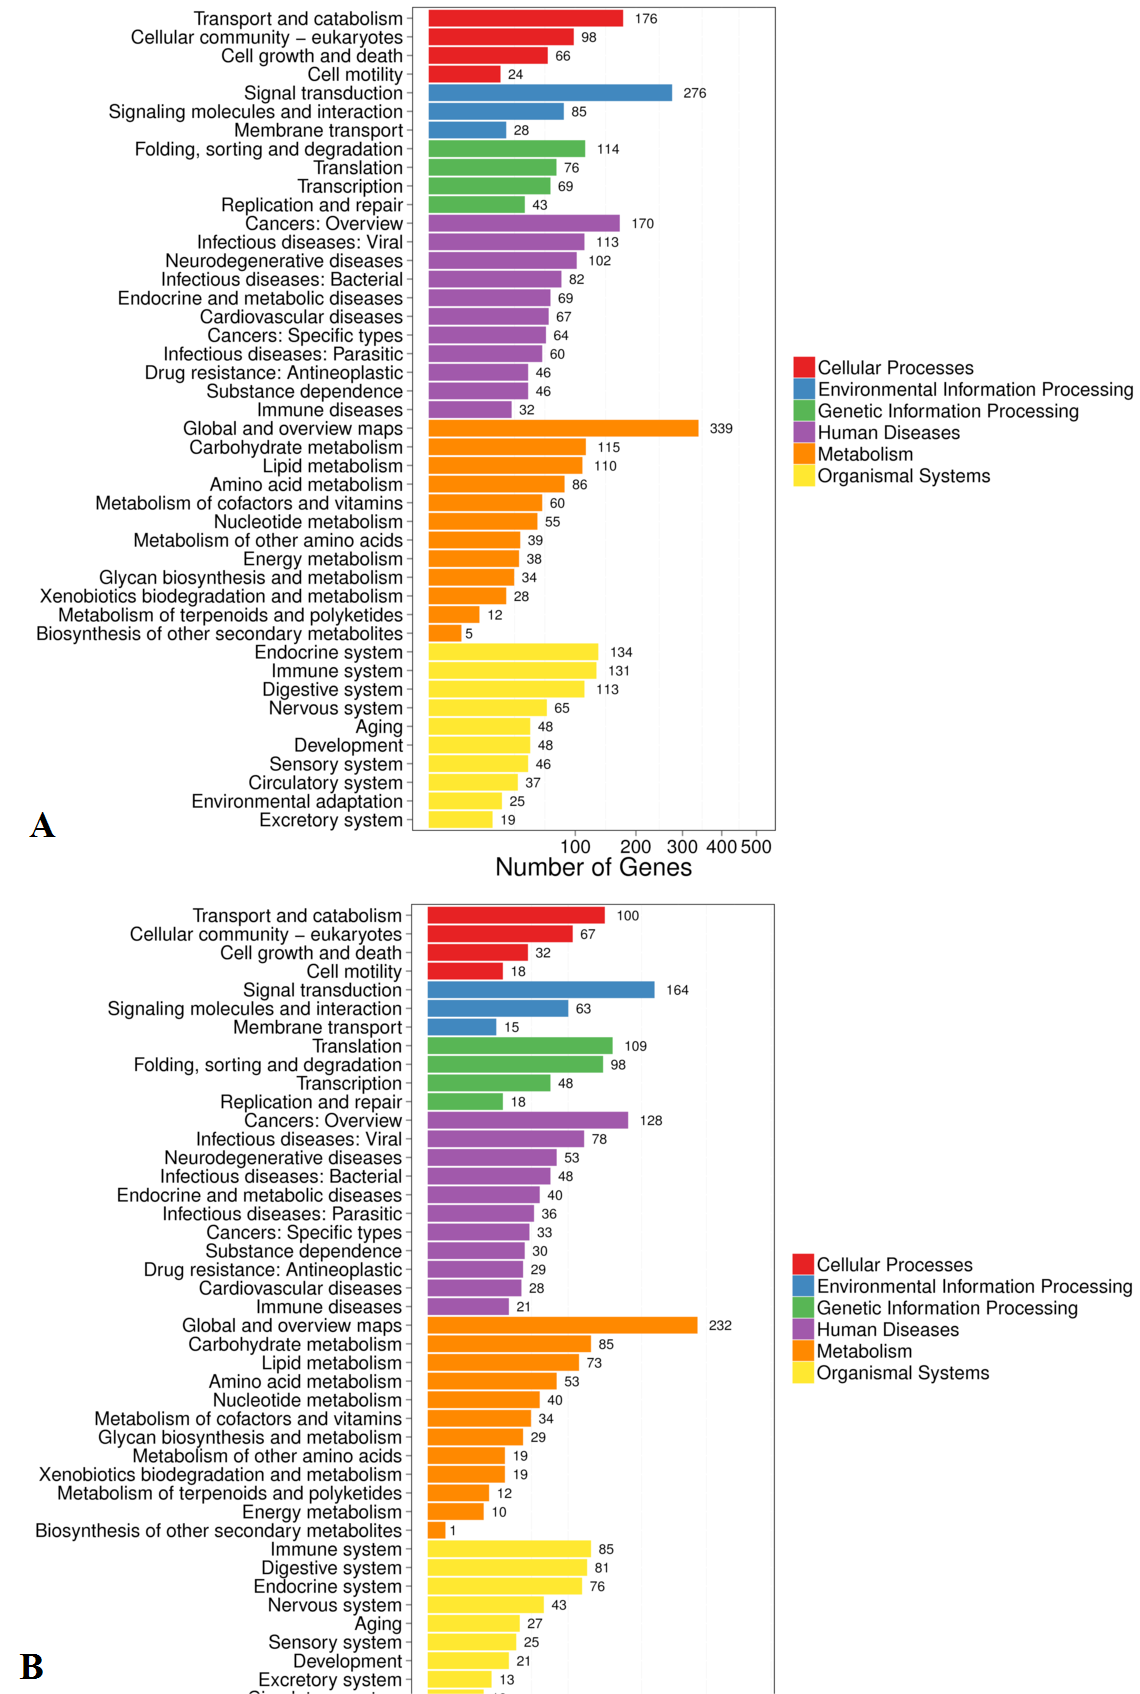
Pathway classification of DEGs. (A) Lan5; (B) Mysore. X axis represents number of DEG. Y axis represents functional classification of KEGG. There are six branches for KEGG pathways: cellular processes, environmental information processing, genetic information processing, human disease (for animals only), metabolism and organismal systems.
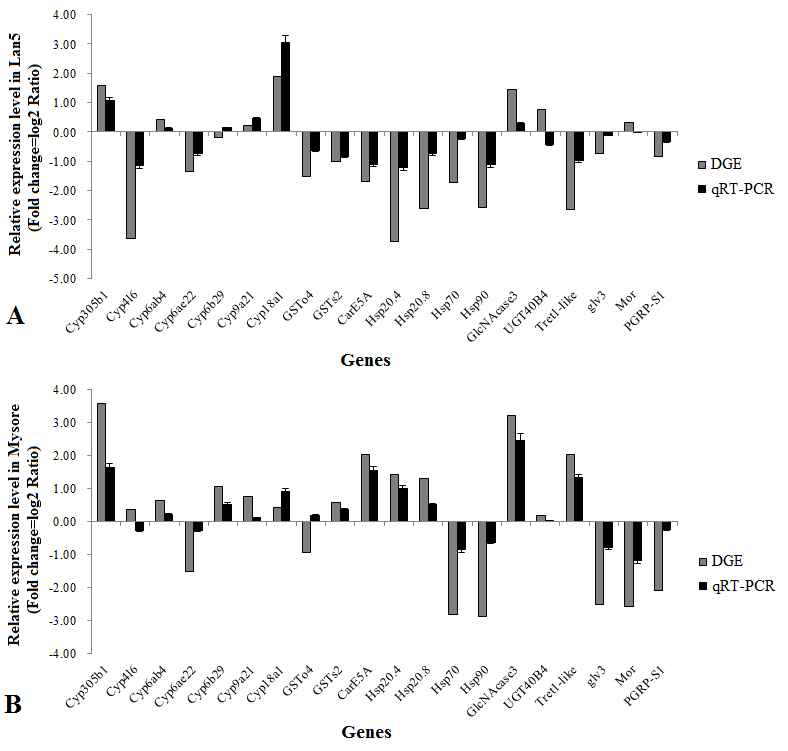
Verification of transcriptomics results of DEGs by qPCR. (A) Lan5; (B) Mysore. The y-axis indicates the relative expression level of gene mRNA transcripts (fold change=log2 ratio). The x-axis indicates the selected genes. Vertical bars represent the mean±SE (n=3).


