

The Screening and Diagnostic Value of Posterior Lung Field Angles on Abnormal Pulmonary Function


The Screening and Diagnostic Value of Posterior Lung Field Angles on Abnormal Pulmonary Function
Zhimin Wu1,2, Yaping Yang1, Arshad Zahoor1, Aftab Shaukat1 and Ganzhen Deng1,2*

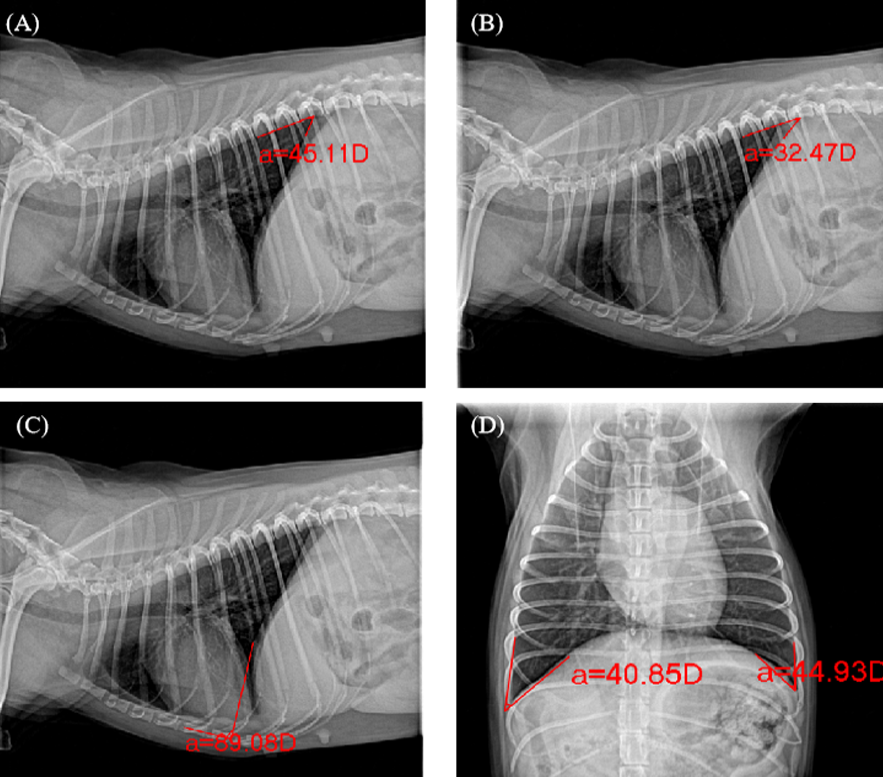
Imaging of PLFA. A, VAcr on the right lateral view. B, VAca on the right lateral view. C, SA on the right lateral view. D, CAl and CAr on the ventral-dorsal view.
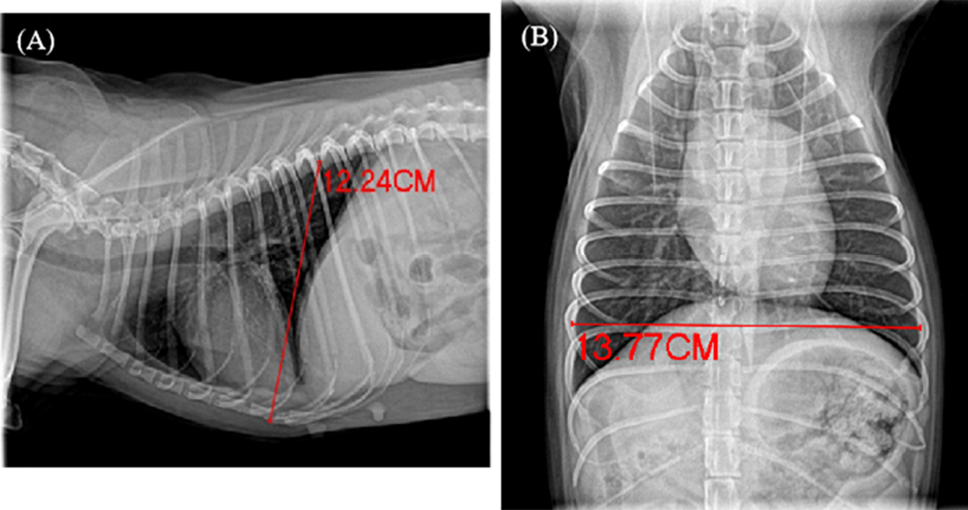
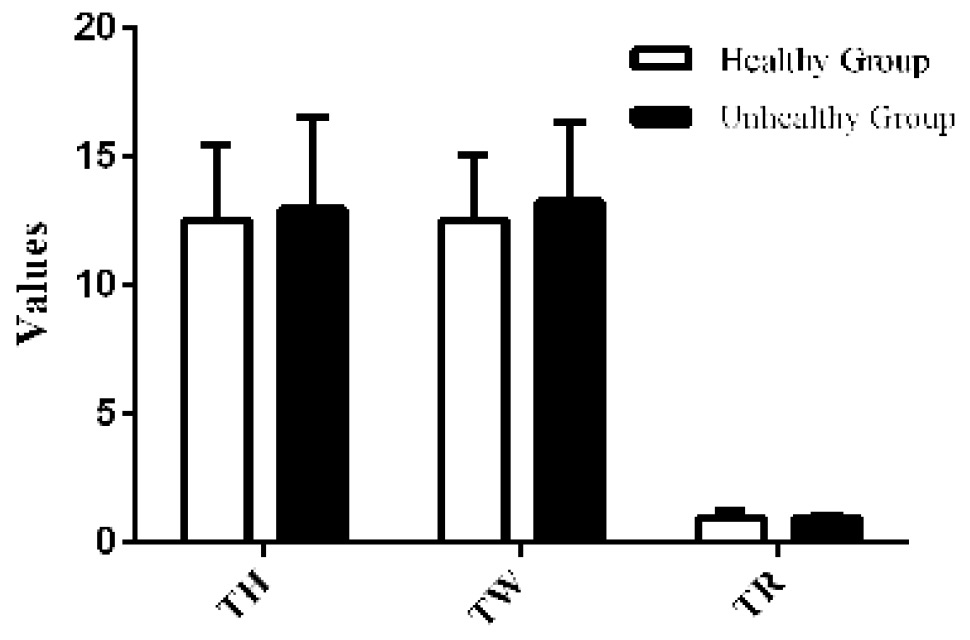
Imaging of thoracic height and width. A, TH on the right lateral view. B, TW on the ventral dorsal view.
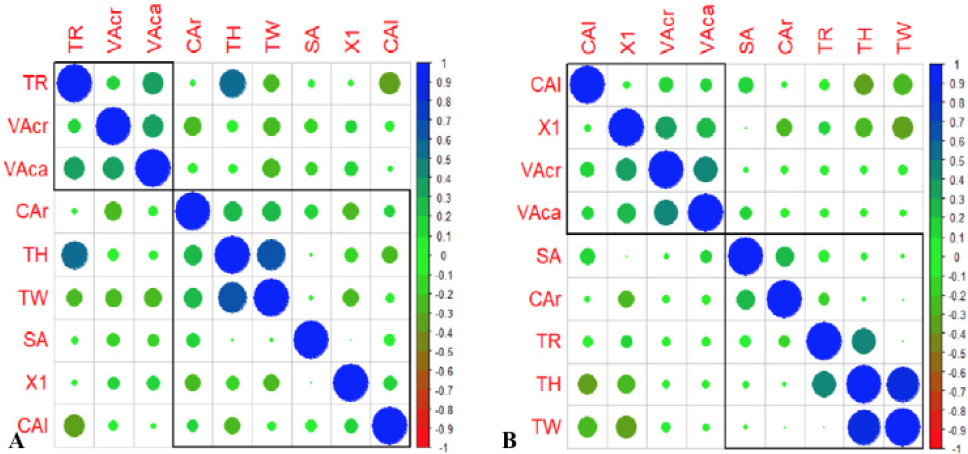
A, Correlation analysis matrix of PLFA with thoracic indexes in healthy group. B, Correlation analysis matrix of PLFA with thoracic indexes in unhealthy group. Correlation is represented by circles of different colors and sizes, in which blue indicates positive correlation, red indicates negative correlation and green indicates low or no correlation. The darker the color is, the larger the circle is indicating higher correlation. The correlation between the PLFA and the thoracic indexes showed low or no correlation in healthy group as well as the unhealthy group.
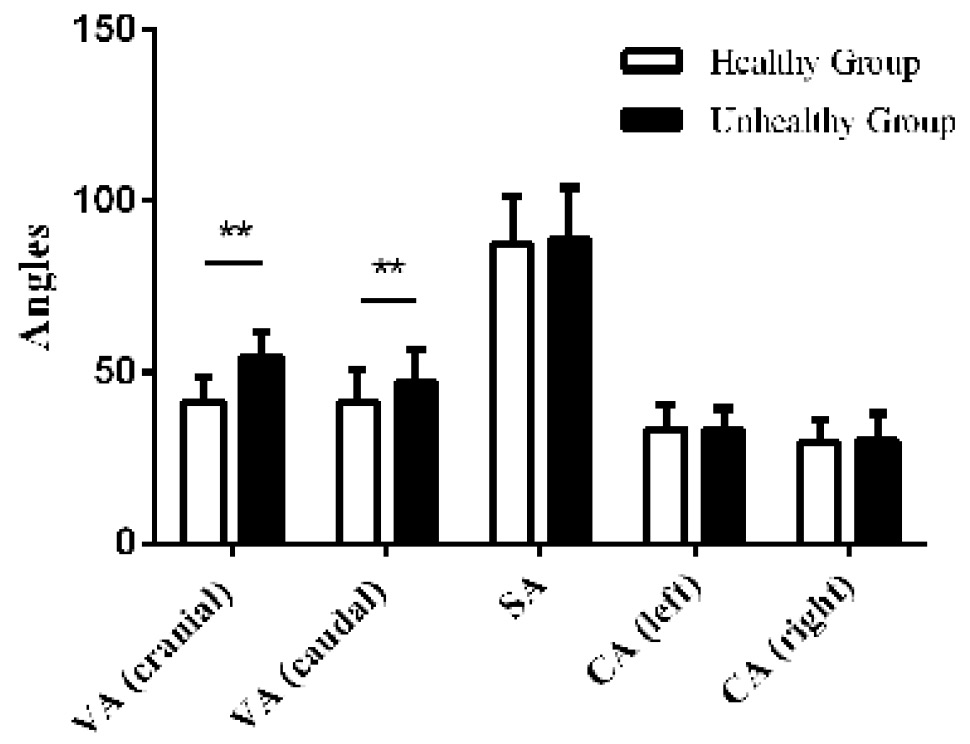
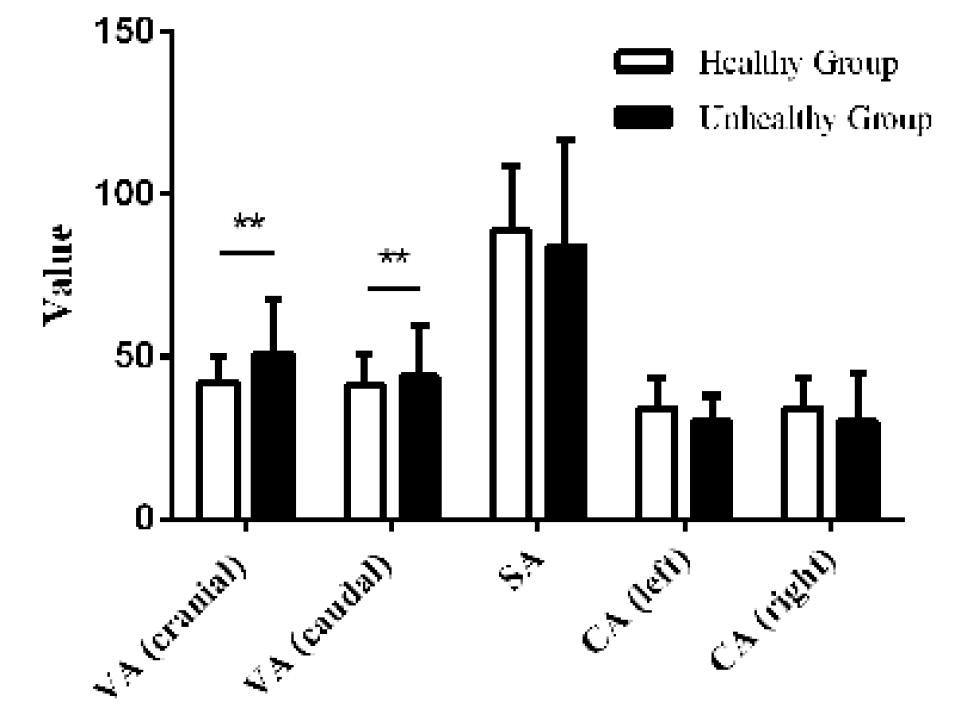
Variance analysis of PLFA in healthy group and unhealthy group. The bar with (**) indicates a significant difference (p<0.01) between the healthy group and the unhealthy group.


Variance analysis of the PLFA parameter between healthy group and unhealthy group. The bar with (**) indicates a significant difference (p<0.01) between the healthy group and the unhealthy group.


