
Technical Efficiency of Wheat Farms Under Irrigated Conditions in Central Sindh, Pakistan


Research Article
Technical Efficiency of Wheat Farms Under Irrigated Conditions in Central Sindh, Pakistan
Akbar Khan Khajjak1,4*, Adnan Nazir2, Tehmina Mangan1 and Ali Raza1
1Agricultural Economics, Faculty of Agricultural Social Sciences, Sindh Agriculture University Tandojam, Hyderabad, Pakistan; 2Balochistan University of Information and Technology, Engineering and Management, Zhob Campus, Balochistan, Pakistan; 3Rural Sociology Faculty of Agricultural Social Sciences, Sindh Agriculture University Tandojam, Hyderabad, Pakistan; 4Directorate of Water Management and High Efficiency Irrigation System, Agriculture Research Institute Quetta, Pakistan.
Abstract | The province of Sindh has almost 38 percent of its fertile land under wheat crop, and it is one of the main dietary foods of the indigenous population in comparison to other grains, fish, chicken, and meat. A total of 300 farmers were interviewed, therefore 150 farmers from each district Naushehro Feroze and Benazirabad were recorded. In this study, the Cobb-Douglas stochastic production frontier approach was employed for examining the technical efficiency and inefficiency factors in wheat production. The results indicated that the improvement in wheat production is due to the preferable utilization of land and practices used in cultivation. Where results denote that the wheat yields can be enhanced up to 0.275 percent by applying one percent more fertilizer in kilograms in wheat cultivation. Wheat farms were 87 percent commercially efficient, which indicates a great potential to enhance efficiency in the resources used in the productivity of wheat. It is evident that efficient usage of resources could add Rs.594.77 ($4.10) million of revenue each year to the economy. The research is based on and derived from wheat production, which is only for a single crop among various other crops. These findings would be quite useful in developing a precise policy for major food crops in Pakistan. These facts would support policy developers to divide resources with equal allocation between agricultural and services sectors while keeping numerous crops within the agricultural sector in the same consideration.
Received | July 27, 2022; Accepted | January 26, 2024; Published | April 26, 2024
*Correspondence | Akbar Khan Khajjak, Agricultural Economics, Faculty of Agricultural Social Sciences, Sindh Agriculture University Tandojam, Hyderabad, Pakistan; Email: akbareconomist70@gmail.com
Citation | Khajjak, A.K., A. Nazir, T. Mangan and A. Raza. 2024. Technical efficiency of wheat farms under irrigated conditions in central Sindh, Pakistan. Sarhad Journal of Agriculture, 40(2): 454-462.
DOI | https://dx.doi.org/10.17582/journal.sja/2024/40.2.454.462
Keywords | Wheat crop, Stochastic production frontier, Technical efficiency, Agriculture, Sindh
Copyright: 2024 by the authors. Licensee ResearchersLinks Ltd, England, UK.
This article is an open access article distributed under the terms and conditions of the Creative Commons Attribution (CC BY) license (https://creativecommons.org/licenses/by/4.0/).
Introduction
The agriculture sector plays a significant role in the economy of Pakistan which gives 22.2 percent of GDP and occupies 42.3 percent of the labour force (GoP, 2023). Wheat is grown highly in Pakistan on a subsistence basis for home utilization (Razzaq et al., 2023). On average, the households sustain 12.55 percent of their monthly spending on wheat grain and wheat flour (GoP, 2017). The wheat production in Pakistan stood at 27.634 million tonnes in 2022 (GoP, 2023), while the per capita consumption of wheat is 66.9 kgs per year which have decreased in the past few years in the world (Statista, 2017). Wheat efficiency and yield are the important cause of wheat supply. Availability of enough food is of utmost concern in a household, for food security at the provincial and country level. Any difference in the supply and demand of wheat in the world market influences the well-being of farmers, consumers, taxpayers and those directly or indirectly dependent on agriculture (Juan et al., 2017; Khan et al., 2008).
Wheat stands as a primary food source cultivated extensively in Pakistan, earning the country the sixth position globally in total wheat production (FAOSTAT, 2023). Wheat is the staple food of Pakistan’s population and establishes about 60% of the daily food intake for a common person and average per capita use is about 125 kg settled has a core status in governments policies related to agriculture (PARC, 2015).
The research underscores a substantial increase in Pakistan’s major crop yields, credited to high-yield seed varieties and improved water access. Irrigation is emphasized as crucial for sustained agriculture, alleviating suffering, and fostering prosperity (Mustafa, 1998; Pollard and Booth, 2019). Despite progress, poor soil fertility and suboptimal crop management hinder wheat yields. Expanding cultivation is impractical, making increased yield per unit area the primary focus. Strategic fertilizer use is proposed, potentially boosting wheat grain yield by 30-47% (Xu et al., 2020). The study highlights irrigation’s contribution to soil potassium and notes yields variations among similar farms, attributing it to a technical efficiency gap (Abedullah et al., 2006; Kalirajan et al., 1996). Crop water needs are discussed, suggesting post-wax ripening, irrigation may be unnecessary due to favourable weather conditions. Varied growing seasons due to differing elevations are noted, impacting harvest readiness from March/April in plains areas, with wheat sowing occurring between mid-October and late December (Majidano et al., 2010; Rasul, 1993).
In this study, we aim to examine the technical efficiency of wheat farms which are irrigated by surface water and groundwater in the study area. The offering of this study resides in its methodological and empirical applications. Methodologically, this study progresses the frontier of existing input-specific technical efficiency through the stochastic frontier model. Empirically, very few studies have focused on wheat production efficiency in various locations of distributaries and watercourses in irrigated wheat farming in Sindh Pakistan. The rest of the article is structured as follows. The stochastic production frontier to estimate technical and input-specific (wheat efficiency) technical efficiency is described in the next section. In section 3, the principal features of the study areas and data are described. Section 4 presents the results, and the final section draws conclusions and delivers a few policy implications.
Analytical context
Farms facing technical inefficiency and random shocks operate in a precarious environment, with productivity fluctuations due to process variability. The study utilizes a stochastic production frontier to analyse the impact of random shocks and inefficiency on production changes. Mismanagement of limited resources contributes to inefficiency, particularly in wheat production. Technical efficiency is evaluated through data envelopment analysis (DEA) and the stochastic production frontier. Recognizing the constraints of each method, the study opts for the stochastic production frontier method, which considers the inherent uncertainty in farmers’ operations (Aigner et al., 1977a; Meeusen and van Den Broeck, 1977). While ensuing their description, the stochastic production frontier can be described as:

Since yi indicates the production of wheat (grain) in the ith land, xi indicates the sequence of inputs k (or input costs), β denotes the vector of unidentified k parameters, and the error term is denoted as εi. The composed error is also known as the stochastic production frontier model due to it hypothesizes that the εi error term is disintegrated into two modules: Random shocks is a stochastic random error module and a technical inefficiency module indicated below:
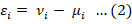
νi is a symmetrical, commonly dispersed random error (e.g., luck, climate) assumed to follow N(0, σ2), allowing for a stochastic production frontier. μi, representing technical efficiency, follows a half-normal distribution N(0, σμ2). The study adopts the prune-normal distribution for Frontier 4.1, considering truncated-normal and half-normal distributions (Coelli, 1996). The dual error modules (ν and u) are assumed to be independent (Aigner et al., 1977b; Greene, 1990, 2003; Meeusen and van Den Broeck, 1977; Papadopoulos, 2015). The variance parameters of the model are parameterized as:
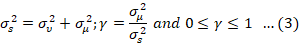
The value of γ parameter must range from 0 and 1. The MLE of Equation 1 delivers consistent estimators for β, γ, and σs2 parameters, since σs2 describes the total variability in the dependent variable attributable to random shocks (σµ2) together with technical inefficiency (σµ2). Therefore, Equations 1 and 2 deliver gauges for vi and µi after restoring εi, σs2 and γ by their estimates. Multiplying both sides of Equation 1 by e-vi and replacing the β’s with MLE yields the stochastic production frontier as:
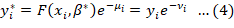
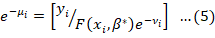
Where yi* is the yield of wheat in ith farm rearranged for the statistical arbitrarily commotion recorded by vi (Bravo-Ureta and Rieger, 1991). All supplemental variables are as elucidated timely and β* is the vector of parameters reckon by paramount likelihood estimation. The technical efficiency (TE) respective to the stochastic production frontier is captured by the one-sided error modules μi > 0, i.e.
For determining the technical inefficiency effect of socio-economic and management factor’s linear function is described in its general form.

In the empirical model, other features of dependent and independent variables are specified.
Data collection and sampling
In the present research Agriculture officers from the Department of Agricultural Extension were interviewed to identify the major wheat-producing villages indicated and selected in the Nawabshah and Naushehro Feroze districts. Out of 300 farmers, 150 from the individual district were selected by using a multi-stage random sampling strategy out of the wheat farmers. A field pre-tested and comprehensive questionnaire was used for interviewing and was used for recording detailed information on numerous features of wheat crops in the cropping year 2018-19.
The scrutinized data pertained particulars on demographic attributes of the farmers, output-input, management practices, and quantities. Details regarding marketing were also composed as a part of the survey which comprised particulars about the disposal pattern’s output, marketing cost, and packing material. Information on the production limitation of wheat production was collected. Household-related variables (age, years of education, farming experience, family size and earning members) and economic variables (cultivated area and input-output quantities) for the two districts are delineated and differentiated in Table 1. The number of seeds, labour and area distributed to wheat crop is significantly higher in Nawabshah district than that of Naushehro Feroz district. However, plant protection assessments, seed, fertilizer, labour, irrigation numbers and production are significantly higher in Nawabshah compared to Naushehro Feroze, respectively.
Empirical model
The study follows a three-stage empirical strategy. Firstly, a Cobb-Douglas production function measured for wheat production, chosen through the probability ratio test. This function guides variable selection for technical efficiency evaluation in stage 2. Secondly, significant coefficients from stage 1 are employed to estimate the stochastic frontier. Thirdly, technical efficiency from stage 2 used to regress the source of technical inefficiency.
Choosing production function
Cobb-Douglas is selected over the translog function using the likelihood ratio test. Despite its limitations, Cobb-Douglas accurately captures production resilience, aligning with the study’s focus on productivity assessment (Taylor and Shonkwiler, 1986).
Estimating stochastic frontier
The stochastic production frontier for wheat is estimated using maximum likelihood estimation:
Table 1: Summary statistics of the variables used in the empirical model.
|
Variables |
Naushehro Feroze |
Nawabshah |
||||
|
CD production function |
Unit |
Mean |
SD |
Mean |
SD |
|
|
Yield |
Kilograms |
19,335.00 |
21,231.73 |
43,004.48 |
47,923.62 |
|
|
Area |
Acres |
6.96 |
6.74 |
15.87 |
16.89 |
|
|
Seed |
Kilograms |
324.65 |
319.55 |
855.34 |
953.51 |
|
|
Fertilizer |
Kilograms |
1,475.30 |
1,398.24 |
3,490.21 |
3,932.60 |
|
|
Chemicals |
Number |
12.35 |
13.76 |
27.43 |
33.34 |
|
|
Labour |
Days |
101.97 |
96.69 |
238.33 |
257.83 |
|
|
Irrigation |
Numbers |
40.99 |
40.78 |
91.36 |
101.52 |
|
|
Variables used for inefficiency |
||||||
|
Farmers attributes |
||||||
|
Operators age |
Years |
42.67 |
10.89 |
42.10 |
9.83 |
|
|
Operators education |
Years |
5.98 |
4.48 |
5.83 |
4.83 |
|
|
Farming experience |
Years |
21.13 |
10.93 |
20.18 |
10.50 |
|
|
Family size |
Number |
10.47 |
5.18 |
10.49 |
4.81 |
|
|
Earning members |
Number |
3.84 |
2.38 |
3.87 |
2.14 |
|
|
Farm attributes |
||||||
|
Distributary |
Middle |
Binary |
0.47 |
0.50 |
0.48 |
0.50 |
|
Tail |
Binary |
0.26 |
0.44 |
0.26 |
0.44 |
|
|
Watercourse |
Middle |
Binary |
0.36 |
0.48 |
0.31 |
0.47 |
|
Tail |
Binary |
0.35 |
0.48 |
0.38 |
0.49 |
|
|
Water-related perceptions |
||||||
|
Salinity |
Binary |
0.23 |
0.42 |
0.17 |
0.38 |
|
|
Water logging |
Binary |
0.09 |
0.28 |
0.11 |
0.32 |
|
|
Water shortage |
Binary |
0.24 |
0.43 |
0.15 |
0.36 |
|
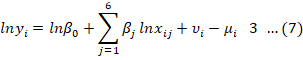
Where yi is the wheat yield, x1 to x6 are input variables, vi is the disturbance term, and ui is the farm specific error term.
Linking technical inefficiency sources
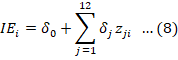
Technical inefficiency is modelled as a function of twelve variables:
Hypothesis testing
A likelihood ratio test confirms that the Cobb-Douglas production function is an accurate representation of the data, considering stochastic production frontier characteristics (Aigner et al., 1977b; Greene, 1990, 2003; Meeusen and van Den Broeck, 1977; Papadopoulos, 2015).
Results and Discussion
Stochastic frontier estimations
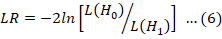
Maximum Likelihood Estimation (MLE) and Ordinary Least Square (OLS) outcomes regarding the production function by Cobb-Douglas, as defined in equation 8 tabulated in Table 1. The main concern here is the testification of null hypothesis (H0: δi = 0 = γ: where, i = 1 …6). As the findings notify that the log-likelihood function regarding the stochastic production frontier model is evaluated at 163.82, whereas for the OLS fit regarding production function, the estimated value is 156.50. This indicates that the normalized ratio of the likelihood for computing the absenteeism of the applied inefficiency impact after the frontier is estimated to be LR = -2*(156.50-163.82) = 14.64. The value is calculated using Frontier 4.1 where it is stated as the “LR” test for one-sided error where the degrees of freedom were set to be q+1, where q stands for the number of parameters, and elsewise γ quantified to be zero in H0, therefore in this case q=7. The “LR” test value is significant due to exceeding the value adapted from (Kodde and Palm, 1986). Kodde and Palm (1986) case applied when the number of parameters exceeds one involving the distribution of mixed chi-square. Moreover, the ratio for the test of log-likelihood directs that slackness occurs in the dataset and therefore the void hypothesis regarding the technical inefficiency impact on the productivity of wheat crop is neglected.
Table 2: Parameter estimates for stochastic production function.
|
Variables |
Coefficient |
SE |
T-ratio |
|
|
Intercept |
βo |
5.008*** |
0.335 |
14.948 |
|
Area |
β1 |
0.454*** |
0.096 |
4.709 |
|
Seed |
β2 |
-0.061* |
0.036 |
-1.696 |
|
Fertilizer |
β3 |
0.275*** |
0.072 |
3.795 |
|
Chemicals |
β4 |
0.066*** |
0.024 |
2.740 |
|
Labor |
β5 |
0.139** |
0.064 |
2.168 |
|
Irrigation |
β6 |
0.201*** |
0.037 |
5.514 |
|
Sigma-squared |
0.022 |
|||
|
Log-likelihood function |
156.504 |
|||
|
ML estimates for the stochastic production frontier |
||||
|
Intercept |
βo |
5.1015 |
0.3351 |
15.2251 |
|
Area |
β1 |
0.4616 |
0.0967 |
4.7717 |
|
Seed |
β2 |
-0.0809 |
0.0359 |
-2.2531 |
|
Fertilizer |
β3 |
0.2835 |
0.0723 |
3.9236 |
|
Chemicals |
β4 |
0.0542 |
0.0234 |
2.3133 |
|
Labor |
β5 |
0.1643 |
0.0637 |
2.5800 |
|
Irrigation |
β6 |
0.1963 |
0.0347 |
5.6485 |
|
Inefficiency effect model |
||||
|
Intercept |
δ0 |
-0.4041 |
0.6484 |
-0.6233 |
|
Age |
δ1 |
0.0461 |
0.1342 |
0.3435 |
|
Education |
δ2 |
-0.0217 |
0.0239 |
-0.9083 |
|
Farming experience |
δ3 |
0.0211 |
0.0534 |
0.3949 |
|
Family size |
δ4 |
0.0767 |
0.0718 |
1.0674 |
|
Earning members |
δ5 |
-0.0676 |
0.0761 |
-0.8881 |
|
Located in the middle of the distributary |
δ6 |
0.0509 |
0.0734 |
0.6941 |
|
Located on the tail of the distributary |
δ7 |
0.0425 |
0.0908 |
0.4686 |
|
Located in the middle of the watercourse |
δ8 |
0.0215 |
0.0641 |
0.3348 |
|
Located on the tail of the watercourse |
δ9 |
-0.0146 |
0.0679 |
-0.2153 |
|
Salinity |
δ10 |
0.0880 |
0.0816 |
1.0788 |
|
Water logging |
δ11 |
-0.1059 |
0.1156 |
-0.9154 |
|
Water shortage |
δ12 |
-0.0466 |
0.0709 |
-0.6570 |
|
Sigma-squared |
0.0461 |
0.0245 |
1.8809 |
|
|
Gamma |
0.7693 |
0.1221 |
6.2994 |
|
|
Log-likelihood function |
163.821 |
|||
So, the coefficient signs on all the variables computed using equation 8 and assessed with the MLE technique are useful with exception of hours of irrigation and fertilizer that found to be obstructive but statistically trifling see Table 2. This denotes the irrigation hours and fertilizer does not affect the yield of the wheat crop notably. Though, the fertilizer’s negative sign could be because of the rationale that the growers apply too much fertilizer than the level suggested or at a decreasing level of minimal productivity. Therefore, the study focuses on the future and should be on discovering this important matter. The number of irrigations has a positive and statistically outstanding impact on wheat production. It might be due to the nature of groundwater used for irrigating wheat crops is not appropriate for agricultural practices, or there may be overexploitation of water in wheat productivity. However, more studies are required to verify the quality of groundwater and its effects on the productivity of the wheat crop.
The parameters used in the production function of Cobb-Douglas can be elucidated precisely as adaptability in output. The number of fertilizer parameters, area in acres, number of irrigations applied, number of chemical sprays, and labour man days were noted to have positive signs and were significant statistically. This indicates that such inputs play a vital role in the production of wheat crops. In all the variables included in the model, the elasticity of area land is highest. indicating that the involvement of the area is dominant in the entire factor of productivity. Denoting that a percent rise in the area contributes to a 0.454 percent expansion in wheat production. And the improvement in wheat production is due to the preferable utilization of land and practices used in cultivation. Another main input is fertilizer usage in the cultivation process. Where results denote that the wheat yields can be enhanced up to 0.275 percent by applying one percent more fertilizer in kilograms in wheat cultivation. This is because of high seed germination on the dosage recommended and well-prepared seed beds. Seed is another main input used in the production of wheat. The coefficient sign for the seed variable is negative but statistically significant. Indicating that a one percent change in the seed would alter the production level by -0.061 percent. And the maximum speed application improves the population of plants in the area and eventually boosts production. A percent of the increase in the application of labour man days contributes to a 0.139 percent growth in wheat yield. This boost in productivity is due to preferable cultivation and management applications. A percent of the increase in the application of irrigation including both surface and groundwater contributes to 0.201 percent growth in wheat yield. The average technical efficiency is computed to be 87 percent, representing that additional capacity persists to enhance the efficiency and productivity of the allocation of sources for the productivity of wheat (Table 2).
Table 3: Frequency distribution of technical efficiency.
|
Efficiency interval |
Number of farms |
Percentage |
|
0.60<TE<0.65 |
1 |
0.3% |
|
0.65<TE<0.70 |
5 |
1.6% |
|
0.70<TE<0.75 |
14 |
4.6% |
|
0.75<TE<0.80 |
23 |
7.5% |
|
0.80<TE<0.85 |
43 |
14.0% |
|
0.85<TE<0.90 |
81 |
26.4% |
|
0.90<TE<0.95 |
122 |
39.7% |
|
0.95<TE<1.00 |
18 |
5.9% |
|
Mean |
0.8748 |
|
|
SD |
0.0653 |
|
|
Maximum |
0.9675 |
|
|
Minimum |
0.6379 |
|
A higher level of technical efficiency is indicated by TE close to one.
It is detected that the MLE assessment using equation 8 of γ is 0.769 with a projected standard error of 0.122 (Table 2). This result goes true in the theory that value-γ must be less than one and higher than zero. The γ-estimate evaluation is suggestively diverse by one, it demonstrates that random shocks have a vital role in the amplification of difference in the wheat yield, which is projected particularly in an agricultural situation where the risk of variation in climatic conditions and uncertainty is expected to be the diversion’s main source. it indicates that the production frontier of the stochastic model is considerably distinct from the generalized frontier does not include a random error. Nevertheless, it is mentioned that the 76.9 percent change in wheat production is the technical inefficiency result whereas 23.1 percent is due to the random error stochastically.
Technical inefficiency source determination
To compute the factors of inefficiency on the production function, the technical inefficiency effects frontier model (Battese and Coelli, 1992) explained in equation 11 was utilized. Where the dependent variable is presumed as an inefficiency score. In addition, we took the grower’s age variable as a factor of farming escapade and the result indicates that coefficient thoroughly notable having a sign denoting experience of grower positively affect inefficiency of farmers. While the education coefficient for the farmers also has a negative sign. The coefficient sign of family size denotes a positive relationship with technical inefficiency. Likewise, the coefficient of the number of earning members in the family discovered a negative relationship with technical inefficiency, and this may be due to the low rate of earning members in a family. Furthermore, the coefficient sign of the location of the farm regarding the distributary on the middle and tail and farms situated in the middle of the watercourse was positive indicating a positive impact.
Figure 1 reports the frequency distribution of technical inefficiency. 96.7 percent and 63.7 percent are the maximum and minimum values of technical efficiency, respectively. The average technical efficiency regarding the production of the wheat crop is 87.4 percent representing that possible subsists to improve wheat yield by allocating the present resources more efficiently. The computed average technical efficiency was found to be higher than that results by (Iqbal et al., 2001) for Pakistan regarding wheat growers. Various studies conducted in Pakistan indicate that technical efficiency levels for wheat farms in Sindh province are lower than that concluded by (Hassan, 2004) for wheat crop i-e 93.6 percent in the existing Punjab province’s farming system.
Figure 1 notifies that majority of the farms ranged between 90-95 percent and were technically efficient. Moreover, 5.9 percent of the farms were found to be highly efficient contributing more than 95 percent. Whereas 24.6 percent of the farms ranged between 85-90 percent technically efficient. A very small proportion contributing 0.3 percent of the farms were technically efficient and ranged between 60-65 percent.
With available resources, the average yield can be increased from 2.41 tonnes per acre to almost 4 tonnes per acre by upgrading technical efficiency from 87 to 100 percent. According to (GoS, 2018), the total area under wheat production in Sindh province is 2,889,942 acres and enhancement regarding up to 100 percent technical efficiency would let wheat production grow from 3,910,394 tonnes to 4,418,745 tonnes per year. This addition of 508,351 tonnes of wheat production can potentially raise Rs.594.77 ($4.10) million in revenue each year. The outcomes prove the significant benefits of extra efficient input use in wheat productivity. If results of the same kind triumph in all major crops yield, then it indicates the progress efficiency in resource use can lead towards extraordinarily generate profits at the farm level.
Conclusions and Recommendations
Technical inefficiency was analyzed by using the stochastic production frontier in the wheat yield study. It was evaluated that wheat farms were technically efficient at around 87 percent, depicting that a significant prospective subsist that can be inspected by upgrading wheat production through resource use efficiency. An additional Rs.594.77 ($4.10) million of revenue each year in the province can be added by improving resource use efficiency. The outcomes obtained only from wheat productivity, which is, among others, only one crop.
In addition, the coefficient seed was negative but significant implying that the input was being over-used. Here forth, the study should be conducted on finding the best use of fertilizer for wheat productivity. Therefore, the irrigation coefficient was significant implying that there was enough usage of surface water and groundwater. The findings also indicate that the coefficient farms located on the tail of the watercourse were technically inefficient followed by water logging and water shortage effect concerning productivity. However, enhancement in these activities can be proven a better role in the improvement of technical efficiency of wheat production. It will be better to aim at the research of the economic analysis of water delivery (irrigation and drainage) by evaluating these services and their cost versus benefits, and it will help decision-makers to reach more effective policies for agriculture regarding the future role of irrigation and drainage system.
Lastly, the abovementioned culminations are justifiable at most for wheat productivity, and it is also liable to focus on a brief study on major crops to come about a policy for major food crops, a deserted frontier of food in Pakistan. Therefore, this research study will help the policymakers to pave an efficient path in balancing resource allocation among non-agricultural and agricultural sectors, and also the different crops in the agriculture sector.
Policy recommendation
To enhance wheat farm efficiency (currently at 87%), policymakers should prioritize resource use efficiency initiatives, potentially generating an annual additional revenue of Rs.594.77 ($4.10) million. Addressing the over-utilization indicated by the negative seed usage coefficient requires further research to optimize fertilizer use sustainably. While the irrigation coefficient suggests efficient water use, tackling inefficiencies in specific areas, like farms on the tail of watercourses, water logging, and water shortage, is crucial. Strategic investments in these areas can significantly boost wheat production efficiency. Additionally, conducting a comprehensive economic analysis of water delivery systems is essential for aligning investments with the goal of enhancing overall agricultural productivity. Extending similar research to major crops is imperative for comprehensive policy frameworks, facilitating better resource allocation and fostering a balanced and resilient agricultural landscape.
Acknowledgement
This study is derived from the the data collected by the Australian Government funded Project “Improving Groundwater Management to Enhance Agriculture and Farming Livelihoods in Pakistan” under Australian Center for International Agriculture Research (ACIAR) Pakistan. The authors are grateful to the referee for valuable comments and suggestions in improving the paper.
Novelty Statement
The study is first of its kind in Sindh, revealing that majority of whet farms operate near optimal efficiency, with significant room for improvement in the remaining. About 39.7% wheat farms are 90-95%
technically efficient, prioritize based initiatives are needed to generate additional revenue.
Author’s Contribution
Akbar Khan Khajjak: Conceptualization of the paper, validation, formal consideration, analysis, and correspondence.
Adnan Nazir: Methodology development, technical formatting.
Tehmina Mangan: Investigation, supervision, and review.
Ali Raza: Date entry, write-up.
Conflict of interest
The authors have declared no conflict of interest.
References
Abedullah, A., K.B. Bakhsh and B. Ahmad. 2006. Technical efficiency and its determinants in potato production, evidence from Punjab, Pakistan. Lahore J. Econ., 11: 1–22. https://doi.org/10.35536/lje.2006.v11.i2.a1
Aigner, D., C.A.K. Lovell and P. Schmidt. 1977a. Formulation and estimation of stochastic frontier production function models. J. Econ., 6: 21–37. https://doi.org/10.1016/0304-4076(77)90052-5
Bajwa, M.F., 1989. Potassium mineralogy of Pakistani soils and its effect on potassium response, in Proc. Workshop on the Role of Potassium in Improving Fertilizer Use Efficiency. National Fertilizer Development Center, Islamabad, Pakistan. pp. 203–216.
Battese, G.E. and T.J. Coelli. 1992. Frontier production functions, technical efficiency and panel data: With application to paddy farmers in India. Int. Appl. Prod. Effic. Anal. Springer, pp. 149–165. https://doi.org/10.1007/978-94-017-1923-0_10
Bravo-Ureta, B.E. and L. Rieger. 1991. Dairy farm efficiency measurement using stochastic frontiers and neoclassical duality. Am. J. Agric. Econ., 73: 421. https://doi.org/10.2307/1242726
Coelli, T.J., 1995. Estimators and hypothesis tests for a stochastic frontier function: A monte carlo analysis. J. Product. Anal., 6: 247–268. https://doi.org/10.1007/BF01076978
Coelli, T.J., 1996. A computer program for stochastic frontier production and cost function estimation. Dept. Econ. Univ. New England, Armidale, Aust.
Coelli, T.J., 1999. Frontier 4.1: A computer program for stochastic frontier production and cost function estimation. Econ. J., 109: 453–462.
Coelli, T.J. and G.E. Battese. 1996. Identification of factors which influence the technical inefficiency of Indian farmers. Aust. J. Agric. Econ., 40: 103–128. https://doi.org/10.1111/j.1467-8489.1996.tb00558.x
Finance Division, 2023. 02_Agriculture Pakistan Economic Survey, GOP 21–21. https://doi.org/10.1007/978-981-19-6868-6_2
Food and Agriculture Organization. 2023. FAOSTAT: Crops.
GoP. 2017. Pakistan Economic Survey, Ministry of Finance, Economics Affair Division, Government of Pakistan.
GoP. 2023. Pakistan Economic Survey, Ministry of Finance, Economics Affair Division, Government of Pakistan.
GoS. 2018. Bureau of Statistics, Planning and Development Department, Government of Sindh.
Greene, W.H., 1990. A gamma-distributed stochastic frontier model. J. Econ., 46: 141–163. https://doi.org/10.1016/0304-4076(90)90052-U
Greene, W.H., 2003. Simulated likelihood estimation of the normal-gamma stochastic frontier function. J. Product. Anal., 19: 179–190.
Hassan, S., 2004. An analysis of technical efficiency of wheat farmers in the mixed farming system of the Punjab, Pakistan. University of Agriculture, Faisalabad.
Iqbal, M., M.A. Khan, M. Ahmad and B. Ahmad. 2001. Determinants of higher wheat productivity in irrigated Pakistan. Pak. Dev. Rev., pp. 753–766. https://doi.org/10.30541/v40i4IIpp.753-766
Juan, J.H., Y.Y. Jie and Z.G. Qiang. 2017. Hydrogen peroxide involved in tip growth of wheat (Triticum aestivum) root hairs by high concentration chlorogenic acid. Can. J. Agric. Crop., 2: 22–33. https://doi.org/10.20448/803.2.1.22.33
Kalirajan, K.P. and J.C. Flinn. 1983. The measurement of farm-specific technical efficiency. Pak. J. Appl. Econ. 2: 167–180.
Kalirajan, K.P., Obwona, M.B., Zhao, S., 1996. A Decomposition of total factor productivity growth: The case of chinese agricultural growth before and after reforms. Am. J. Agric. Econ. 78, 331. https://doi.org/10.2307/1243706
Kenneth, H., S., Muller, J., 1977. Sources of technical efficiency: The roles of modernization and information. The University of Michigan, Ann Arbor.
Khan, M.J., Ahmad, S., Saddozai, K.N., 2008. Economic analysis of wheat profitability in Peshawar Valley, NWFP. Pakistan J. Life Soc. Sci., 6: 112–117.
Kodde, D.A., Palm, F.C., 1986. Wald criteria for jointly testing equality and inequality restriction. Econometrica, 54: 1243–1248. https://doi.org/10.2307/1912331
Kumbhakar, S.C., 1994. Efficiency estimation in a profit maximising model using flexible production function. Agric. Econ., 10: 143–152. https://doi.org/10.1016/0169-5150(94)90003-5
Lingard, J., L. Castillo and S. Jayasuriya. 1983. Comparative efficiency of rice farms in Central Luzon, the Philippines. J. Agric. Econ., 34: 163–173. https://doi.org/10.1111/j.1477-9552.1983.tb00986.x
Majidano, S.A., M.Y. Khuhawar and A.H. Channar. 2010. Quality assessment of surface and groundwater of Taluka Daur, District Nawabshah, Sindh, Pakistan. J. Chem. Soc. Pakistan, 32: 745.
Meeusen, W., and J. van Den Broeck. 1977. Efficiency estimation from cobb-douglas production functions with composed error. Int. Econ. Rev. (Philadelphia). 18: 435. https://doi.org/10.2307/2525757
Mustafa, D., 1998. Structural causes of vulnerability to flood hazard in Pakistan. Econ. Geogr., 74: 289–305. https://doi.org/10.1111/j.1944-8287.1998.tb00117.x
Mustafa, S.M.T., E. Vanuytrecht and M. Huysmans. 2017. Combined deficit irrigation and soil fertility management on different soil textures to improve wheat yield in drought-prone Bangladesh. Agric. Water Manage., 191: 124–137. https://doi.org/10.1016/j.agwat.2017.06.011
Narala, A. and Y.C. Zala. 2010. Technical efficiency of rice farms under irrigated conditions in central Gujarat. Agric. Econ. Res. Rev., 23: 375–381.
Papadopoulos, A., 2015. The half-normal specification for the two-tier stochastic frontier model. J. Product. Anal., 43: 225–230. https://doi.org/10.1007/s11123-014-0389-8
PARC, 2015. Status paper Wheat in Pakistan. Islamabad.
Pollard, C.M. and S. Booth. 2019. Food insecurity and hunger in rich countries, it is time for action against inequality. Int. J. Environ. Res. Publ. Health, 16. https://doi.org/10.3390/ijerph16101804
Rasul, G., 1993. Water requirement of wheat crop in Pakistan. J. Energy Appl. Sci., 12.
Razzaq, A., H. Liu, M. Xiao, K. Mehmood, M.A. Shahzad and Y. Zhou. 2023. Analyzing past and future trends in Pakistan’s groundwater irrigation development: Implications for environmental sustainability and food security. Environ. Sci. Pollut. Res., 30: 35413–35429. https://doi.org/10.1007/s11356-022-24736-5
Ranjha, A.M., 1988. Morphological, mineralogical and chemical properties of some soils of Pakistan. University of Agriculture Faisalabad, Pakistan.
Seyoum, E.T., G.E. Battese and E.M. Fleming. 1998. Technical efficiency and productivity of maize producers in eastern Ethiopia: A study of farmers within and outside the Sasakawa-Global 2000 project. Agric. Econ. 19: 341–348. https://doi.org/10.1111/j.1574-0862.1998.tb00536.x
Sharif, N.R. and A.A. Dar. 1996. An empirical study of the patterns and sources of technical inefficiency in traditional and HYV rice cultivation in Bangladesh. J. Dev. Stud., 32: 612–629. https://doi.org/10.1080/00220389608422431
Statista, 2017. Global wheat production. Glob. Wheat Prod.
Taylor, T.G. and J.S. Shonkwiler. 1986. Alternative stochastic specifications of the frontier production function in the analysis of agricultural credit programs and technical efficiency. J. Dev. Econ., 21: 149–160. https://doi.org/10.1016/0304-3878(86)90044-1
Xu, A., L. Li, J. Xie, X. Wang, J.A. Coulter, C. Liu and L. Wang. 2020. Effect of long-term nitrogen addition on wheat yield, nitrogen use efficiency, and residual soil nitrate in a semiarid area of the Loess Plateau of China. Sustain., 12: 1–17. https://doi.org/10.3390/su12051735
To share on other social networks, click on any share button. What are these?


