
Soil Salinity and Economic Analysis of Bitter Gourd (Momordica charantia L.) Production using the Drip Irrigation Method


Research Article
Soil Salinity and Economic Analysis of Bitter Gourd (Momordica charantia L.) Production using the Drip Irrigation Method
Kamran Baksh Soomro1*, Sina Alaghmand2, Sanyogita Andriyas3, Muhammad Rehmatullah Khan4, Naveedullah5 and Amin Talei6
1Institute of Plant Introduction, Southern-zone Agricultural Research Center, PARC, Karachi University Campus, Karachi, Pakistan; 2Department of Civil Engineering, Monash University, 23 College Walk, Clayton, VIC 3800, Australia; 3School of Engineering and Technology, Asian Institute of Technology, Pathumthani, Thailand; 4Provincial Coordinator Khyber Pakhtunkhwa, Asian Development Bank; 5Department of Water Resources Management, The University of Agriculture, Peshawar, 25130, Khyber Pakhtunkhwa, Pakistan; 6Civil Engineering Discipline, School of Engineering, Monash University, Selangor Darul Ehsan, Malaysia.
Abstract | Due to the unavailability of fresh water for agriculture, the use of saline water often emerges as an alternate source of irrigation. However, one hardly knows the economic implications of such recommendations. In this regard, the effect of saline irrigation on the economics of crop yield deserves scientific inquiry. A field experiment was conducted during 2018-19 to study the impact of saline water on the economics of bitter gourd yield and soil salinity after the end of the crop. Two irrigation treatments including freshwater (IT1 EC 0.56 dS.m-1; control condition) and saline groundwater (IT2 EC 2.56 dS.m-1; experimental condition), in two consecutive seasons, were used under the drip system of irrigation. The crop yield in season 1, found under IT1 and IT2, were 11,337.3 and 7764.4 kg.ha-1, respectively, without any salt accumulation in the wetted zone in both scenarios. Nevertheless, salts deposited at the wetted periphery at all three sampling depths, under both irrigation treatments, after the crop end. The benefit-cost Ratio (BCR) per hectare in season 1 was 1.90 and 1.69 under IT1 and IT2, respectively. While for season 2, the BCR was 1.89 and 1.59 under IT1 and IT2, respectively. In terms of crop yield, overall, IT1 showed better results as compared to IT2 irrigation treatments.
Received | September 05, 2020; Accepted | March 25, 2021; Published | May 06, 2021
*Correspondence | Kamran Baksh Soomro, Institute of Plant Introduction, Southern-zone Agricultural Research Center, PARC, Karachi University Campus, Karachi, Pakistan; Email: kamisoomro75@hotmail.com
Citation | Soomro, K.B., S. Alaghmand, S. Andriyas, M.R. Khan, Naveedullah and A. Talei. 2021. Soil salinity and economic analysis of bitter gourd (Momordica charantia L.) production using the drip irrigation method. Sarhad Journal of Agriculture, 37(2): 511-520.
DOI | https://dx.doi.org/10.17582/journal.sja/2021/37.2.511.520
Keywords | Benefit-cost ratio, Drip irrigation, Soil salinity, Wetted zone, Wetted periphery
Introduction
The lack of freshwater and soil salinity impose severe constraints on agricultural productivity globally, specifically in dry climatic conditions (Kang et al., 2017). Also, the increasing world population is facing a severe shortage of freshwater (Abdelkhalik et al., 2019; Mekonnen and Hoekstra, 2016). Given that around 92% of the water in the world associates with agriculture (Hoekstra et al., 2012; Nouri et al., 2019), there would be a growing concern about declining freshwater supplies which may endanger meeting the growing demands (Aparicio et al., 2019). The water shortage limits sustainable agricultural development globally (Kumar et al., 2015), and also leads to plant stress, soil moisture tension and decreased crop yields (Sam-Amoah et al., 2013). This eventually results in risk in food security (Ayeni et al., 2015).
Agriculture is affected by salinity in coastal zones, which are due to high saline water for irrigation due to groundwater contamination through the natural intrusion of saline water (Jodder et al., 2016). Saline water for irrigation reduced the growth and productivity of various crops (Irshad et al., 2009) causing saline stress (Hasegawa et al., 2000). Irrigation water containing large amounts of sodium is of special apprehension due to the sodium’s effects on the soil and tendering sodium hazard (Siamak and Srikantaswamy, 2008). This reduced the accessibility of water to crop due to osmotic pressure resulting in yield reduction (Bauder et al., 2007). The application of saline water with a salinity of 3 g.L-1 is shown not to impact the yield reduction (Yuan et al., 2019).
Positive management of saline water based on better farming practices for agricultural usage can improve water productivity (Howell, 2001; Jones, 2004). Previous studies have revealed that drip irrigation is effective in increasing water productivity for different plants without causing high yield reduction (Geerts and Raes, 2009). In fact, the influence of deficit irrigation on the development and productivity of various vegetables and field crops have been widely studied (Amer, 2011; Igbadun et al., 2008). There has been a growing trend of using saline water for vegetable production through an efficient irrigation approach where value vegetable crop yield can be obtained. For vegetable cultivation, the use of groundwater with drip irrigation technology is also a viable option to be cost-effective (de Bont et al., 2019).
Cost-benefit analysis (CBA) estimates and relates all the costs and benefits of social, environmental and economic influence of the adaptation methods, which are stated in monetary terms built on its overall information. CBA is somewhat simple and broadly used method that measures how a specific economy at a particular site maybe different from new applications and policies (Maliva, 2014). The application of CBA for the estimation of tasks associated with water usage has recently obtained specific attention, even if the amount of water resources is not evaluated directly (Aparicio et al., 2019). The benefit cost-ratios of drip investments in Pakistan range from 1.7 to 2.0, depending on the crops and the availability of subsidies (Bell et al., 2017). For small-scale vegetable farming, groundwater in combination with drip irrigation technology is also a viable opportunity to be cost-effective (de Bont et al., 2019).
Bitter gourd (Momordica charantia L.) and bitter cucumber (Heiser, 2016), belong to Cucurbitaceous family. It is consumed worldwide and booms well in humid, arid, and temperate areas (Milind and Satbir, 2011; Pandey et al., 2008). The bitter-gourd crop is moderately salt-tolerant (Lim, 1998) and is mainly valued for its nutritional and medicinal properties (Dalamu et al., 2012). Its fruits and roots are used due to the occurrence of beneficial phytochemicals in it (Hirpara et al., 2015). This crop is broadly cultivated in Pakistan at an area of 6107 ha with an annual production of 57190 ton (Atif et al., 2016). Though, irrespective of the current development and the value of this crop as a fabulous source of income, there is still a lack of information on it (Zhang et al., 2018). Nevertheless, bitter gourd response under drip with different irrigation treatments and their economic viability is not well known. Although initial and maintenance costs using drip irrigation technology are equally high in comparison with traditional methods of cultivation. To increase profitability, it is important to develop suitable technology which will reduce the cost of production. Moreover, seasonal water application of bitter gourd under drip irrigation has not been reported.
Materials and Methods
Study site
A field experiment was carried out in Malir, Karachi, located at 24.56N and 67.07E. The soil texture of the experimental site was sandy loam. The climate of this area is warm and semi-arid, while the maximum temperature in summer exceeds 40°C. The evaporation rate in the southern-zone of Sindh is more than any other place in Pakistan (van Steenbergen et al., 2015). The mean annual precipitation is 217 mm; whereas, due to the vicinity to the sea, the relative humidity ranges from 52% to 78% (PMD, 2017).
Field experiment
Two irrigation treatments with IT1 (ECiw 0.56 dS.m-1) and IT2 (ECiw 2.56 dS.m-1) were used in the study which consisted of two cropping seasons, including season 1 between May-2018 to Sep-2018 and the other (season 2) between Nov-2018 to Apr-2019. The experiment was designed with two variable factors (i.e., irrigation treatment and cropping season) in a Randomized Complete Block Design (RCBD). The plots were divided into two equal blocks (243 m2 each). One plot was used for IT1 (ECiw 0.56 dS.m-1) and the other for IT2 (ECiw 2.56 dS.m-1). Each block was further divided into three replications (R1, R2, and R3).
To obtain the soil salinity status and determine the texture, field capacity (FC), wilting point (WP) and dry bulk density (DBD) before the experiment, 18 soil samples from experimental sites (i.e., 9 from each plot) were taken at the depths of 0-15, 15-30 and 30-60 cm, respectively. For soil moisture content, the soil samples were oven-dried at a temperature of 105°C for 24 hours.
For the chemical analysis including EC, pH, SAR, and ESP, these samples were thoroughly mixed to obtain a composite sample. and analyzed as suggested by Richards (1954). The soil texture was determined by the Bouyoucos hydrometer method, Electrical Conductivity (EC) was determined by digital EC meter (model HI-8333), while pH was recorded by digital pH meter (SP-34 sunteor). All the above parameters were determined using the methods suggested by Richards (1954).
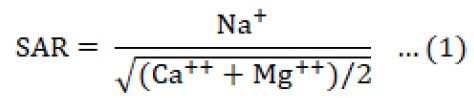
Rowell (1994) suggested the Sodium Adsorption Ratio (SAR) is an estimated expression for the relative activity of Na+ ions in exchange reactions in soils.
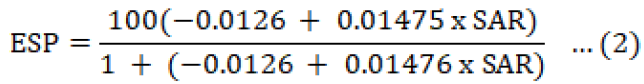
Exchangeable sodium percentage (ESP) was calculated using Rowell (1994).
Irrigation water has a significant role in acquiring the best crop yield beyond producing adversarial effects on the soil. In this study, two water qualities were used for crop plantation. Thus, it is required to determine water quality. Water samples were collected periodically and analyzed for the ECw, pH, SAR, and RSC parameters by (Kargas et al., 2017; Laboratory, 1954).
Soil salinity assessment
Two types of irrigation water (i.e., freshwater (ECiw 0.56 dS.m-1) and saline water (ECiw 2.56 dS.m-1) were used to grow bitter gourd under drip irrigation system. Thus, to observe the change in soil ECe, pH, and sodium adsorption ratio (SAR) parameters, the soil samples at subsequent depths from a wetted zone and a welted periphery under dripper was drawn after harvest of the crop in season 1 and season 2, respectively. The soil samples were examined in the laboratory for the ECe, pH, and SAR, as suggested by Richards (1954).
Crop yield
The yield of the crop for each plot was noted fortnightly from September 2018 to October 2018 and from March 2019 to April 2019 in season 1 and 2, respectively. The fruit was picked from time to time from both plots, the yield was recorded accordingly.
Statistical analysis
SPSS software for the statistical analysis was used for the analysis of data. Statistical evidence in support of the hypothesis was reported in the form of descriptive statistics parameters. During the data collection phase, the experiments were replicated three times, and thus we had a comprehensive dataset with three replications. The results obtained for crop yield in the three replications were found close to each other, nevertheless, all the statistical tests were conducted on each replication dataset to draw a more meaningful and thorough conclusions from the collected data.
Pair-wise t-test for comparing the effect of crop yield using IT1 and IT2
For comparing the effect of average crop yield, under IT1 and IT2 , respectively, for the collected data from seasons 1 and 2, a paired t-test was used. The tests were repeated for all three replications of data to get a comprehensive and meaningful conclusion.
Economic analysis
The economic analysis for bitter gourd production was evaluated under IT1 and IT2 for seasons 1 and 2, respectively. The analysis involved costing of the inputs and comparing them with the sales from the harvest. The irrigation costs of freshwater (IT1) under drip irrigation is significantly higher with 817 US-$ ha-1 compared to (IT2) with 616 US-$ ha-1 for the low yield The average market price per kilogram of bitter gourd was obtained in Pakistani rupee and converted in US dollars. The productivity of bitter gourd per hectare was calculated in terms of gross margin, gross return, the net return, and benefit-cost ratio.
Benefit-cost ratio
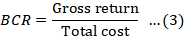
The Benefit-cost Ratio (BCR) contributes to the ratio between the current value of profits and the current value of costs. BCR is used to evaluate the economic feasibility of the plan. The ratios used for CBA comprised a net present value (NPV) and the benefit-cost ratio (BCR). BCR is the value of all benefits divided by all current value costs, whereas NPV is the difference between the value of all existing and future, benefits and the value of all current and upcoming costs (Gittinger, 1982; Kuwornu et al., 2013).
BCR was calculated for irrigation treatment IT1 and IT2 in season 1 and season 2 by considering many inputs used in the drip irrigation system during the experiment. The total income from yield over an area of one-hectare was considered to work out net seasonal income and benefit-cost ratio. The revenue from yield was calculated using the prevailing average market value. The effective life of a drip irrigation system was taken to be 10 years. BCR and net profit were calculated to determine the economic viability of the crop for the drip irrigation system by the following equation (Gittinger, 1982).
The net income and benefit-cost ratio (BCR) under both irrigation treatments was calculated by dividing the cost-benefit under each treatment. The average market price of 0.35$ per kg was taken for bitter-gourd for economic analysis.
Results and Discussion
The soil characteristics are presented in Table 1 which show that the texture of soil was sandy loam and the available mositure ranged from 8.5 to 8.6. Whereas the field capacity ranged from 14.6 to 14.7% which shows low water holding capacity of the experimental soil. Hence, such type of soil needs frequent irrigation to avoid seepage and percolation losses.
Table 1: Soil characteristics of the experiment site.
|
Parameters |
IT1 (ECiw 0.56 dS.m-1) freshwater |
IT2 (ECiw 2.56 dS.m-1) saline water |
|
Soil texture |
Sandy Loam |
Sandy Loam |
|
Dry bulk density (gm.cm-3) |
1.58 |
1.56 |
|
Infiltration rate (cm.hr-1) |
1.54 |
1.57 |
|
Field capacity (%) |
14.7 |
14.6 |
|
Wilting point (%) |
6.2 |
6.0 |
|
Available moisture (%) |
8.5 |
8.6 |
The soil under irrigation, in IT1 and IT2, was normal with ECe < 4.0 dS.m-1, pH < 8.0, and SAR < 7.0 at all sampling depths before the experiment (as shown in Figure 1).
The analytical results of soil samples for soil electrical conductivity (ECe) are presented in Table 2. It reveals that before the start of crop sowing, the average soil ECe at depths 0-15, 15-30 and 30-60 cm, respectively, under both the plots, ranged from 2.8 to 3.3 dS.m-1 which indicated that the soil was non-saline (ECe< 4.0 dS.m-1). ECe at the wetted zone ranged from 2.8 to 3.0 dS.m-1 indicating that the soil remained unchanged i.e. non-saline, whereas, at the wetted periphery, it changed from non-saline to slightly saline at all the tree sampling depth i.e. ECe > 4.0 dS.m-1, under IT1. The soil samples taken from both plots were also analyzed for pH determination to observe the change in pH values. From Table 3, it can be observed that the soil pH of all depths before and after the crop in seasons 1 and 2 under IT1 and IT2, respectively, remained unchanged at the wetted zone and wetted periphery. This was due to the buffering property of the soil in nature. Hence, as shown in Table 3, the pH value of the soil remained under the safe limit.
Table 4 reveals that before the start of the study and after harvesting of the crop in seasons 1 and 2, likewise pH, the SAR values at the wetted zone and wetted periphery underneath the drip system of irrigation for IT1 and IT2 remained unchanged. Since the SAR values were below 7.0 and under safe limits.
Crop yield
The bitter gourd was harvested from both plots on different dates, and at the end of the growing cycle. The descriptive statistics for the crop yield data are summarized in Table 5. It is clear that, on average, the crop yields remained higher under IT1 than IT2 for
Table 2: Effect of fresh and saline water on soil ECe before and after experiment under drip irrigation system (Mean of three Replications).
|
Soil depth (cm) |
ECe(dS.m-) before the experiment |
ECe(dS.m-1) after the experiment season 1 |
ECe(dS.m-1) after the experiment season 2 |
||||||
|
Freshwater (IT1) |
Saline groundwater (IT2) |
Freshwater (IT1) |
Saline groundwater (IT2) |
||||||
|
Mean of two plots |
Wetted Zone |
Wetted Periphery |
Wetted Zone |
Wetted Periphery |
Wetted Zone |
Wetted Periphery |
Wetted Zone |
Wetted Periphery |
|
|
0-15 |
2.8 |
2.4 |
4.1 |
2.6 |
4.6 |
2.6 |
5.1 |
2.8 |
5.6 |
|
15-30 |
2.9 |
2.1 |
4.2 |
3.1 |
4.6 |
3.3 |
5.3 |
3.3 |
5.8 |
|
30-60 |
3.3 |
3.0 |
4.2 |
3.3 |
4.6 |
3.6 |
5.3 |
3.6 |
5.8 |
IT1: Application of freshwater ECiw 0.56 dS.m-1); IT2: Application of saline groundwater ECiw 2.59 dS.m-1).
Table 3: Effect of fresh and saline water on soil pH before and after experiment under drip irrigation system (Mean of three Replications).
|
Soil depth (cm) |
Ph before experiment |
pH after experiment Season 1 |
pH after experiment season 2 |
||||||
|
Freshwater (IT1) |
Saline groundwater (IT2) |
Freshwater (IT1) |
Saline groundwater (IT2) |
||||||
|
Mean of two plots |
Wetted Zone |
Wetted Periphery |
Wetted Zone |
Wetted Periphery |
Wetted Zone |
Wetted Periphery |
Wetted Zone |
Wetted Periphery |
|
|
0-15 |
7.2 |
7.3 |
7.2 |
7.3 |
7.2 |
7.2 |
7.3 |
7.4 |
7.5 |
|
15-30 |
7.3 |
7.2 |
7.3 |
7.2 |
7.1 |
7.3 |
7.2 |
7.3 |
7.4 |
|
30-60 |
7.3 |
7.3 |
7.4 |
7.3 |
7.2 |
7.2 |
7.4 |
7.4 |
7.3 |
IT1: Application of freshwater ECiw 0.56 dS.m-1); IT2: Application of saline groundwater ECiw 2.59 dS.m-1).
Table 4: Effect of fresh and saline water on soil SAR before and after experiment under drip irrigation system (Mean of three Replications).
|
Soil depth (cm) |
SAR before experiment |
SAR after experiment season 1 |
SAR After experiment season 2 |
||||||
|
Freshwater (IT1) |
Saline groundwater (IT2) |
Freshwater (IT1) |
Saline groundwater (IT2) |
||||||
|
Mean of two plots |
Wetted Zone |
Wetted Periphery |
Wetted Zone |
Wetted Periphery |
Wetted Zone |
Wetted Periphery |
Wetted Zone |
Wetted Periphery |
|
|
0-15 |
4.1 |
4.0 |
4.2 |
4.2 |
4.2 |
4.1 |
4.3 |
4.2 |
5.1 |
|
15-30 |
4.3 |
4.3 |
4.4 |
4.2 |
4.3 |
4.3 |
4.6 |
4.4 |
4.9 |
|
30-60 |
4.9 |
5.0 |
4.9 |
4.4 |
4.9 |
4.4 |
4.9 |
4.6 |
4.9 |
IT1: Application of freshwater ECiw 0.56 dS.m-1); IT2: Application of saline ground water ECiw 2.59 dS.m-1).
Table 5: Descriptive statistics with confidence bounds for the crop yield (cy) data for seasons 1 and 2 with IT1 and IT2.
|
Variables |
N |
Mean |
Standard error |
Standard deviation |
95% Confidence bounds |
|
|
Lower |
Upper |
|||||
|
cy_S1_ T1 |
22 |
6.61 |
0.64 |
3.01 |
4.50 |
7.96 |
|
cy_S1_ T2 |
22 |
5.03 |
0.31 |
1.46 |
2.92 |
5.69 |
|
cy_S2_ T1 |
18 |
4.14 |
0.46 |
1.95 |
2.06 |
5.10 |
|
cy_S2_ T2 |
18 |
2.83 |
0.34 |
1.46 |
0.75 |
3.55 |
cy: crop yield; S1: Season1; S2: Season 2.
both seasons. The lesser standard deviations and standard errors reported in Table 5 shows the reliability of the mean values and consistency in the reported data. A 95% confidence intervals for the crop yields show that if the data has to be replicated 100 times again in the future, then for the 95 times the average values will be within the confidence bounds. Both lower and upper confidence bounds, in the average crop yield data for IT1 are higher than IT2.
The crop yield was weighed and recorded on a hectare basis, the amount of water used was calculated on m3.ha-1. as shown in Figure 2. It can be observed from Figure 2 that total yield obtained under IT1 in both seasons were higher whereas, the total water used under each treatment was equal as 13762 m3.ha-1 and 7241.64 m3.ha-1 in season 1 and 2, respectively.
The paired differences, values of t-statistic, degrees of freedom and p-values for the average differences in crop yield are shown in Table 6. It can be observed that all p-values < 0.01 and are statistically significant. In fact, IT1 resulted in higher average crop yield than the IT2 for seasons 1 and 2. At 5 % significance level the crop yield using IT1 and IT2 was not same as shown in Table 7, In fact, IT1 resulted in higher average crop yield than the IT2 for seasons 1 and 2. Therefore, both treatments were effective in season 1 as compared to season 2.
Benefit-cost ratio
The maximum BCR of 1.90 and 1.89 was observed in the IT1 in season 1 and 2, respectively whereas, the minimum BCR of 1.69 and 1.59 was found under IT2 in season 1 and 2, respectively, as shown in Table 8.
In Figure 1, the ECe at the wetted zone ranged from 2.8 to 3.0 dS.m-1 in season 1. This indicated that the soil remained unchanged, i.e., non-saline, whereas, at the wetted periphery, it changed from non-saline to slightly saline at all sampling depths, i.e., ECe > 4.0 dS.m-1 under IT1. Likewise, for IT2 after the end of season 1 in October 2019, EC at the wetted zone, slightly increased, nevertheless the soil remained non-saline. However, at the wetted periphery, the soil became slightly saline having ECe >4.0 dS.m-1. Similarly, the same trend was observed after the completion of season 2 that by using IT1 and IT2 for irrigating the crop, the ECe at the wetted zone remained unaltered, whereas, at the wetted periphery, the ECe increased from non-saline to saline with ECe > 4.0 dS.m-1 as shown in Table 2. Similar results were reported by (Hanson and May, 2011) that the transportation of salt under drip irrigation is an impression of the wetting pattern during irrigation and the consecutive variation of soil moisture content. The rhizospheric environment is considered to be favorable due to the development of the wetting front under drip system for the crop to grow without much ionic and osmotic stress (Jha et al., 2017). The results are also inline with (Kumar et al., 2017) who stated that the irrigation application through drip technology pushed the salts away from the discharge point and ECe of soil at the horizontal distance of 10 cm in the wetted zone.
The application of saline water using the drip irrigation technology resulted in rapid salts accumulation, particularly in the upper soil layer Lei et al. (2003). The crop yield found under IT1 was greater as compared to IT2 because the yield under IT1 (ECiw of 0.56 dS.m-1) was not affected due to freshwater irrigation in season 1 and 2. However, the yield under IT2 (ECiw of 2.56 dS.m-1) was somewhat reduced in comparison with IT1, in both seasons. It is clear that, on average, the crop yields remained higher under IT1 than IT2 for both seasons. The lesser standard deviations and standard errors reported in Table 5 shows the reliability of the mean values and consistency in the reported data. Both lower and upper confidence bounds, in the average crop yield data for IT1 was higher than IT2. The yield reduction in IT2 was attributable to the more vegetative development and salts accumulation in the hot season when it was able to produce more fruit plants. The results were in line with (Jellani et al., 2016) who reported that the lower crop yield might be because of the effect of weather patterns on pollinator activities.
The null hypothesis was set to the case that there was no difference in the average values of these parameters using IT1 and IT2. The significance level was set at 5% (i.e. 95% confidence level). At a 5% level of significance, it was attempted to search for evidence in favor or against the null hypothesis. For the case of all three replications, the paired differences, values of t-statistic, degrees of freedom and p-values for the average differences in crop yield as shown in Table 6. It can be observed that all p-values < 0.01 and are statistically significant. Hence it showed that at 5 % significance level of crop yield using IT1 and IT2 was not the same as shown in Table 7.
The high BCR in IT1 maybe due to the fresh irrigation water used in IT1 in seasons 1 and 2, which produced better fruit size and quality in comparison with IT2. BCR greater than 1.5 can be considered as acceptable reported by (Abraham et al., 2017) during the study
Table 6: T-test for the treatment wise difference in an average crop yield data.
|
Treatment wise differences |
Replication |
Descriptive parameters for Differences |
t |
p-value |
Degrees of freedom |
||||
|
95% Confidence interval of the difference |
|||||||||
|
Mean |
Standard deviation |
Standard error mean |
Lower |
Upper |
|||||
|
(cy_S1_IT1) – (cy_S1_IT2) |
1 |
1.57 |
2.11 |
0.45 |
0.63 |
2.51 |
3.49 |
<0.001* |
21 |
|
2 |
1.54 |
1.23 |
0.26 |
0.99 |
2.09 |
5.85 |
<0.001* |
||
|
3 |
1.97 |
1.03 |
0.21 |
1.51 |
2.42 |
8.97 |
<0.001* |
||
|
(cy_S2_IT1) – (cy_S2_IT2) |
1 |
1.03 |
1.01 |
0.23 |
.53 |
1.54 |
4.35 |
<0.001* |
17 |
|
2 |
1.85 |
1.16 |
0.27 |
1.27 |
2.42 |
6.74 |
<0.001* |
||
|
3 |
1.58 |
0.81 |
0.19 |
1.17 |
1.99 |
8.24 |
<0.001* |
||
Abbreviations:, cy: crop yield, S1: season 1, S2: season 2. IT1: Treatment 1, IT2: Treatment 2, Pair t-test used and * shows p-value < 0.05 and statistically significant.
Table 7: T-test for the season-wise difference in an average crop yield data.
|
Treatment wise differences |
Replication |
Descriptive parameters for differences |
t |
p-value |
Degrees of freedom |
||||
|
95% Confidence interval of the difference |
|||||||||
|
Mean |
Standard Deviation |
Standard error mean |
Lower |
Upper |
|||||
|
(cy_S1_IT1) – (Cy_S2_IT1) |
1 |
2.71 |
2.06 |
0.48 |
1.68 |
3.74 |
5.57 |
<0.001* |
17 |
|
2 |
1.42 |
1.24 |
0.29 |
.80 |
2.04 |
4.84 |
<0.001* |
||
|
3 |
2.04 |
1.26 |
0.29 |
1.41 |
2.67 |
6.86 |
<0.001* |
||
|
(cy_S1_IT2) – (Cy_S2_IT2) |
1 |
2.06 |
1.03 |
0.24 |
1.54 |
2.57 |
8.47 |
<0.001* |
17 |
|
2 |
1.90 |
1.08 |
0.25 |
1.35 |
2.44 |
7.41 |
<0.001* |
||
|
3 |
1.87 |
1.22 |
0.28 |
1.26 |
2.48 |
6.46 |
<0.001* |
||
Abbreviations: cy: crop yield, S1: season 1, S2: season 2. IT1: Treatment 1, IT2: Treatment 2, Pair t-test used and * shows; p-value < 0.05and statistically significant.
Table 8: Economic analysis of bitter-gourd under drip irrigation in seasons 1 and 2.
|
Irrigation treatments |
Total crop yield (kg.ha-1) |
Gross cost ($.ha-1) |
Gross return ($.ha-1) |
Net return ($.ha-1) |
BCR |
|
IT1 (Season 1) |
22,112.4 |
2633.22 |
5008.22 |
2375.00 |
1.90 |
|
IT2 (Season 1) |
16,717.3 |
2633.22 |
4454.78 |
1821.57 |
1.69 |
|
IT1 (Season 2) |
11,337.3 |
1964.05 |
3713.47 |
1749.42 |
1.89 |
|
IT2 (Season 2) |
7764.4 |
1964.05 |
3140.51 |
1176.46 |
1.59 |
on to evaluate the impact of irrigation, fertigation and plastic mulching in bitter gourd variety Preethi at Pathanamthitta, Kerala A highest BCR value found for the drip irrigation system indicated the most profitable irrigation system in terms of net production. By comparing total costs, total production, and total net production of one hectare of seasonal vegetables, drip irrigation with fresh and saline irrigation water was found to be the most beneficial irrigation technology. Parallel trends have been reported in net profit, the benefit-cost ratio of 2.84 under the drip fertigation, and net profit per m3 of water used for sweet pepper (Capsicum annuum L. var. grossum) (Kumari and Kaushal, 2014).
Conclusions and Recommendations
The salts accumulation at the wetted periphery did not affect the crop yield of bitter gourd using the drip irrigation method. The pH and SAR in the soil before and after the experiment in seasons 1 and 2 remained unchanged at the wetted zone and periphery under both irrigation treatments owing to buffering property of the soil in nature. The economic analysis gave positive net returns to investment and was cost-effective for IT1 in season 1 with high crop yield as well as a negative net profit in season 2 due to decreased crop yield of bitter-gourd in season 2. Due to the low production cost and higher sale price, BCR was higher with IT1 over IT2 in seasons 1 and 2.
Acknowledgements
We would like to acknowledge Pakistan Agricultural Research Council (PARC) and Monash University Malaysia for providing research support. We also thank to Pakistan Council for Research in Water Resources (PCRWR) for providing laboratory facilities for soil and water analysis.
Novelty Statement
Freshwater scarcity is a severe problem in semi-arid region of Pakistan and has forced farmers to explore the opportunity of using saline water for agriculture. Due to the low production cost and higher sale price, the benefit cost-ratio was higher under IT1 over IT2 in both seasons. Hence, from the present study, drip irrigation in bitter-gourd crop was found to be an economically feasible technology for maximum net production of vegetable.
Author’s Contribution
Kamran Baksh Soomro: Designed the work, the acquisition, analysis, interpretation of data, writing the manuscript and revised the manuscript.
Sina Alaghmand: Analysis, interpretation of data and revised the manuscript.
Sanyogita Andriyas: Interpretation of data and revision of manuscript.
Muhammad Rehmatullah: Literature search and revision of the manuscript.
Naveedullah: Literature search and statistical analysis.
Amin Talei: Overall writing and revision of the manuscript.
Conflict of interest
The authors have declared no conflict of interest.
References
Abdelkhalik, A., N. Pascual-Seva, I. Nájera, A. Giner, C. Baixauli and B. Pascual. 2019. Yield response of seedless watermelon to different drip irrigation strategies under Mediterranean conditions. Agric. Water Manage., 212: 99-110. https://doi.org/10.1016/j.agwat.2018.08.044
Abraham, R.K., M.P. Sarathi and D.C. Manna. 2017. Yield performance and profitability of bitter gourd cultivation as influenced by drip irrigation, fertigation and plastic mulching. Int. J. Curr. Microbiol. App. Sci., 6(10): 638-645. https://doi.org/10.20546/ijcmas.2017.610.078
Amer, K.H., 2011. Effect of irrigation method and quantity on squash yield and quality. Agric. Water Manage., 98(8): 1197-1206. https://doi.org/10.1016/j.agwat.2011.03.003
Aparicio, J., A.J. Tenza-Abril, M. Borg, J. Galea and L. Candela. 2019. Agricultural irrigation of vine crops from desalinated and brackish groundwater under an economic perspective. A case study in Siġġiewi, Malta. Sci. Total Environ., 650: 734-740. https://doi.org/10.1016/j.scitotenv.2018.09.059
Atif, M. J., H. Ullah, T.N. Khan and N. Saleem. 2016. Research article seedling age impact on growth and yield of bitter gourd Ghulam Jellani Department of Horticultural Research and Development, Directorate of Vegetable, National Agricultural Research Centre, Islamabad, Pakistan: Science, v. 35, no. 2.
Ayeni, A.O., M.A. Cho, R. Mathieu and J.O. Adegoke. 2016. The local experts’ perception of environmental change and its impacts on surface water in Southwestern Nigeria. Environ. Develop. 17: 33-47.
Bauder, T., R. Waskom and J. Davis. 2007. Irrigation water quality criteria. Colorado State University: US Department of Agriculture.
Bell, A.R., P. Ward, M. Ashfaq and S. Davies. 2017. Can agricultural aspirations influence preferences for new technologies? Cropping systems and preferences for high-efficiency irrigation in Punjab, Pakistan.
Dalamu, B.T., A. Gaikwad, S. Swati, C. Bharadwaj and A. Munshi. 2012. Morphological and molecular analyses define the genetic diversity of Asian bitter gourd: Momordica charantia. Austral. J. Crop Sci. 6(2): 261-267.
de Bont, C., H.C. Komakech and G.J. Veldwisch. 2019. Neither modern nor traditional: Farmer-led irrigation development in Kilimanjaro Region, Tanzania. World Dev., 116: 15-27. https://doi.org/10.1016/j.worlddev.2018.11.018
Geerts, S. and D. Raes. 2009. Deficit irrigation as an on-farm strategy to maximize crop water productivity in dry areas. Agric. Water Manage., 96(9): 1275-1284. https://doi.org/10.1016/j.agwat.2009.04.009
Gittinger, J.P., 1982. Economic analysis of agricultural projects: John Hopkins University Press.
Hanson, B. and D. May. 2011. Drip irrigation salinity management for row crops: UCANR Publications. https://doi.org/10.3733/ucanr.8447
Hasegawa, P.M., R.A. Bressan, J.K. Zhu and H.J. Bohnert. 2000. Plant cellular and molecular responses to high salinity: Ann. Rev. Plant Biol., 51(1): 463-499. https://doi.org/10.1146/annurev.arplant.51.1.463
Heiser, C.B., 2016. The gourd book: University of Oklahoma Press.
Hirpara, A.J., M. Vaddoria and A.M. Polara. 2015. Effects of plant growth regulators on flowering, fruiting and fruit yield in bitter gourd (Momordica charantia L.). J. Pure Appl. Microbiol., 9: 3099-3103.
Hoekstra, A.Y., M.M. Mekonnen, A.K. Chapagain, R.E. Mathews and B.D. Richter. 2012. Global monthly water scarcity: Blue water footprints versus blue water availability. PLoS One, 7(2): e32688. https://doi.org/10.1371/journal.pone.0032688
Howell, T.A., 2001. Enhancing water use efficiency in irrigated agriculture. Agron. J., 93(2): 281-289. https://doi.org/10.2134/agronj2001.932281x
Igbadun, H.E., B.A. Salim, A.K. Tarimo and H.F. Mahoo. 2008. Effects of deficit irrigation scheduling on yields and soil water balance of irrigated maize. Irrig. Sci., 27(1): 11-23. https://doi.org/10.1007/s00271-008-0117-0
Irshad, M., A.E. Eneji, R.A. Khattak and A. Khan. 2009. Influence of nitrogen and saline water on the growth and partitioning of mineral content in maize. J. Plant Nutr., 32(3): 458-469. https://doi.org/10.1080/01904160802660768
Jellani, G., M.J. Atif, H. Ullah, T.N. Khan and N. Saleem. 2016. Seedling age impact on growth and yield of bitter gourd. Science, 35(2): 94-97. https://doi.org/10.3923/std.2016.94.97
Jha, G., O. Choudhary and R. Sharda. 2017. Comparative effects of saline water on yield and quality of potato under drip and furrow irrigation. Cogent Food Agric., 3(1): 1369345. https://doi.org/10.1080/23311932.2017.1369345
Jodder, R., A.M. Haque, T. Kumar, M. Jahiruddin, M.Z. Rahman and D. Clarke. 2016. Climate change effects and adaptation measures for crop production in south west coast of Bangladesh. Res. Argric. Livest. Fish., 3(3): 369-378. https://doi.org/10.3329/ralf.v3i3.30727
Jones, H.G., 2004. Irrigation scheduling: Advantages and pitfalls of plant-based methods. J. Exp. Bot., 55(407): 2427-2436. https://doi.org/10.1093/jxb/erh213
Kang, S., X. Hao, T. Du, L. Tong, X. Su, H. Lu and R. Ding. 2017. Improving agricultural water productivity to ensure food security in China under changing environment: From research to practice. Agric. Water Manage., 179: 5-17. https://doi.org/10.1016/j.agwat.2016.05.007
Kargas, G., P. Mougiou, A. Petsetidi and P. Kerkides. 2017. Soil water electrical conductivity determination based on the salinity index concept.
Kumar, N., R. Jhorar, S. Kumar, R. Yadav, R. Prakash and A. Singh. 2017. Effect of fertigation on nitrogen use efficiency and productivity of tomato utilizing saline water through drip irrigation. J. Soil Salinity Water Qual., 9(2): 205-212.
Kumar, P., A. Sarangi, D. Singh, S. Parihar and R. Sahoo. 2015. Simulation of salt dynamics in the root zone and yield of wheat crop under irrigated saline regimes using SWAP model. Agric. Water Manage., 148: 72-83. https://doi.org/10.1016/j.agwat.2014.09.014
Kumari, R. and A. Kaushal. 2014. Drip fertigation in sweet pepper: A review. Int. J. Eng. Res. Appl., 4(8): 144-149.
Kuwornu, J.K., A.A. Nafeo and Y.B. Osei-Asare. 2013. Economic viability, value addition and constraint analyses of certified organic pineapple production and marketing in Ghana. Afr. J. Basic Appl. Sci., 5(1): 12-24.
Laboratory, R.S., 1954. Diagnosis and improvement of saline and alkali soils: US Govt. Print. Off.
Lei, T., J. Xiao, J. Wang, Z. Liu, G. Li, J. Zhang and J. Mao. 2003. Experimental investigation into effects of drip irrigation with saline ground water on water use efficiency and quality of honeydew melons in Hetao Region Inner Mongolia. Trans. Chinese Soc. Agric. Eng., 19: 80-84.
Lim, T., 1998. Loofahs, gourds, melons and snake beans: The new rural industries. Ed. KW Hyde. Canberra, Rural Industries Research and Development Corporation, p. 212-218.
Maliva, R.G., 2014. Economics of managed aquifer recharge. Water, 6(5): 1257-1279. https://doi.org/10.3390/w6051257
Mekonnen, M.M. and A.Y. Hoekstra. 2016. Four billion people facing severe water scarcity. Sci. Adv., 2(2): e1500323. scarcity. Science advances, 2(2), e1500323.
https://doi.org/10.1126/sciadv.1500323
Milind, P. and K. Satbir. 2011. Is bottle gourd a natural guard. Int. Res. J. Pharm., 2(6): 13-17.
Nouri, H., B. Stokvis, A. Galindo, M. Blatchford and A.Y. Hoekstra. 2019. Water scarcity alleviation through water footprint reduction in agriculture: The effect of soil mulching and drip irrigation. Sci. Total Environ., 653: 241-252. https://doi.org/10.1016/j.scitotenv.2018.10.311
Pandey, S., S. Kumar, M. Rai, U. Mishra and M. Singh. 2008. Assessment of genetic diversity in Indian ash gourd (Benincasa hispida) accessions using RAPD markers. Cucurbitaceae 2005. Paper presented at the Proceedings of the IXth EUCARPIA meeting on genetics and breeding of Cucurbitaceae. Pitrat M, INRA, Avignon (France). https://doi.org/10.1016/j.scienta.2008.05.031
PMD, 2017. Climate Data Processing Centre (CDPC). Retrieved from http://www.pmd.gov.pk/cdpc/extrems/KARACHI.htm
Richards, L., 1954. Diagnosis and improvement of saline and alkali soils. Washington: United States Salinity Laboratory, 1954. USDA. Agriculture Handbook, 60. pp. 160.
Rowell, D., 1994. The preparation of saturation extracts and the analysis of soil salinity and sodicity. Soil science methods and applications. Rowell, DL (Ed.), Longman Group., UK.
Sam-Amoah, L., R. Darko and J. Owusu-Sekyere. 2013. Water requirement, deficit irrigation and crop coefficients of hot pepper (Capsicum frutescens var legon 18) using irrigation interval of two days. ARPN J. Agric. Biol. Sci., 8(2): 139-146.
Siamak, G. and S. Srikantaswamy. 2008. Assessment of seasonal variation and drinking water quality in Mysore city. Asian J. Environ. Sci., 3: 104-110.
van Steenbergen, F., M. Basharat and B.K. Lashari. 2015. Key challenges and opportunities for conjunctive management of surface and groundwater in mega-irrigation systems: Lower Indus, Pakistan. Resources, 4(4): 831-856. https://doi.org/10.3390/resources4040831
Yuan, C., S. Feng, Z. Huo and Q. Ji. 2019. Effects of deficit irrigation with saline water on soil water-salt distribution and water use efficiency of maize for seed production in arid Northwest China. Agric. Water Manage., 212: 424-432. https://doi.org/10.1016/j.agwat.2018.09.019
Zhang, B., M. Li, Q. Li, J. Cao, C.Zhang, F. Zhang, Z. Song and X. Chen. 2018. Accumulation and distribution characteristics of biomass and nitrogen in bitter gourd (Momordica charantia L.) under different fertilization strategies. J. Sci. Food Agric., 98: 2681-2688.
To share on other social networks, click on any share button. What are these?


