
Risk Mitigation of E. coli O157 and its Intimin (eaeA) and Shiga Toxin (stx2) Gene Expression in Chilled Chicken Fillets Using Chitosan Nanoparticle Loaded with Lysozyme


Risk Mitigation of E. coli O157 and its Intimin (eaeA) and Shiga Toxin (stx2) Gene Expression in Chilled Chicken Fillets Using Chitosan Nanoparticle Loaded with Lysozyme
Aalaa S. Saad1*, Amira A. Elokle2, Dalia Y. Youssef2, Neven M. Omara2, Samr Kassem3

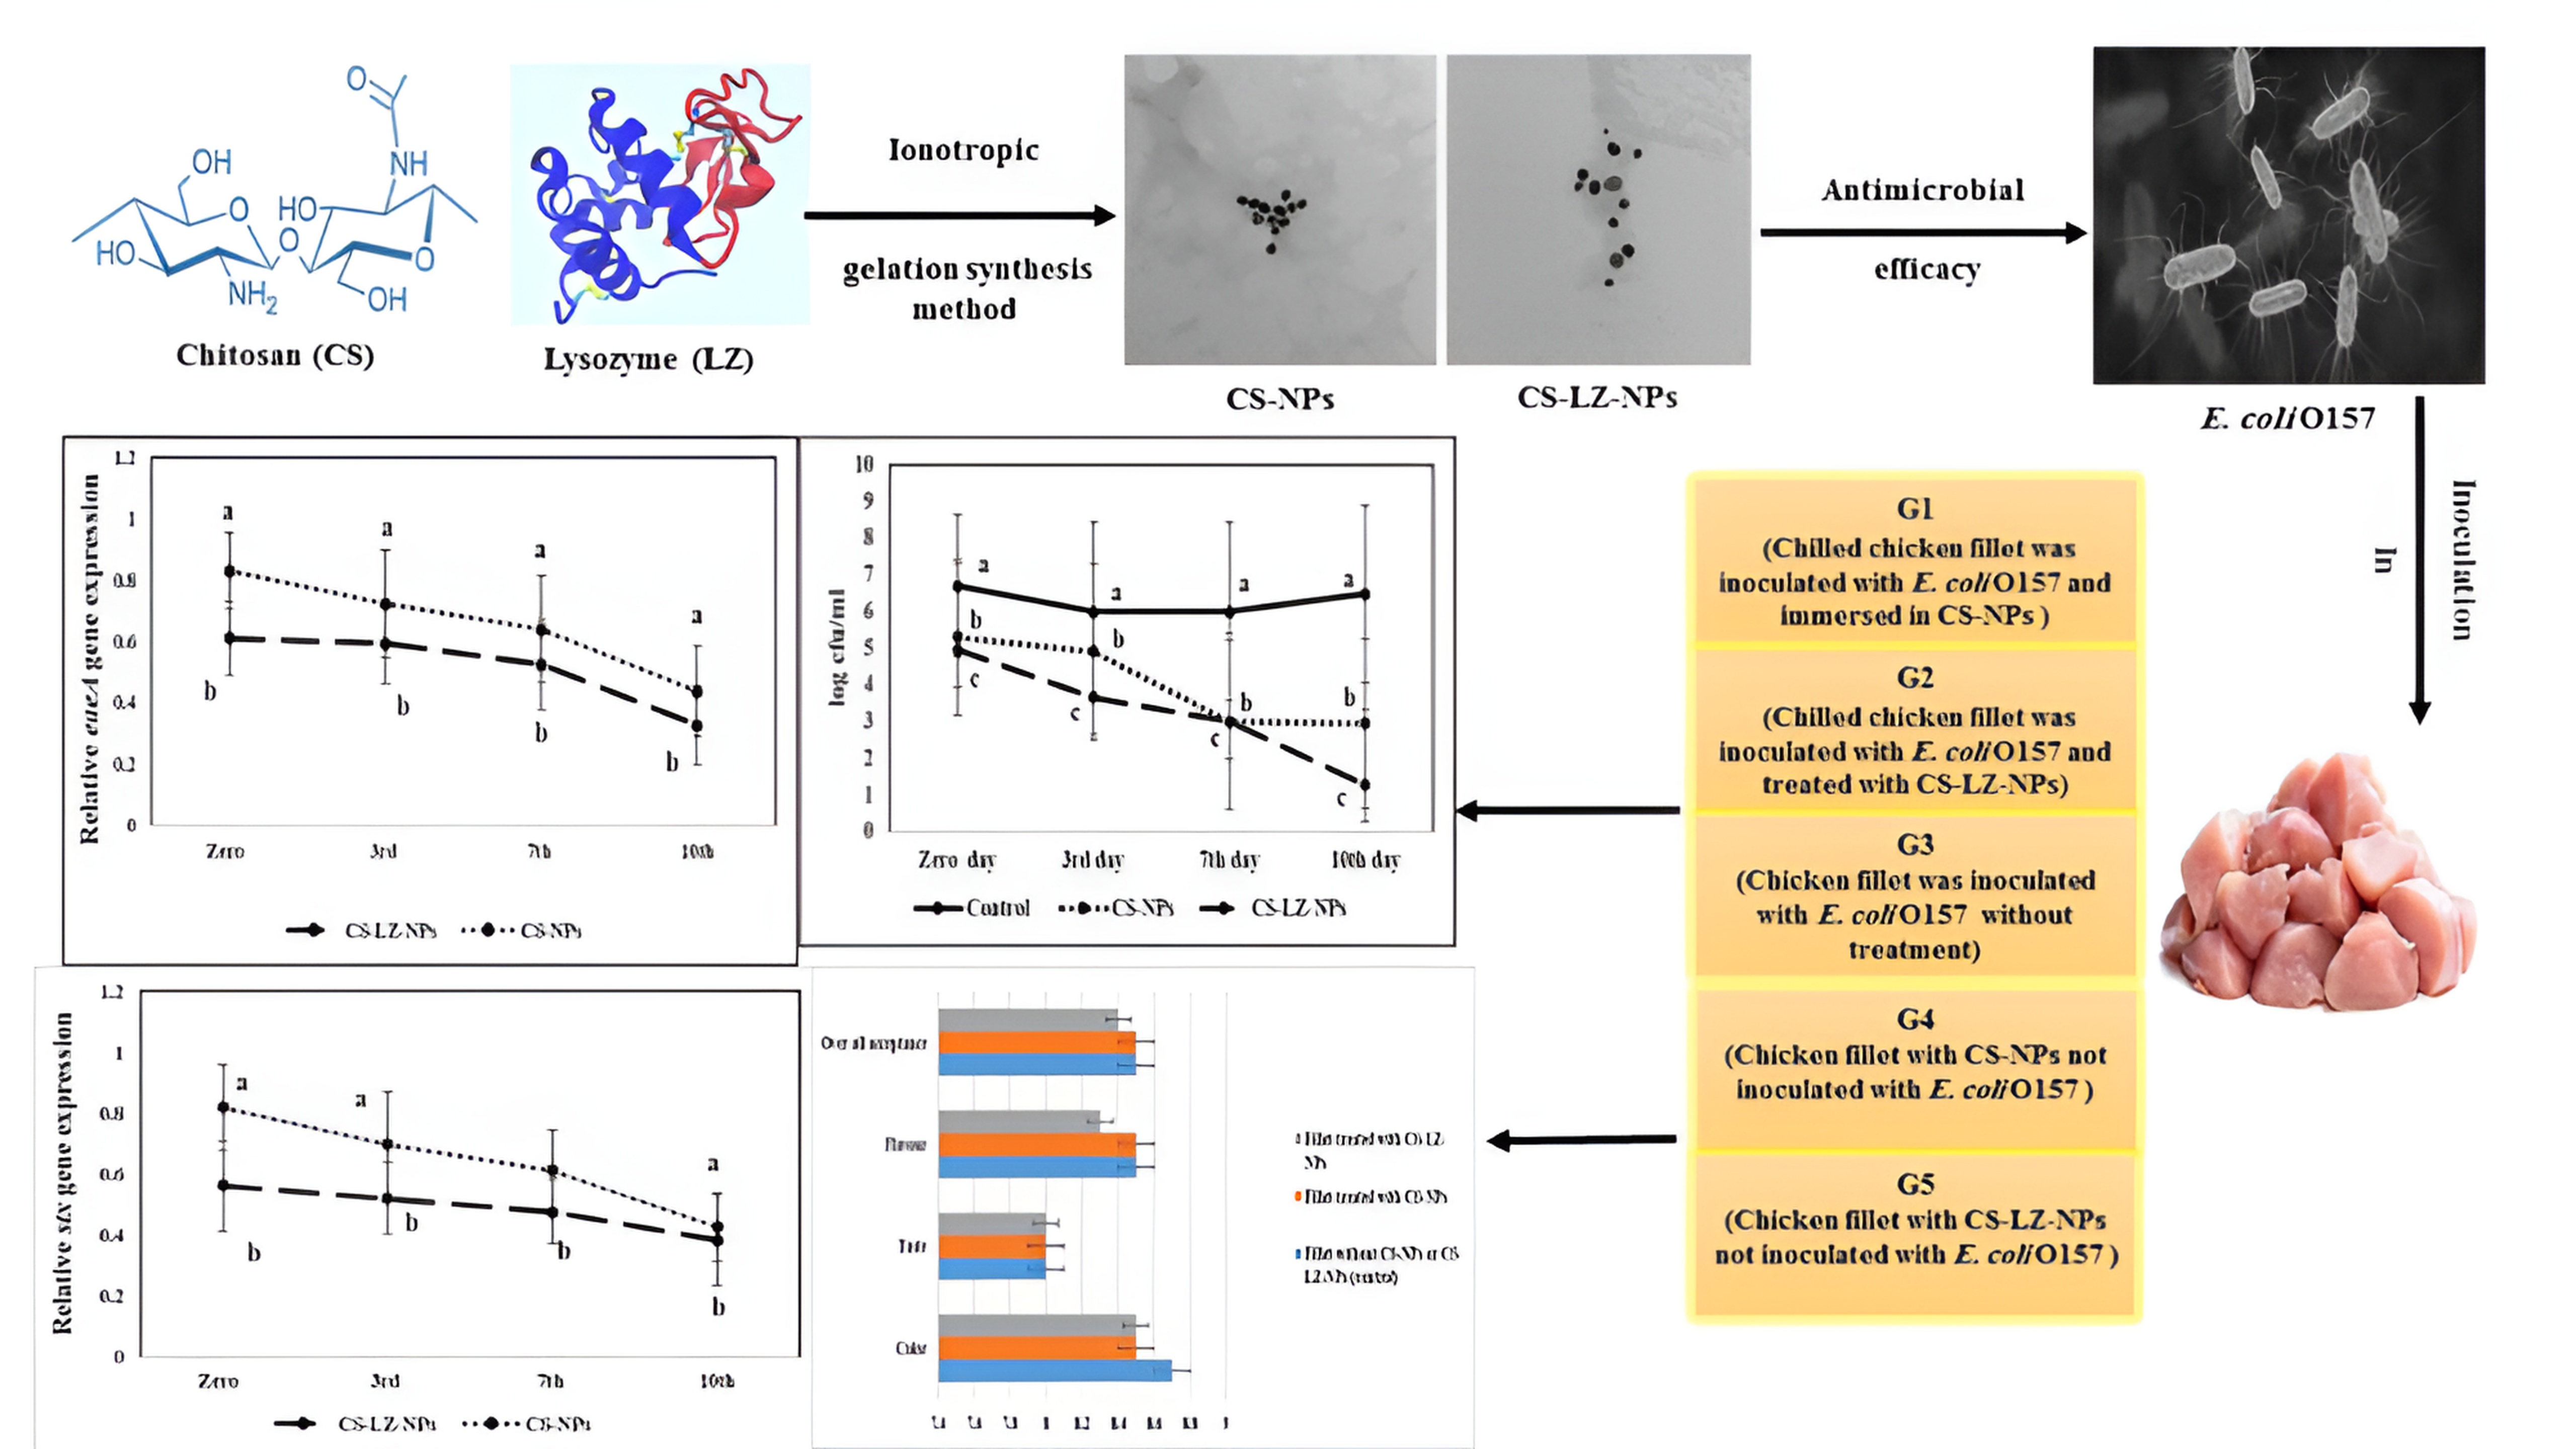
Schematic illustration of the Experimental design.

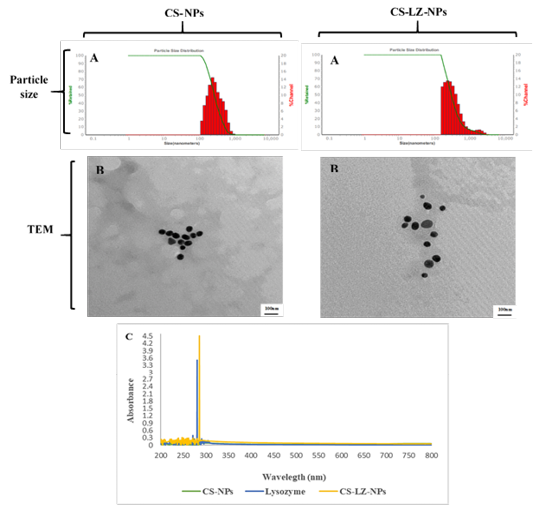
Characterization of blank CS-NPs and CS-LZ-NPs. (A1 and A2) particle size pattern of synthesized NPs showing (A1) size distribution of CS-NPs of 250 nm, (A2) size distribution of CS-LZ-NPs of 281 nm. (B1 and B2) TEM imaging of blank CS-NPs (B1) and CS-LZ-NPs (B2) showed consistent solid spherical nanoparticles without agglomeration and size ranged from 13.1 to 17.6 nm and 15.6 to 19.5 nm, Scale bar = 100 nm. (C) UV analyses of synthesized chitosan, chitosan lysozyme nanoparticles and lysozyme at wavelength range of 200-800 nm.

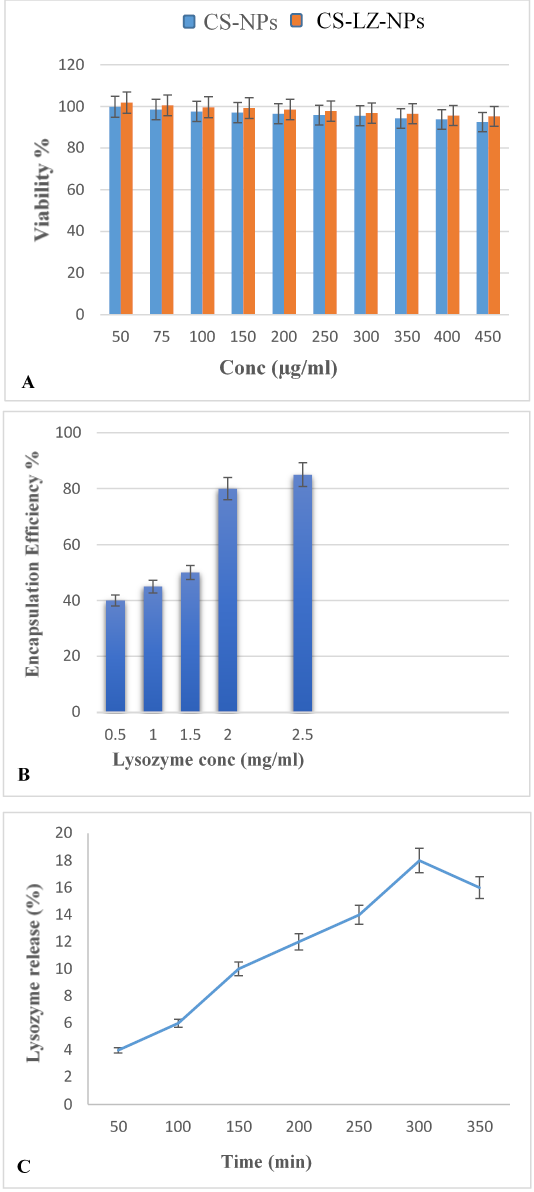
(A) SRB cytotoxicity assay of blank CS-NPs and CS-LZ-NPs at different concentrations ranged from 50 to 450 µg/ml. (B) Encapsulation efficiency percent of CS-LZ-NPs at pH 4 with different concentration of lysozyme (0.5, 1, 1.5, 2 and 2.5 mg/ml). (C) In vitro release study of CS-LZ-NPs with lysozyme concentration of 2.5 mg/ml prepared at pH 4.

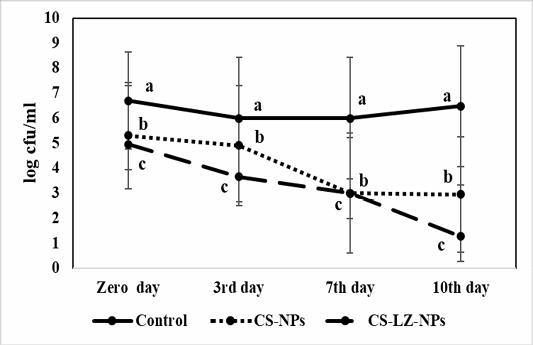
E. coli O157 viable count (log CFU/g) of chicken fillet treated with CS-NPs and CS-LZ-NPs and the control (untreated) at chilling preservation. Values are expressed as the mean ±SD. There are significant differences between points that have different letters on the same day of preservation.

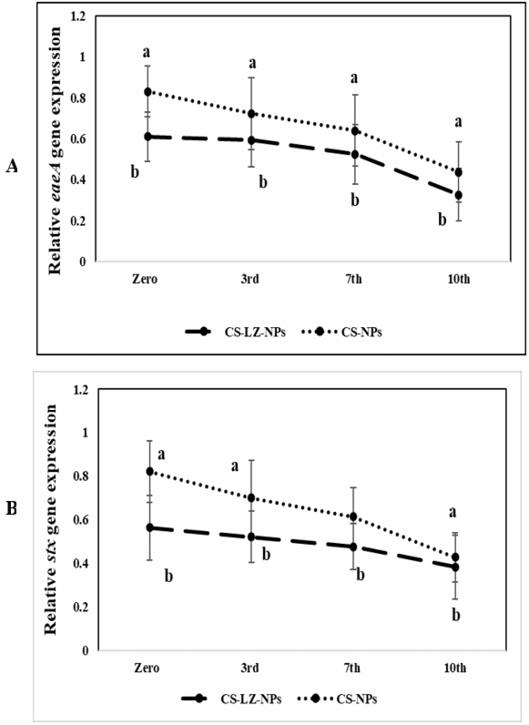
(A). Relative eaeA gene expression of E. coli O157 in chicken fillet treated with CS-NPs and CS-LZ-NPs at chilling preservation. Values are expressed as the mean ±SD. There are significant differences between points that have different letters on the same day of preservation. (B). Relative stx gene expression of E. coli O157 in chicken fillet treated with CS-NPs and CS- LZ-NPs at chilling preservation. Values are expressed as the mean ±SD. There are significant differences between points that have different letters on the same day of preservation
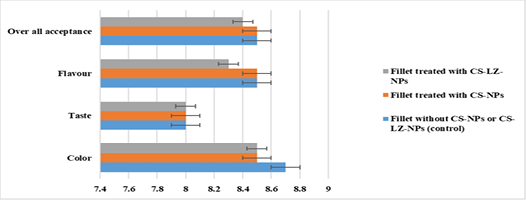
The average score of taste, color, flavor, and overall acceptability of chicken fillets without CS-NPs and or CS-LZ-NPs, chicken fillets with CS-NPs, and chicken fillets with CS- LZ-NPs.

