

Regulation of Visual Sensitivity Responses in Locusts Stimulated by Different Spectral Lights


Regulation of Visual Sensitivity Responses in Locusts Stimulated by Different Spectral Lights
Qihang Liu1,2, Yueli Jiang1, Jin Miao1, Zhongjun Gong1, Tong Li1, Yun Duan1 and Yuqing Wu1*

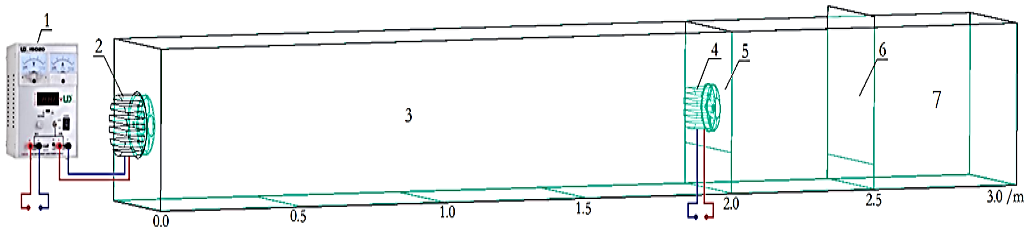
Experimental device of locusts visual sensitivity response to different spectral light after illuminated by orange light. (1. DC adjustable steady voltage supply; 2. LED light source 1; 3. Locusts visual sensitivity response channel; 4. LED orange light source; 5. Gate 1; 6. Gate 2; 7. Locust reaction chamber.)

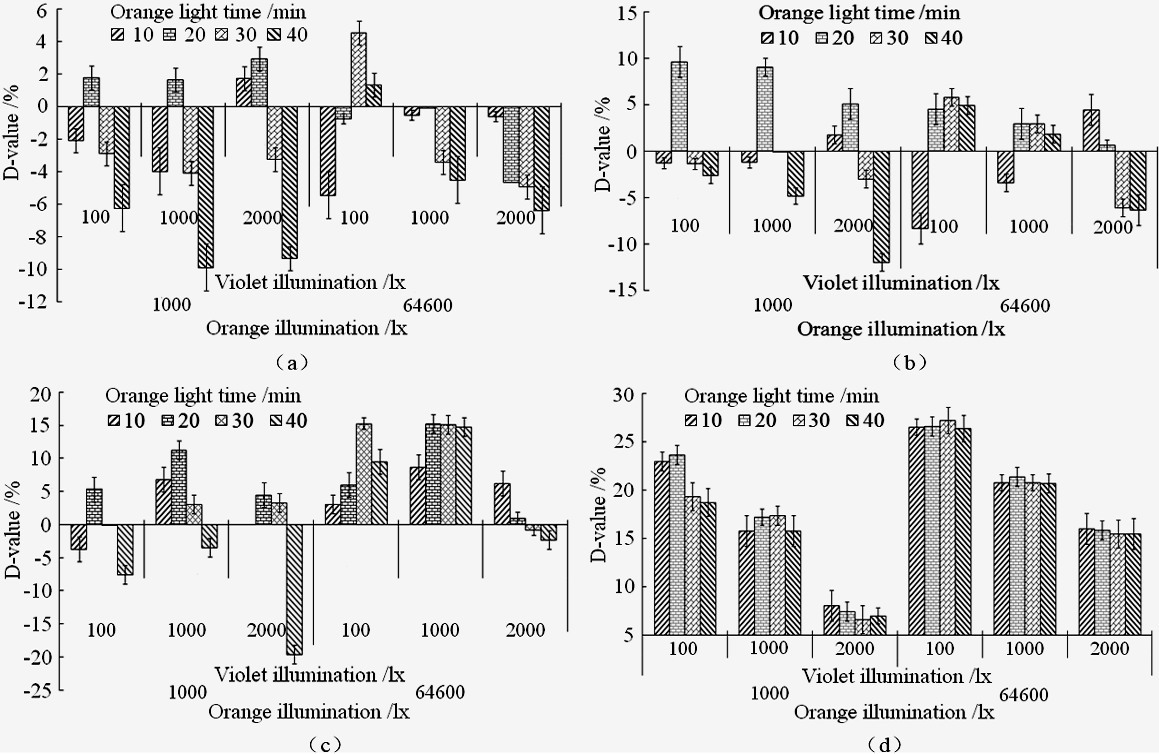
Comparative results of locusts visual response to 100-2000 lx violet light between after 1000-64600 lx orange light stimulation and no orange light. (a) D-value at 0-0.5 m, (b) D-value at 0-1.0 m, (c) D-value at 0-1.0 m, (d) D-value at 0-1.5 m.
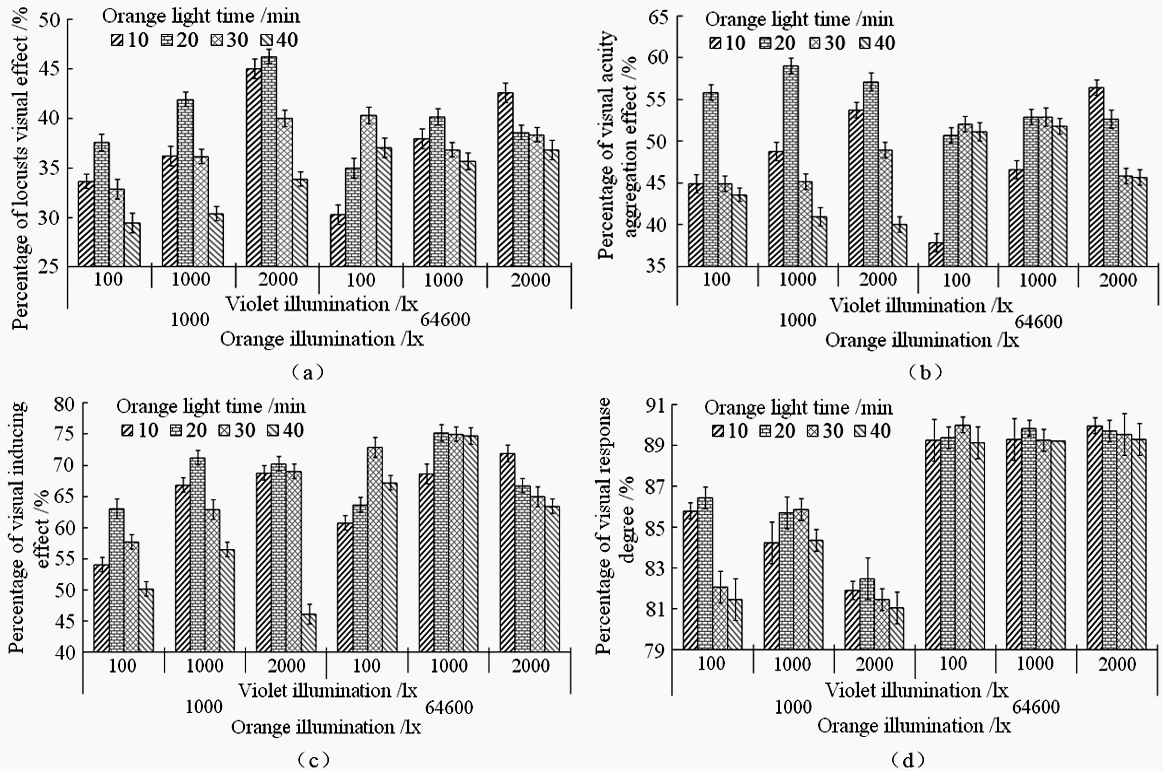
Results of locusts visual sensitivity response to 100-2000 lx violet light after 1000-64600 lx orange light stimulation.(a) Visual trending intensity at 0-0.5 m, (b) Visual acuity aggregation effect at 0-1.0 m, (c) Visual inducing effect at 0-1.5 m, (d) visual response degree at 0-2.0 m.

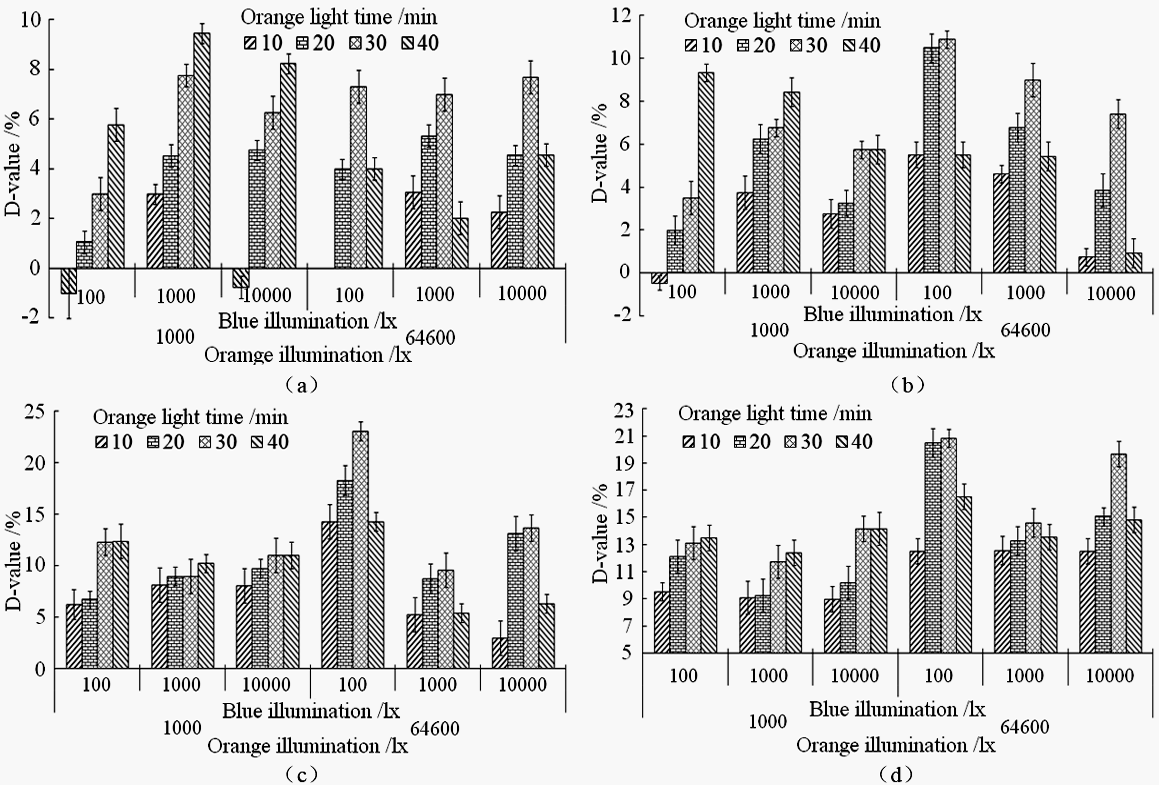
Comparative results of locusts visual response to 100-10000 lx blue light between after 1000-64600 lx orange light stimulation and no orange light. (a) D-value at 0-0.5 m, (b) D-value at 0-1.0 m, (c) D-value at 0-1.0 m, (d) D-value at 0-1.5 m.

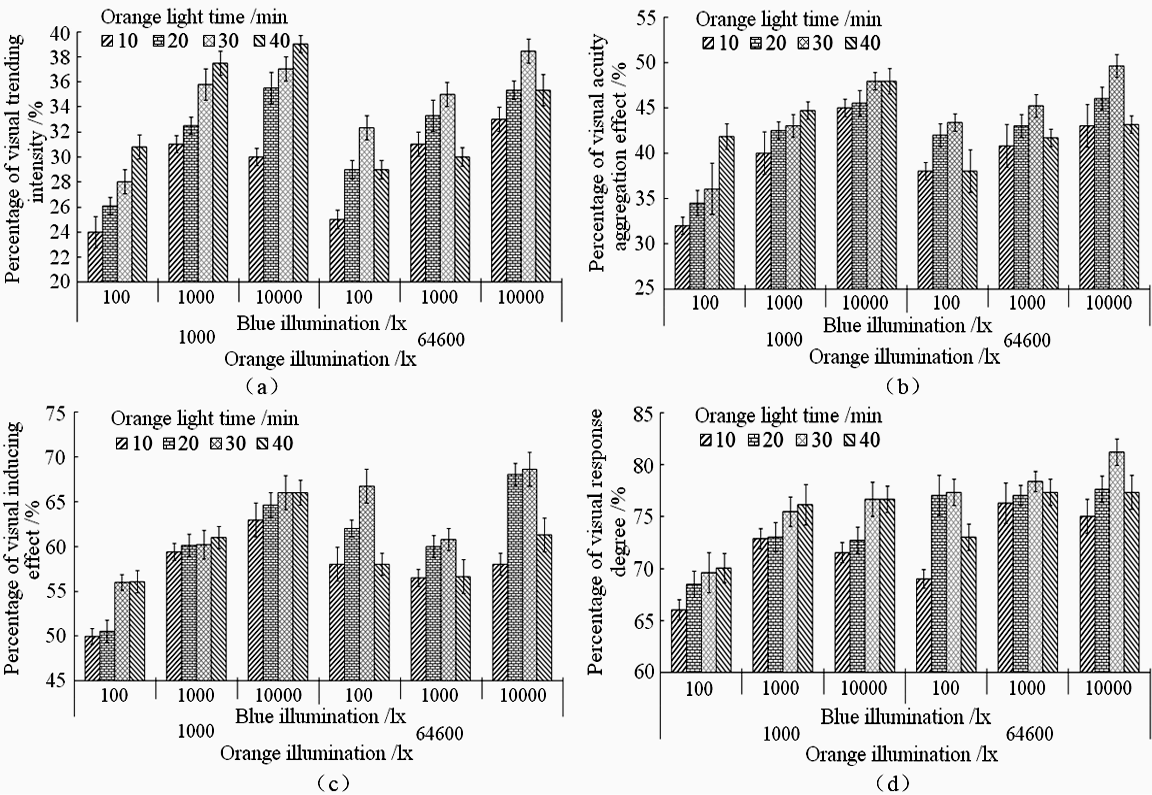
Results of locusts visual sensitivity response to 100-10000 lx blue light after 1000-64600 lx orange light stimulation. (a) Visual trending intensity at 0-0.5 m, (b) Visual acuity aggregation effect at 0-1.0 m, (c) Visual inducing effect at 0-1.5 m, (d) visual response degree at 0-2.0 m.

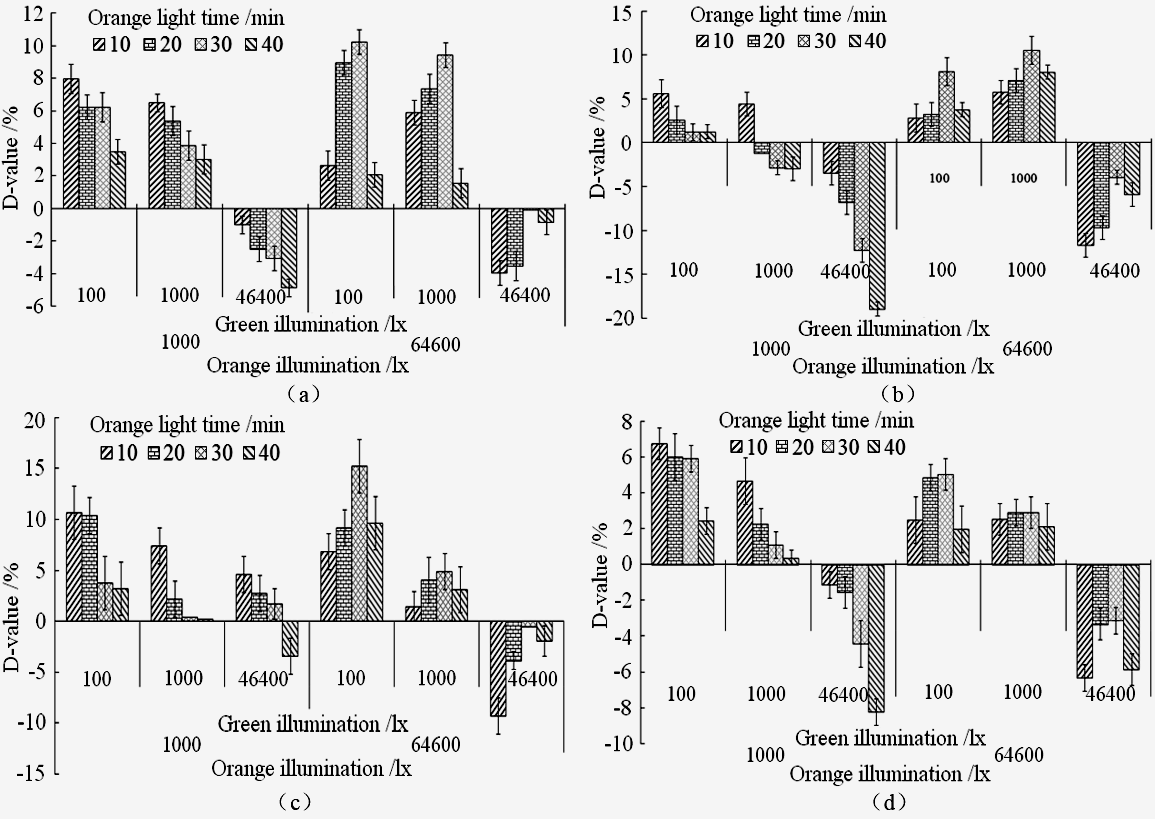
Comparative results of locusts visual response to 100-46400 lx green light between after 1000-64600 lx orange light stimulation and no orange light. (a) D-value at 0-0.5 m, (b) D-value at 0-1.0 m, (c) D-value at 0-1.0 m, (d) D-value at 0-1.5 m.
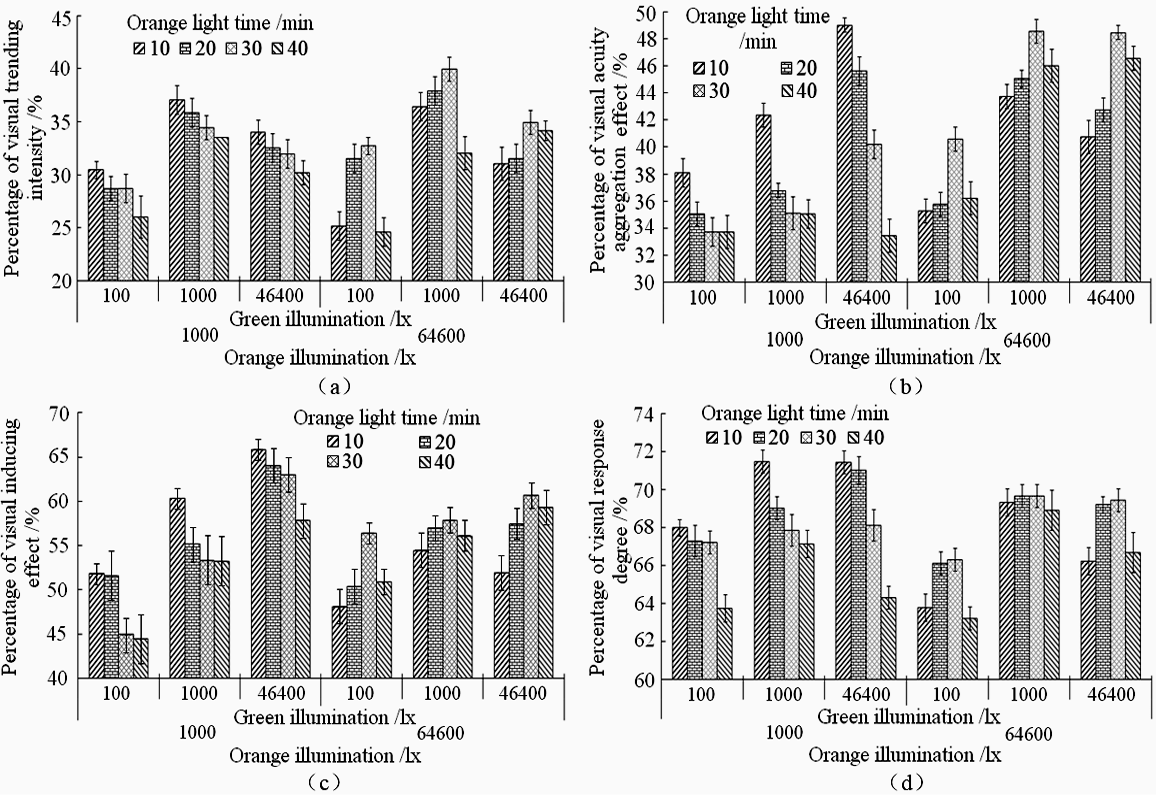
Results of locusts visual sensitivity response to 100-46400 lx green light after 1000-64600 lx orange light stimulation. (a) Visual trending intensity at 0-0.5 m, (b) Visual acuity aggregation effect at 0-1.0 m, (c) Visual inducing effect at 0-1.5 m, (d) visual response degree at 0-2.0 m.


