Population Dynamics and Damage Threshold of Meloidogyne incognita to the Dinsire Hot Pepper Variety
Population Dynamics and Damage Threshold of Meloidogyne incognita to the Dinsire Hot Pepper Variety
Shiferaw Demissie Tola1, Diriba Muleta2, Fassil Assefa2 and Beira Hailu Meressa1*
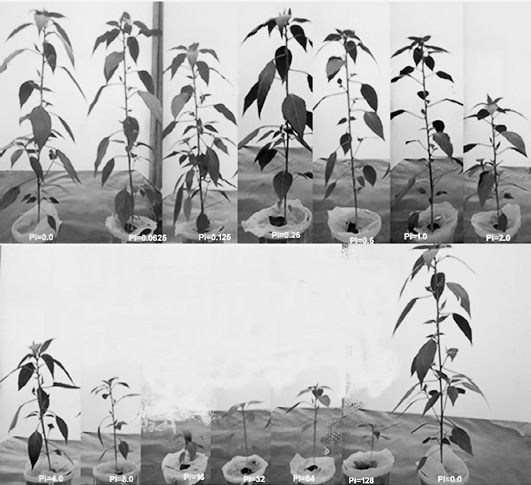
Effect of increasing initial population densities (0 – 128 J2 (g soil)-1) of Meloidogyne incognita on the growth performance of the hot pepper (var. Dinsire). Images were taken 45 days after nematode inoculation.
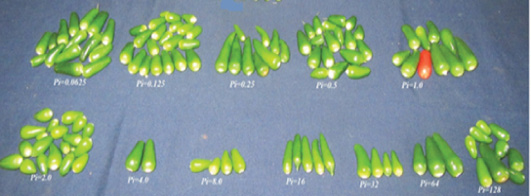
Impact of Pi of Meloidogyne incognita initial population on the fruit development of Dinsire.
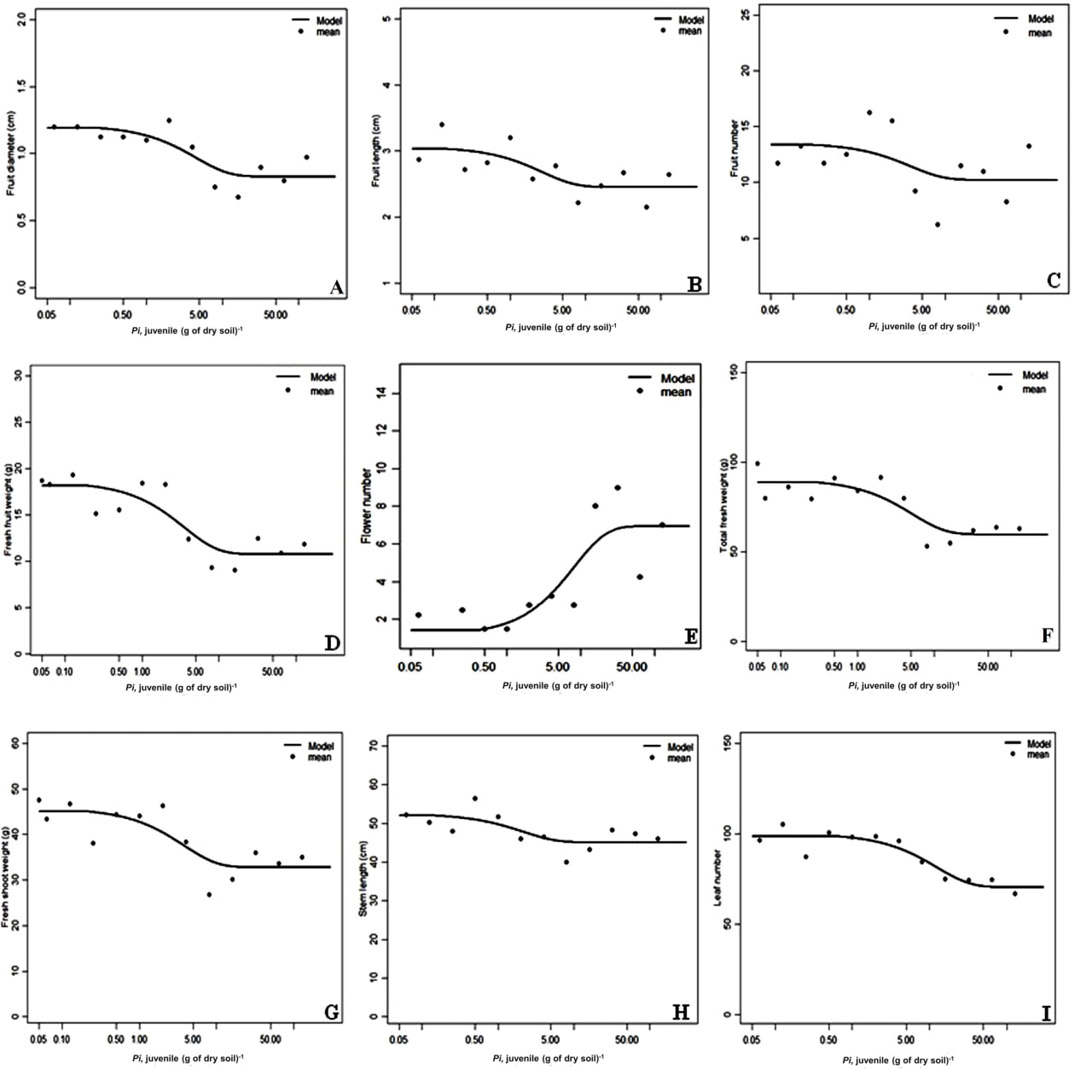
The relation between the initial population density (Pi) of Meloidogyne incognita (plotted on a log scale) and mean of fruit diameter (A), fruit length (B), fruit number (C), fresh fruit weight (D), flower number (E), total fresh weight (F), fresh shoot weight (G), stem length (H), and leaf number(I). Dinsire was harvested after 120 days of inoculation, and each point represents a mean of 4 plants(replication), and the line is the predicted function obtained by fitting the Seinhorst yield loss model y= Ymax * (m+(1-m)*0.95((Pi/T)-1)) for Pi > y= 1 for Pi< T to the data.
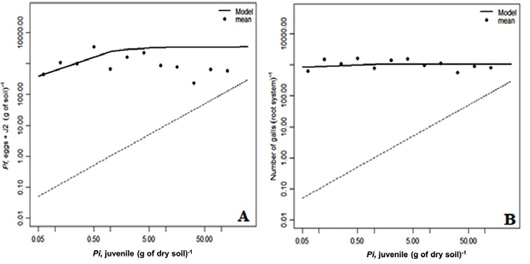
The relation between initial (Pi) and final (Pf) population densities of M. incognita (on a log scale) on Dinsire. Solid line fitted to the equation of Pf = M*Pi/ (Pi + M/a) population dynamics (Teklu et al. 2014). Straight diagonal dashed line: population equilibrium line: Pf = Pi, (A) and the relationship of nematode initial inoculums and the number of galls per pepper root system (B).
Relation of M. incognita initial population with its final population densities and reduction (%) of pepper growth and yield component.


