
Phenotype Character of The First Generation (G1) Results of Crossing Elba Chicken With Ternate Village Chicken to Improve The Quality of Local Chicken


Research Article
Phenotype Character of The First Generation (G1) Results of Crossing Elba Chicken With Ternate Village Chicken to Improve The Quality of Local Chicken
Sariffudin Fatmona*, Abdurahman Hoda, Sri Utami
Faculty of Agriculture, Universitas Khairun Jalan H. Yusuf Abdul, Kampus 2 Universitas Khairun, Gambesi, South Ternate, North Maluku, Indonesia.
Abstract | This research aims to form a new family of superior local chickens typical of Ternate City. This research was carried out by crossing chickens resulting from crossing (F1) Elba laying hens with male Bangkok RB chickens with chickens resulting from crossing (F1) Bangkok and female BK Kampung reciprocally. Chickens resulting from this cross are placed in colonies based on age and gender. The parameters measured are the phenotypic characters of the cross. Then the data was analyzed using the variance test. The results showed that body weight, Shank Circumference, Shank Length, Comb Height, Beak Length, and Pubic Bone Width had significant differences (P<0.05) in size. First-generation crossbreed chickens (G1) have varying male feather colors while the female’s color is predominantly gray. The male’s comb is shaped like a canary and a pea, while the female’s comb is mostly the shape of a canary. The main component variable in G1 chickens is the length of the tibia bone. Cluster analysis based on morphometrics contained three clusters: the first cluster was dominated by G1 chickens, the second cluster contained the third group of chicken types, and the third cluster was dominated by Ternate chickens.
Keywords | Phenotype, Elba Chicken Quality, Local.
Received | March 08, 2024; Accepted | April 10, 2024; Published | June 05, 2024
*Correspondence | Sariffudin Fatmona, Faculty of Agriculture, Universitas Khairun Jalan H. Yusuf Abdul, Kampus 2 Universitas Khairun, Gambesi, South Ternate, North Maluku, Indonesia; Email: sariffudinunkhair2002@gmail.com
Citation | Fatmona S, Hoda A, Utami S (2024). Phenotype character of the first generation (G1) results of crossing elba chicken with ternate village chicken to improve the quality of local chicken. Adv. Anim. Vet. Sci. 12(8): 1410-1421.
DOI | http://dx.doi.org/10.17582/journal.aavs/2024/12.8.1410.1421
ISSN (Online) | 2307-8316

Copyright: 2024 by the authors. Licensee ResearchersLinks Ltd, England, UK.
This article is an open access article distributed under the terms and conditions of the Creative Commons Attribution (CC BY) license (https://creativecommons.org/licenses/by/4.0/).
Introduction
Local chickens are a source of income for both urban and rural communities, although on a small scale, generally, every farmer/breeder household raises this type of chicken. (Silondae et al., 2022). Local chickens are a source of income for urban and rural communities in Ternate City. Even though it is on a small scale, generally every farmer/breeder household keeps this type of chicken, because young village chickens are kept by everyone, these livestock easily adapt to the local environment, they find their meat tastier and they do not use chemicals in their rearing.
However, the fundamental problem is that the productivity of meat and eggs from local chickens is very low. The main factor that influences the low productivity of local chickens are genetic factors and other factors such as poor feeding management and maintenance systems, where up to now the maintenance system is still inadequate traditional, namely a small number of livestock, providing minimal feed and not considering quantity and quality.
Apart from that, purebred chickens and Elba chickens have advantages in both egg and meat production, therefore, to answer the problem of local chickens, it is necessary to select and cross breed them with Elba chickens and purebred chickens, so that in the future new breeds of chicken will be produced. superior race based on breeding purposes.
This research aims to cross and select local chickens to form a new family of local Ternate chickens that have superior productivity.
Phenotypic characteristics are characteristics and conditions of local chickens that need to be known because they are markers of the development of each chicken which are useful in selecting and multiplying local Ternate chickens for maintenance purposes.
Morphometry is concerned with the analysis of variations in shape between a sample of a population and various populations. Morphometry is in many cases used to address various concerns about morphological development and species diversity by concentrating on different segregation cycles or estimating morphological variation.
This research specifies that by comparing the phenotypic characteristics of cross-bred chickens (G1), Elba chickens, and local Ternate chickens, it is possible to determine phenotypic characters and productivity so that it is easy to select superior traits from local Ternate chickens for breeding programs.
Previous research with the topic “Local Community Knowledge About the Productivity and Phenotypic Diversity of Chickens (Gallus gallus domesticus) as an Effort to Support Food Security in the Community of Ternate City”, but this previous research only discussed in general the phenotypic characteristics of free-range chickens in Ternate City without treatment and compare them with other superior types of chicken.
The local system of raising chickens is that they are free to roam, generally, they are not kept intensively in cages, they are allowed to roam freely in yards, fields, gardens, and various places around cities or human settlement areas. (Jailani & Grinting, 2024).
Elba chickens are the newest type of village chicken which has several advantages, at the age of 4.5 -5 months they start to learn to lay eggs, do not incubate their eggs, can lay up to 300 eggs per year, egg size is larger than ordinary village chickens, only a small amount of feed is required. 70 grams per head per day so it is very economical.(Jailani & Grinting, 2024).
Efficiency of livestock farming, especially broiler chicken farming, is one type of chicken that is very popular and has the potential to be cultivated, this is because these chickens have higher meat production compared to free-range chickens. (Viastika, 2021).
In urban communities, there is a general preference for local chicken over exotic chicken because it is believed to be tastier and does not contain drug residues (Emuron et al., 2010). From an economic perspective, local chickens are superior to purebred chickens because they have higher selling prices for eggs and meat products. (Najoan et al., 2018).
Apart from that, these chickens are more resistant to disease and have high adaptability to their environment, making farming activities easier. (Siwu et al., 2023). Therefore local chickens have a strategic role in providing food of animal origin. (Silondae et al., 2022). Local chickens have a big influence on the development of the local chicken industry in rural communities (Sumantri et al., 2020).
The provision of food from animal sources to meet the community’s animal protein adequacy, especially in Ternate City, is closely related to the research strategy planning platform launched by Khairun University, namely fulfilling community food security.
However, the problem faced so far is that local chicken development is still not optimal in providing animal-based feed due to low productivity. (Hadi et al., 2021).
In intensive rearing, the average egg production of local chickens generally only reaches 30% (105 eggs/head/year) (Dameanti et al., 2020), Compared to the egg production of purebred chickens which reaches 351 eggs/head/year (Lapihu et al., 2019). Efforts to increase the potential of local chickens require a genetic quality improvement program (Suryadi et al., 2022). in an effort to develop local chicken productivity and can be done through selection and crossing systems. (Ouédraogo et al., 2023). This article examines the Morphometric Characteristics, Quantitative Phenotypic Characteristics, Main Components, and Determination of Morphometric Characters of the first generation (G1) resulting from crossing Elba Chickens with Ternate Village Chickens.
Morphometry relates to the analysis of shape and shape variations between specimens of a population and different populations.(Astuti et al., 2022).
Morphometric science is often used to address various concerns about morphological evolution and species diversity by studying specific differentiation processes or measuring morphological disparities through time and, or space (Sophian et al., 2021).
Qualitative phenotypic characteristics are the color and shape characteristics of local chickens that need to be known because they are markers of the production of each chicken which are useful in selecting and breeding native chickens based on breeding goals (Guisso Taffa et al., 2022).
Principal component analysis (PCA) is a multivariate technique that analyzes data tables in which observations are explained by several quantitative dependent variables that are correlated with each other (Wangge, 2021). The goal of this analysis is to extract important information from statistical data to represent it as a new orthogonal set of variables called principal components, (López del Val & Alonso Pérez de Agreda, 1993), and to display patterns of similarity between observations and variables as points on a spot map. Mathematically, PCA relies on the eigendecomposition of semi-definite, positive matrices and singular value decomposition (SVD) of rectangular matrices (López del Val & Alonso Pérez de Agreda, 1993). Determining clusters based on morphometric characters is a characterization based on similarities in body size between the types of chickens being measured or genetic distance and kinship relationships based on closeness or similarity and using certain methods and tools.
The novelty of this research is producing or finding a new breed of local chicken typical of Ternate City which has high productivity, where so far there has been no specific research regarding the treatment of raising local chickens in this area.
This kind of research is useful for application in other areas so that it can produce superior native chicken productivity not only at the level of adaptation to the environment but also at low productivity. However, it is hoped that it will also produce chickens that have good productivity with high meat and egg production.
MATERIALS AND METHODS
Experiment Location
This research was carried out at the Maquaponik Farm, Gamayou Hamlet, Ternate City District for 6 (six) months from April to September 2022.
Research Materials
This study used 9 roosters and 27 hens, consisting of 3 Bangkok roosters, 3 White Elba roosters, 3 Red Elba roosters and 27 hens (F1), the result of a crossing of Elba roosters with local hens. Roosters of various types are mated using the injecting method with hens (F1). Each group consisted of 1 hen and 3 roosters. The crossbreed chickens of Bangkok rooster x Elba hen, white Elba rooster x local hen, and red rooster x Elba hen were used as research materials. There were 9 chickens from crosses from each replication, so the number of chickens from each treatment was 27.
The use of the ratio of the number of male and female chickens (9:1) refers to the results of previous research with the second best data based on fertility and hatchability by adding the number of females. (Salamony et al., 2019).
The rations used in this study were not given a special treatment; they were factory-made commercial rations. The composition of the rations used can be seen in Table 1.
The roosters used in crosses were given finisher rations of fighting cocks while the hens used were given layer rations. The crossed chicks were given starter rations. The drinking water was provided ad libitum. The composition of the rations can be seen in Table 1.
| Component | Ration Type | ||
| Finisher | Starter | Layer | |
|
Water content (%) Proteins (%)
Fat (%) Fiber (%) Ash (%) Calcium (%) Phosphorus (%) |
max 13.00 max 17.50 - 19.50 min 3.00 max 8.00 max 7.00 min 0.90 min 0.60 |
max 13.00 17.00 18.00
min 3.00 max 6.00 max 12.00 min 3.70 min 0.60 |
max 13.00 21.00 - 23.00 min 5.00 max 5.00 max 7.00 min 0.90 min 0.60 |
Source: PT. Charoen Pokphand Indonesia
Chickens resulting from this cross are housed in colonies, namely cages that accommodate a population of chickens in one group based on age and gender, with the same room temperature, namely room temperature ranging from 20-25O C. Chickens are given food twice a day, namely in the morning and evening. The combination of feed given is 60% commercial chicken feed in crumb form for starter phase chickens and 40% rice bran for 12-17 week old chickens with a crude protein content of 16.6%. The combination of feed for 17-22 weeks of age, namely 60% commercial layer layer feed and 40% rice bran with a crude protein content of 14.2%, is given ad libitum in 1 hanging feeder per 1 cage. Drinking water was provided ad libitum in 1 gallon of plastic in each cage.
This research was carried out by crossing chickens resulting from crossing (F1) laying Elba chickens with male Bangkok RB chickens resulting from crossing (F1) Bangkok and Kampung BK females and their reciprocals. Parameters measured. Phenotypic and genotypic characters from the cross. Then the data was analyzed using a variance test.
Research methods
The experimental design used was a Completely Randomized Design with three replications to determine the effect of treatment on the observed variables.
A completely Randomized Plan (RAL) is the easiest design among other standard designs. The various advantages of using RAL include (1) easier design planning, (2) statistical analysis on experimental subjects is very simple, (3) flexibility in the use of the number of treatments and several repetitions, (4) relatively less loss of information in terms of missing data compared to other plans. The use of a completely random design (CRD) will produce correct calculations if the experimental material is homogeneous or relatively homogeneous and the number of treatments (Christina et al., 2016).
The data collected are body weight and morphometric characteristics including: body weight (BB), Shank Circumference (LS), Shank Length (PS), Comb Height (TJ), Femur Length (PF), Tibia Length (PT), Beak Length (PPr), Third Finger Length (PJk), Wing Length (PSy), and Pubic Distance Length (PJTP).
1. Body weight (BB) was measured by weighing the chicken with a digital scale (g). (Permadi et al., 2020)
2. Shank circumference (LS) was measured by wrapping a tape measure around the center of the tarsometatarsus bone (shank) (cm converted to mm). (Sartika, 2013)
3. Shank length (PS) was measured along the tarsometatarsus bone (shank) using a digital caliper (mm). (Permadi et al., 2020)
4. Comb height (TJ) was measured from the base of the comb over the head to the highest end of the comb using a caliper (Sartika, 2013)
5. Femur length (PF) was measured along the femur at the distal end which articulates with the tibia, fibula and patella using a caliper (Sartika, 2013)
6. Tibia length (PTi) was measured from the patella to the tip of the tibia measured using a digital caliper (mm). (Sartika, 2013).
7. Beak Length (PP) was the distance between the base of the maxilla to the tip of the maxilla, measured using a digital caliper (mm) (Sartika, 2013)
8. Wing Length (PSa) was measured from the humerus bone to the tip of the phalanges using a measuring tape (cm converted to mm) (Permadi et al., 2020)
9. The length of the third finger (PJK) was measured from the base to the tip of the third finger using a digital caliper (mm) (Permadi et al., 2020)
10. The distance between the pubic bones (JTP) was measured using a digital caliper (mm). (Sartika, 2013).
Data Analysis
Data analysis used to look at the qualitative characteristics of local chickens is to calculate the percentage, where the chickens are grouped by sex, and the percentage calculation is done using the formula Supranto (1990) in article (Wiyogo, 2016).
P=∑xi /n X 100%
Where :
P = Total percentage
X i = The value of the i-observation
n = Number of samples
The quantitative characteristics of local chickens were analyzed using descriptive statistical analysis by calculating the mean and standard deviation (standard deviation). Calculation of the mean and standard deviation is done using the formula Sudjana (2005) dalam Milas et al. (2020) :
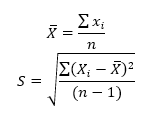
Where :
X = The average value of observations or
sample average
∑ = Addition
X i = The value of the i-observation
n = Number of samples
S = Standard deviation
Furthermore, the data were analyzed using one-way analysis of variance (Sa’diyah et al., 2013). The vector mean values of body measurements were analyzed using a completely randomized design (Damanik et al., 2020). Then statistical tests were carried out to identify the characteristics of body shape and size in crossbreed chickens (G1), Elba chickens and local chickens using principal component analysis (PCA) (Milas et al., 2020). Data processing was performed using statistical software SPSS version 10.
RESULTS AND DISCUSSION
Qualitative Phenotype Characteristics
The qualitative characteristics of the first generation as a result of crossing local and Elba chickens which will be described include: feather color, comb shape, and leg color. The results of data analysis on the morphometric characteristics of local chickens distinguished between male and female types. Feather color data, comb shape, and chicken leg color as qualitative characteristics were determined based on the results of the researchers’ observations.
Based on the data in Table 2, it can be explained that:
Table 2: Qualitative Properties of Feather Color of the First Generation of Local Chickens between Male and Female Types
| No | Local Chicken | Qualitative Properties | ||
| Feather Color | Amount | Percentage (%) | ||
| 1 | Male (6 birds) | Brown | 1 | 16.67 |
| Dark Brown | 1 | 16.67 | ||
| Silvery Black | 1 | 16.67 | ||
| Blackish Red | 2 | 33.33 | ||
| Black | 1 | 16.67 | ||
| Total | 6 | 100 | ||
| 2 | Female (18 birds) | White black | 1 | 5,55 |
| Golden gray | 1 | 16.67 | ||
| Black | 4 | 22.22 | ||
| Light brown | 1 | 5,55 | ||
| Gray | 5 | 27.77 | ||
| Light brown | 1 | 5,55 | ||
| Red | 2 | 11.11 | ||
| Dark brown | 2 | 11.11 | ||
| Dark brown | 1 | 5,55 | ||
| Total | 18 |
100 |
||
Table 3: Qualitative Properties of Elba Chicken Feather Color between Male and Female Types
| No | Elba Chicken | Qualitative Properties | ||
| Feather Color | Amount | Percentage (%) | ||
| 1 | Male (3 birds) | Dark Brownate | 1 |
33.33 |
| Light Brown | 1 | 33.33 | ||
| White Black | 1 | 33.33 | ||
| Total | 3 | 100 | ||
| 2 | Female (3 birds) | Light Brown | 1 | 33.33 |
| White | 1 | 33.33 | ||
| Light Brown | 1 | 33.33 | ||
| Total | 3 |
100 |
||
Table 4: Qualitative characteristics of the first generation comb form (G1) between male and female species
| No | Local Chicken | Qualitative Properties | ||
| Comb Shape | Amount | Percentage (%) | ||
| 1 | Male (6 birds) | Walnut | 3 | 50 |
| Pea | 3 | 50 | ||
| Total | 6 | 100 | ||
| 2 | Female (18 birds) | Rose | 2 | 11.11 |
| Single | 1 | 5.56 | ||
| Walnut | 12 | 66.67 | ||
| Pea | 3 | 16.67 | ||
| Total | 18 | 100 | ||
(1) The qualitative characteristics of the male type of local chicken from the 6 birds studied, there was one each (16.67%) brown, black brown, silvery black, and black, and there were 2 birds with black-red (33.33%); and (2) Qualitative characteristics of 18 female local chickens, 1 of which (5.55%) was white, black, brown, gray, and dark brown, 5 birds (27.77%) were gray, 4 birds (22.22%) were black, and 2 birds (11.11%) were red and black brown.
Qualitative phenotypic characteristics are the color and shape characteristics of local chickens that need to be known because they are markers of the production of each chicken which are useful in selecting and breeding native chickens based on breeding plans. (Guisso Taffa et al., 2022).
The results of the observation of the qualitative characteristics of the local chickens were distinguished between males and females. The results of observations on the morphometric qualitative characteristics of local chickens based on feather color, comb shape, and leg color between male and female species are as described in Appendix 2, the summary is explained in Table 2.
The results of observations on the qualitative characteristics are based on the feather color, comb shape, and leg color of Elba chickens between male and female species as shown in Table 3.
Based on the data in Table 3, it can be explained that: (1) The qualitative characteristics of Elba chickens of the male type of the 3 (three) birds studied, there was one bird each (33.33%) black brown, light brown and white black colors; and (2) the qualitative characteristics of the female Elba from the 3 (three) birds studied, there was one bird each (33.33%) light brown, white, and light brown colors. There is a similarity in the color of Elba chickens between male and female types, namely gold.The results of observations on the comb shape of the first generation of local chickens between male and female types are described in Table 4.
Based on the data in Table 4, it can be explained that: (1) the qualitative characteristics of the characteristics of male local chickens from the 6 (six) birds studied, there were 3 birds (50.00%) with walnut-shaped combs and 3 birds (50.00%) with a pea-shaped comb; and (2) the qualitative characteristics of local females of the 18 types studied, there were 2 birds (11.11%) with a rose-shaped comb, 1 bird (5.56%) with a single comb, 12 birds (83.33 %) with a walnut-shaped comb, and there were 3 birds (16.67%) with a pea-shaped comb. So, the majority of the combs of the female local chickens are walnut-shaped.
The results of observations on the shape of the comb of the first generation of Elba chickens between male and female types are described in Table 5.
Based on the data in Table 5, it can be explained that: (1) the qualitative characteristics of Elba chickens of the male type from 3 (three) birds as a whole with a single comb; and (2) the morphometric qualitative characteristics of the female of the 3 (three) birds studied, overall with a walnut-shaped comb. These results illustrate that the morphometric qualitative characteristics of the Elba comb shape between male and female species are different.
The results of observations on the leg skin color of the first generation of Elba chickens between male and female types are described in Table 6.
Based on the data in Table 6, it can be explained that: (1) the qualitative characteristics of local male chickens from the 6 (six) birds studied, as a whole they have white legs; and (2) the morphometric qualitative characteristics of local females of the 18 (eighteen) types studied, there were 11 (61.11%) with black legs, 5 (27.78%) with white legs, and there were 2 birds (11, 11%) with yellow leg skin. These results illustrate that the morphometric qualitative characteristics of the leg skin color of local chickens of male and female breeds are different.
Based on the data in Table 7, it can be explained that: (1) the qualitative characteristics of the Elba chickens of the male type of the 3 (three) birds studied, overall they have white skin color; and (2) the morphometric qualitative characteristics of the female Elba chickens from the 3 (three) birds studied, there was 1 bird (33.33%) with black leg skin, and there were 2 birds (66.67%) with white leg skin. These results illustrate that the qualitative characteristics of the skin color of Elba chicken legs between male and female chickens are different.
Morphometric Characteristics
In Table 8 it can be seen that the body weight of the crosses of Elba chicken and local chicken (G1), Elba, and local chickens were 1097.56 ± 46.53 (gr), 1202.71 ± 83.58 (gr) and 1560.60 ± 92.78 (gr) respectively. The results of the analysis of diversity (ANOVA) showed that the body weight of the three types of chickens was highly significant (P <0.01), while the results of the follow-up test showed that the smallest significant difference in chicken weight (G1) and Elba had no statistical effect, but both G1 and Elba had a very significant effect on local chickens.
The average body weight and morphometric characteristics of the crosses of Elba and local chickens (G1), Elba (E) and local chickens (B) are presented in Table 8.
This difference in body weight is thought to be caused by genetic factors because in this study all chickens received the same environmental treatment and feed. This is in accordance with the opinion of that differences in body weight in groups of livestock given the same feed ad libitum are caused by genetic factors (Djego et al., 2019).
Table 5: Qualitative Characteristics of Elba Chickens of the First Generation Comb Shapes between Male and Female Types
| No | Elba Chickens | Qualitative Properties | ||
| Comb Shape | Amount | Percentage (%) | ||
| 1 | Male (3 birds) | Single | 3 | 100 |
| Total | 3 | 100 | ||
| 2 | Female ( 3 birds) | Walnut | 3 | 100 |
| Total | 3 |
100 |
||
Table 6: Qualitative Characteristics of Leg Skin Color of the First Generation Elba and Local Chickens both Males and Females
| No | G1 Chicken | Qualitative Properties | ||
| Leg Skin Color | Amount | Percentage (%) | ||
| 1 | Male (6 birds) | White | 6 | 100 |
| Total | 6 | 100 | ||
| 2 | Female (18 birds) | Black | 11 | 61.11 |
| White | 5 | 27.78 | ||
| Yellow | 2 | 11.11 | ||
| Total | 18 |
100 |
||
Table 7: Qualitative Characteristics of Leg Skin Color in the First Generation of Elba Chickens between Male and Female Types
| No | Elba Chicken | Qualitative Properties | ||
| Leg Skin Color | Amount | Percentage (%) | ||
| 1 | Male (3 birds) | White | 3 | 100 |
| Total | 3 | 100 | ||
| 2 | Female (3 birds) | Black | 1 | 33.33 |
| White | 2 | 66.67 | ||
| Total | 3 |
100 |
||
Table 8: Mean body measurements of crossbreed chickens (G1), Elba chickens and local chickens.
| Variable | G1 Chicken | Elba Chicken | Local Chicken |
|
BB (gr) |
1097.56±46.53a |
1202.71±83.58 a |
1560.60±92.78b |
|
LS (cm) PS (cm) TJ (cm) PF (cm) PT (cm) PPr (cm) |
0.931±0.026a 5.92±0.18a 0.44±0.12a 9.16±0.22a 12.18±0.27a 2.58±0.07ab |
1.00±0.25b 6.64±0.20ab 3.08±0.58b 8.86±0.29a 12.82±0.18a 2.87±0.08a |
0.700±0.17a 6.76±0.29b 2.59±0.69b 9.13±0.79a 12.40±0.54a 2.38±016b |
|
PJk (cm) PSy (cm) LPu (cm) |
5.70±0.13a 16.98±0.38a 2.75±0.08a |
5.57±0.16a 16.87±0.73a 3.03±0.11a |
5.51±0.24a 16.40±0.85a 2.18±0.21b |
Note: Different letter superscripts on the same line for each type of chicken mean significantly different (P <0.05), body weight (BB), Shank Circumference (LS), Shank Length (PS), Comb Height (TJ), Femur Length (PF), Tibia Length (PT), Beak Length (PPr), Third Finger Length (PJk), Wing Length (PSy), and Pubic Sparse Length (PJTP).
Factors that influence chicken body weight can be influenced by environmental factors: temperature and humidity, feed management and livestock health (Nuraini et al., 2020).
In poultry production, there are two main nutrients taken into account in feed, namely carbohydrates and protein (Ameen et al., 2023). Energy needed for growth, vital activity, and the maintenance of body temperature is provided by carbohydrate, lipid, and protein metabolism (Lawrence Azua et al., 2022). State that the variation in body size of chickens can be influenced by the rearing environment and different breeds (Nurwahyuni et al., 2023).
Feed with good nutritional content will produce good chicken productivity as well. (Falah et al., 2022). Heat stress is an important environmental factor that has many adverse effects on broiler breeding, including growth rate, weight and meat quality (Awad et al., 2020). It also affects poultry welfare issues such as mortality (Zhao et al., 2021).
The results of the morphometric measurements also showed that of all the measured body measurements there was a significant difference (P<0.05) between G1 chickens, Elba chickens and local chickens at LS, PS, TJ, PPr and PTPu, while PF, PT, PJk, and PS were not significantly different (P>0.05). The body measurements of G1 chickens and local chickens were significantly different (P<0.05) in body size, body weight (BB), comb height (TJ), pubic bone distance (PTPu), while G1 and Elba chickens only occurred in the size of the comb height (TJ), and all the differences in body sizes do not have a significant effect. Differences in body sizes in this study are thought to be caused by genetic factors (Waterfield et al., 2023), because environmental factors had been made to be uniform, such as being given the same food and kept in the same cage environment.
Morphometric parameter is a quantitative characteristic that can be used as a selection criterion to increase the productivity of Elba and local chickens (Nafiu et al., 2020). Quantitative characteristics of Elba and local chickens based on morphometrics include body weight, beak length, beak width, head length, neck length, neck circumference, chest width, chest length, tibia length, tibia circumference, shank length, shank circumference, and toe length third (Masir et al., 2023).
In domestic species, an identification of the diversity level, especially at loci that have important value traits is related to selection in breeding programs (Reflinur & Lestari, 2015). The application of genomic selection revolutionized animal breeding methods (Zhang et al., 2022). Quantitative traits are influenced by the environment, genetics, and the interaction of genetics with the environment (Irmaya et al., 2021). The most important quantitative properties are body weight, shank width, shank length, beak length, comb height, femur length, tibia length, third finger length, wing length and pubic bone. Bone size is an inherited trait; therefore, variables of body frame sizes are accurate to be used as differentiating variables or markers so as to give a specific picture of local chickens (Sartika, 2013).
Main Component Analysis
This analysis is used to explain the structure of variance by means of a linear combination of variables with the main concept of reducing data and interpreting it to find out the discriminant between body size and body shape of chickens. Size and shape equations, total diversity (KT), and eigen values (λ) of G1 chickens, Elba chickens and local chickens are presented in Table 9.
Based on Table 9, it can be seen that PC1 of G1 chicken shows that the tibia length has a value of 0.22 and in PC2 it shows the wing length with a value of 0.22. In Elba chickens, PC1 shows that the width of the pubic bone has a value of 0.38 and PC2 shows that the width of the pubic bone has a value of 0.78, while in local chickens PC1 shows that the length of the beak has a value of 0.72 and PC2 indicates the length of the beak with a value of 0. 75. The main component variable for the size of G1 chickens is the length of the tibia. This means that the length of the tibia can be used as an identifier for body size in local and Elba chickens because it has the greatest contribution to the body size equation, while the identifier for body size in Elba chickens is the width of the pubis bone and for local chickens it is the length of the beak (Hastuti et al., 2021).
The results of this study are different from those of which stated that the body size characteristic of Kedu chicken was the length of the wings, while the length of the femur was the characteristic of the body shape. Similarly, which says that super local chicken has a body shape characteristic (chest width) that is different from KUB chicken and local chicken (back length) (Mahmudi et al., 2019).
Differences in the characteristics of body size and shape in each chicken line are thought to be due to genetic differences (Hafid, 2020). This is in accordance with the opinion that differences in body size and shape in livestock breeds may be caused by differences in genetic factors (Hafid, 2020). Characteristics of body size and shape in each chicken line are obtained through principal component analysis (Amao, 2018). In principal component analysis, phenotypic parameters can be used to determine morphometric parameters that indicate nation markers and are referred to as nation-distinguishing variables (Warman et al., 2023). Body shape is strongly influenced by genetics, while body size is influenced not only by genetics but also by the environment or regional topography, the purpose of rearing and caring for chickens (Mariandayani et al., 2013).
Cluster Determination Based on Morphometric Characters
Cluster analysis is a multivariate statistical analysis that can group variables and objects based on their characteristics (Dini & Fauzan, 2020). In this case, the characters used are the morphometrics of each chicken strain, name
Table 9: Equation of size and body shape of G1, Elba and local chickens
| Type | Componen | Equation | KT % | Eeigen Value |
| (G1) Chicken | size Body = | 0.13BB+0.16LS+0.15PS+0.15TJ+0.19PF+0.22PT+0.09PPr+0.17PJk+ 0.22PSy+0.08LP |
0.71 | 5.06 |
| shape. Body = | 0.48BB + 0.61LS +0.55PS + 0.58TJ + 0.73PF + 0.84Pti + 0.35 PPr + 0.65PJk + 0.82PSy + 0.31LP |
|||
|
Elba Chicken |
size Body= | 0.32BB-0.27LS+0.24PS+0.21TJ-0.12PF-0.06Pti- 0.13PPr – 0.14PJk – 0.12PSy + 0.38LP |
0.71 | 1.6 |
| shape Body= | 0.65BB – 0.56LS + 0.50PS + 0.43TJ – 0.22PF – 0.12Pti – 0.26PPr – 0.29PJk – 0.24 Psy + 0.78LP |
|||
| Local Chicken | size Body= | -0.99BB + 0.17LS + 0.06PS + 0.43TJ – 0.28PF + 0.01Pti + 0.72PPr – 0.31PJk – 0.21Psy – 0.08LP |
0.75 | 4.12 |
| Shape Body= |
-0.10BB + 0.18LS + 0.06PS + 0.44TJ – 0.29 PF + 0.01Pti + 0.75PPr – 0.32PJk – 0.22Psy – 0.08LP |
Note: body weight (BB), Shank Circumference (LS), Shank Length (PS), Comb Height (TJ), Femur Length (PF), Tibia Length (PT), Beak Length (PPr), Third Finger Length (PJk), Wing Length (PSy), and Pubic Sparse Length (PJTP).
ly the first generation chickens (G1) from crosses of Elba and local chickens (1), Elba chickens (2) and local chickens (3). The division of these clusters is very important for the directional selection process carried out in an effort to improve the genetic quality of chickens (Paim et al., 2022), Therefore, according to the purpose of the cluster analysis carried out in this study, namely to group objects (morphometric characters) that are similar in the same cluster, several sizes are necessary to find out some similarities or differences of these objects. There are three methods that can be applied in measuring the similarity between objects, namely association measurement, correlation measurement, distance measurement (Van Bocxlaer & Schultheib, 2010).
In Figure 1 below is a dendrogram from cluster analysis which shows that there are three clusters occurring from the mofromometric measurements of the crosses of local chickens and Elba chickens (1), Elba chickens (2) and Buras chickens (3). Of the 42 samples, the first cluster was grouped with the shortest distance between the chicken samples (G1), namely from No. 20 to 18. However, there is a local chicken sample, namely No. 38 which has the same morphometrics as in this cluster, but 81.25% chickens the results of crossing Elba and local chicken (1) are in this cluster, followed by Elba Chickens as much as 14.28% and local chickens (7.14%).
As for the second cluster, there were 20 samples of chickens No. 4 to 24. There were good flocks of G1 chickens (55%), Elba chickens (25%) and local chickens (20%). In the meantime, in the third cluster, which was only occupied by 6 samples from No. 25 to 35, it was dominated by local chickens at 83.3% and G1 chickens at 16.7%.
CONCLUSION
Based on the research results, it can be concluded that the first generation (G1) for males still has a variety of fur colors, while the females are dominated by gray. All quantitative phenotypic variables make a real difference, namely they have an effect on productivity. The main component variable in G1 chickens is Tibia Length, while cluster analysis based on morphometrics contains three clusters.
This research is very useful for application in other places regarding the selection and breeding of free-range chickens that have superior productivity. The limitation of this research may be the potential for bias in treatment, and in the future there needs to be support from the government and policy related parties in improving the quality of free-range chickens so that they can make more contributions to science and society in general.
Acknowledgments
The author would like to thank various parties, including the Dean and Chair of the LPPM, Khairun University, who have approved and provided funding for the 2022 PKUPT Khairun University research program, as well as the Chair of the Animal Husbandry Study Program, Faculty of Agriculture, Khairun University, who has contributed to this research, both materially or non-materially.
conflict of interest
The authors declare that they have no known competing financial interests or personal relationships that could have appeared to influence the work described in this paper.
novelty statement
The novelty of this research is producing or finding a new breed of local chicken typical of Ternate City which has high productivity, where so far there has been no specific research regarding the treatment of raising local chickens in this area.
Authors contribution
Sariffudin Fatmona: Conceptualization, Data Curation, Formal Analysis, Investigation, Methodology, Writing – original draft.
Abdurahman Hoda: Conceptualization, Obtaining Funding, Investigation, Methodology, Project Administration.
Sri Utami: Data Curation, Formal Analysis, Investigation, Writing – original draft, Writing – review & editing.
References
Amao S. R. (2018). Application of Principal Component Analysis on the Body Morphometric of Nigerian Indigenous Chickens reared intensively under Southern Guinea Savanna Condition of Nigeria. J. Environ. Issues Agricult. Develop. Count., 10(1): 1–12.
Ameen Q. H., Mohammed M. A., Ameen S. H., Alsaadi S. A. (2023). The Requirements of Chickens for Nutritional Compounds for Growth, An advanced Nutritional outlook. Kirkuk University J. Agricult. Sci., 14(3): 17–33. https://doi.org/10.58928/ku23.14303
Astuti S. S., Hariati A. M., Kusuma W. E., Wiadnya D. G. R. (2022). Morphometric Variation among 28 Sub-populations of Barbodes binotatus in Indonesia. Sains Malays., 51(1): 15–26. https://doi.org/10.17576/jsm-2022-5101-02
Awad E. A., Najaa M., Zulaikha Z. A., Zulkifli I., Soleimani A. F. (2020). Effects of heat stress on growth performance, selected physiological and immunological parameters, caecal microflora, and meat quality in two broiler strains. Asian-Australasian J. Anim. Sci., 33(5), 778–7787. https://doi.org/10.5713/ajas.19.0208
Christina Y., Tsalsabila A., Ekawati D. A., Amalia F., Septiani R. D., Novitri N., Gulo T., Reza A. K., Jayanti R. D., Erfiani E., Irzaman I. (2016). Analisis Statistik Efisiensi Energi Penggunaan Tungku Sekam Sebagai Bahan Bakar Alternatif Rumah Tangga. Prosiding Seminar Nasional Fisika (E-JOURNAL), 5, SNF2016-MPS. https://doi.org/10.21009/0305020219
Damanik P. P., Wiyanto E., Depison D. (2020). Evaluasi Karakteristik Kuantitatif Kambing Samosir Berdasarkan Analisis Komponen Utama Di Kecamatan Nainggolan Kabupaten Samosir. J. Ilmiah Petern. Terpadu., 8(2): 72. https://doi.org/10.23960/jipt.v8i2.p72-76
Dameanti F. N. A. E. P., Firdaus M. A., Titisari N., Aditya S., Guritno I. (2020). The Effect of Environmental Factors on The Productivity of Kampong Chicken Eggs Balitbangtan (KUB) Layer Phase. J. Medik Vet., 3(2): 166–172. https://doi.org/10.20473/jmv.vol3.iss2.2020.166-172
Dini S. K., Fauzan A. (2020). Clustering Provinces in Indonesia based on Community Welfare Indicators. EKSAKTA: J. Sci. Data Analys., 1(1): 56–63. https://doi.org/10.20885/eksakta.vol1.iss1.art9
Djego Y., Kihe J. N. dan, Pangestuti H. T. (2019). Efek Komposisi Genotip Dari Ayam Ras Petelur, Kate dan Lokal Sabu Terhadap Sifat-Sifat Pada Bobot Badan dan Ukuran Tubuh. J. Nukleus Peternak., 6(1): 20–25. https://doi.org/https://doi.org/10.35508/nukleus.v6i1.1890
Emuron N., Magala H., Kyazze F. B., Kugonza D. R., Kyarisiima C. C. (2010). Factors influencing the trade of local chickens in Kampala city markets. Livest. Res. Rural Develop., 22(4). https://doi.org/10.51978/proppnp.v4i0.434
Falah R. R., Sadara H. T., Sjofjan O., Natsir M. H. (2022). Pengaruh Penggunaan Organik Protein Dalam Pakan Terhadap Produktivitas Ayam Pedaging The Effect of Use Organic Protein in Feed on Broiler Productivity. J. Nutr. Ternak Trop., 5(2): 125–138. https://doi.org/10.21776/ub.jnt.2021.005.02.7
Guisso Taffa A., Moula N., Issa S., Mahamadou C., Detilleux J. (2022). Phenotypic Characterization of Local Chickens in West Africa: Systematic Review. Poultry, 1(4): 207–219. https://doi.org/10.3390/poultry1040018
Hadi R. F., Suprayogi W. P. S., Handayanta E., Sudiyono S., Hanifa A., Widyawati S. D. (2021). Peningkatan Produktivitas Usaha Budidaya Ayam Kampung UKM Putra Budi Kecamatan Mojolaban Kabupaten Sukoharjo. PRIMA: J. Commun. Empower. Serv., 5(2): 118. https://doi.org/10.20961/prima.v5i2.44687
Hafid H. (2020). Performances Body Dimensions of Bali Cattle of Traditional Livestock in Southeast Sulawesi. Indonesian J. Agricult. Res., 3(2): 136–144. https://doi.org/10.32734/injar.v3i2.3997
Hastuti H., Junaedi J., Putra A. (2021). Hubungan Karakteristik Morfologi Tubuh dengan Bobot Badan Ayam Bangkok Jantan. J. Vet., 22(3): 360–366. https://doi.org/10.19087/jveteriner.2021.22.3.360
Irmaya D., Depison D., Gushairiyanto G. (2021). Quantitative characteristic of Indonesian native chickens at the age of 4 months. Livest. Anim. Res., 19(1): 108. https://doi.org/10.20961/lar.v19i1.43150
Jailani B. A., Grinting R. B. (2024). Analisa pendapatan usaha masyarakat pada peternak ayam buras di Kecamatan Binjai Kabupaten Langkat. J. Innovat. Res. Knowl., 3(8): 1779–1792. https://doi.org/https://doi.org/10.53625/jirk.v3i8
Lapihu Y. L., Telupere F. M. S., Sutedjo H. (2019). Kajian Fenotip dan Genetik Performa Pertumbuhan dari Persilangan Ayam Lokal dengan Ayam Ras Petelur Isa Brown. J. Sain Peternak. Indonesia., 14(3): 298–305. https://doi.org/10.31186/jspi.id.14.3.298-305
Lawrence Azua O. O., Gebisa G., Gizaw O. (2022). Effect of Feed Form on Body Conformation Traits of Different Hybrids of Broiler Chickens. Int. J. Zool., 2022. https://doi.org/10.1155/2022/5616692
López del Val J. A., Alonso Pérez de Agreda J. P. (1993). Principal components analysis. Atencion Primaria / Sociedad Español. Med. Famil. Comunitar., 12(6): 333–338. https://doi.org/10.5455/ijlr.20170415115235
Mahmudi M., Priyanto R., Jakaria J. (2019). Karakteristik Morfometrik Sapi Aceh, Sapi PO dan Sapi Bali Berdasarkan Analisis Komponen Utama (AKU). J. Ilmu Produk. Teknol. Hasil Peternak., 7(1): 35–40. https://doi.org/10.29244/jipthp.7.1.35-40
Mariandayani H. N., Solihin D.D. Sri Sulandari, S. dan S. C. (2013). Keragaman Fenotipik dan Pendugaan Jarak Genetik pada Ayam Lokal dan Ayam Broiler Menggunakan Analisis Morfologi. J. Vet., 14(4): 475–484. https://ojs.unud.ac.id
Masir U., Effendi S., Suparmin Y. (2023). Pengukuran Morfometrik Ayam Lokal sebagai seleksi Parameter Perfor. Ternak Ayam Pedag.. 132–137. https://doi.org/10.51978/proppnp.v4i0.434
Milas E. S. S., Saerang J. L. P., Lambey L. J., Takaendengan B. J. (2020). Karakteristik Fenotipe Beberapa Sifat Kuantitatif Ayam Kampung Di Minahasa. Zootec, 40(2): 603. https://doi.org/10.35792/zot.40.2.2020.29682
Nafiu L. O., Abadi M., Wati I. (2020). Characteristics of qualitative and quantitative properties of chicken village in the Sub-District Lasusua, North Kolaka District. Anjoro: Int. J. Agricult. Busi., 1(2): 67–74. https://doi.org/10.31605/anjoro.v1i2.766
Najoan M., Elly F. H., Bagau J. R. L. B. (2018). Prospek Pengembangan Unggas Lokal Provinsi Sulawesi Utara. Prosid. Seminar Nas., 2012. 23–35. http://repo.unsrat.ac.id/id/eprint/1940
Nuraini, Napirah A., Hafid H., Nasiu F., Libriani R., Yaddi Y., Elfia, Ananda S. H. (2020). Feed Consumption, Average Daily Gain and Feed Conversion of Broiler Chicken with Different Feed. IOP Conference Series: Earth Environ. Sci., 465(1): 1–5. https://doi.org/10.1088/1755-1315/465/1/012047
Nurwahyuni E., Putri A. R. I., Febrianto N., Marom M. A., Azhar R. F. (2023). Performance Analysis in Quantitative Traits of Local Chickens (Gallus gallus sp.) In Kediri Regency East Java. J. Sain Peternak. Indonesia., 18(1): 15–19. https://doi.org/10.31186/jspi.id.18.1.15-19
Ouédraogo R. W., Tindano K., Traoré F. G., Tapsoba S. A. R., Sanou M., Tamboura H. H., Bayala B., Traoré A. (2023). Local Chickens Farming System Characteristics and Their Genetic Resources Management in Seno Province of Burkina Faso. Trop. Anim. Sci. J., 46(4): 509–515. https://doi.org/10.5398/tasj.2023.46.4.509
Paim T. do P., Alves dos Santos C., Faria D. A. de, Paiva S. R., McManus C. (2022). Genomic selection signatures in Brazilian sheep breeds reared in a tropical environment. Livest. Sci., 258(February), 104865. https://doi.org/10.1016/j.livsci.2022.104865
Permadi A. N. N., Kurnianto E., Sutiyono S. (2020). Karakteristik Morfometrik Ayam Kampung Jantan dan Betina di Desa Tirtomulyo Kecamatan Plantungan, Kabupaten Kendal, Jawa Tengah. J. Peternakan Indonesia. Indonesian J. Anim. Sci., 22(1): 11. https://doi.org/10.25077/jpi.22.1.11-20.2020
Reflinur B., Lestari P. (2015). Determination of gene locus in plant chromosomes with DNA marker. J. Litbang Pert., 34(4): 177–186. http://ejurnal.litbang.pertanian.go.id/index.php/jppp/article/view/3097/2694
Sa’diyah N., Widiastuti M., Ardian A. (2013). Keragaan, Keragaman, Dan Heritabilitas Karakter Agronomi Kacang Panjang (Vigna Unguiculata) Generasi F1 Hasil Persilangan Tiga Genotipe. J. Agrotek Trop., 1(1): 32–37. https://doi.org/10.23960/jat.v1i1.1885
Salamony S. M., N, S., Telussa S. P., Andari G. (2019). Pengaruh Ratio Jantan dan Betina Terhadap Fertilitas dan Daya Tetas Telur Ayam Kampung kampung . Ciri umum dari ternak ini yaitu produktivitasnya masih rendah , disebabkan faktor telur bibit yang diperoleh memiliki pertunasan yang baik ( Paimin , F . B 20. Musamus J. Livest. Sci., 2(1): 23–27. http://jurnal.unpad.ac.id/ejournal/article/view/10221/4649
Sartika T. (2013). Perbandingan Morfometrik Ukuran Tubuh Ayam KUB dan Sentul Melalui Pendekatan Analisis Diskriminan. Seminar Nasion. Teknol. Peternak. Vet., 561–570. http://ejurnal.litbang.pertanian.go.id/index.php/jppp/article/view/3097/2694
Silondae H., Muzayyanah M. A. U., Sulastri E., Guntoro B. (2022). The Role of Household-Scale Local Chicken Farms in Providing Family Food in Minahasa Regency. IOP Conference Series: Earth Environ.l Sci., 1105(1). https://doi.org/10.1088/1755-1315/1105/1/012009
Siwu R., Wantasen E., Kalangi L. (2023). Analisis break even point usaha ternak ayam buras milik Bapak Jotje Rawung di Desa Paniki Atas Kecamatan Talawaan (Studi Kasus). Zootec., 43(2): 158–167. https://doi.org/10.35792/zot.43.2.2023.48769
Sophian A., Abinawanto Nisa, U. C., Fadhillah. (2021). Morphometric analysis of Gorontalo (Indonesia) native chickens from six different regions. Biodiversitas., 22(4): 1757–1763. https://doi.org/10.13057/biodiv/d220420
Sumantri C., Khaerunnisa I., Gunawan A. (2020). The genetic quality improvement of native and local chickens to increase production and meat quality in order to build the Indonesian chicken industry. IOP Conference Series: Earth Environ. Sci., 492(1). https://doi.org/10.1088/1755-1315/492/1/012099
Suryadi U., Prasetyo B. (2022). Aplikasi Up-Grading Bibit Ayam Kampung di Teaching Factory Hatchery Politeknik Negeri Jember. NaCosVi: Polije …, 354–360. https://proceedings.polije.ac.id/index.php/ppm/article/view/422%0Ahttps://proceedings.polije.ac.id/index.php/ppm/article/download/422/413
Van Bocxlaer B., Schultheib R. (2010). Comparison of morphometric techniques for shapes with few homologous landmarks based on machine-learning approaches to biological discrimination. Paleobiology., 36(3): 497–515. https://doi.org/10.1666/08068.1
Viastika Y. M. (2021). Efisiensi Usaha Peternakan Ayam Broiler dengan Sistem Manajemen Closed House dan Open House. Eksis: J. Ilmiah Ekonomi Bisnis., 12(1): 107. https://doi.org/10.33087/eksis.v12i1.243
Wangge M. (2021). Penerapan Metode Principal Component Analysis (PCA) Terhadap Faktor-faktor yang Mempengaruhi Lamanya Penyelesaian Skripsi Mahasiswa Program Studi Pendidikan Matematika FKIP UNDANA. J. Cendekia : J. Pendidik. Matemat., 5(2): 974–988. https://doi.org/10.31004/cendekia.v5i2.465
Warman A. T., Fadhilah G. T., Ibrahim A., Atmoko B. A., Baliarti E., Panjono. (2023). Morphometric characterization and zoometric indices of female Bali cattle reared in Lombok Tengah District, West Nusa Tenggara, Indonesia. Biodiversitas., 24(2): 966–974. https://doi.org/10.13057/biodiv/d240236
Waterfield S., Richardson T. G., George Davey Smith L. M. O., J. A. B. (2023). Life course effects of genetic susceptibility to higher body size on body fat and lean mass: prospective cohort study. Int. J. Epidemiol., 52(5): 1377. https://doi.org/https://doi.org/10.1093/ije/dyad029
Wiyogo. (2016). A Nalysis O F T He A Chievement O F Q Uality E Ducation P Racticum I N M Echanical A Nalisa P Encapaian K Ualitas P Elaksanaan P Raktikum D I. 4(1): 80–88. https://e-journal.upr.ac.id/index.php/JBL/article/view/1396
Zhang P., Qiu X., Wang L., Zhao F. (2022). Progress in Genomic Mating in Domestic Animals. Animals., 12(18): 1–11. https://doi.org/10.3390/ani12182306
Zhao Z., Zou X., Yin Z., Cao Z., Zhang J., Wang C., Liu W., Bai Y. (2021). Research on the Correlation between Breeding Environment and Activity of Yellow Feather Broilers Based on the Multichromatic Aberration Model. Computat. Intellig. Neurosci., 2021. https://doi.org/10.1155/2021/2897879
To share on other social networks, click on any share button. What are these?


