Performance Stability Assessment in upland Cotton Strains throughout Cotton-growing Belt in Pakistan
Performance Stability Assessment in upland Cotton Strains throughout Cotton-growing Belt in Pakistan
Muhammad Jamil1*, Ghulam Sarwar2, Imran Akhtar3, Ghayour Ahmad4 and Saeed Ahmad4
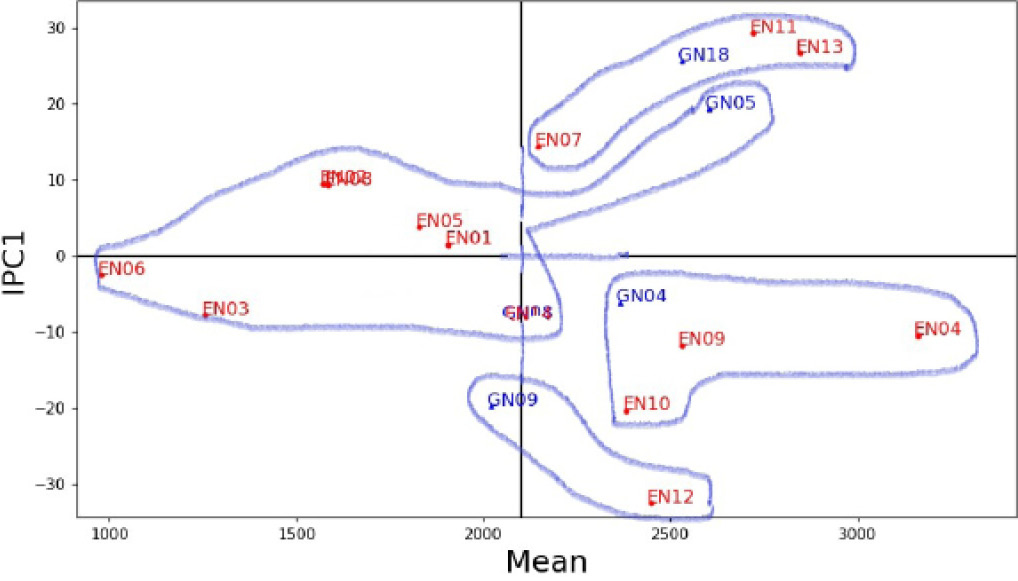
AMMI biplot indicating a mean yield of cotton strains (Kg per ha) in abscissa and IPCA-1 scores on the ordinate axis. Four mega environments are encircled along with winner genotypes.
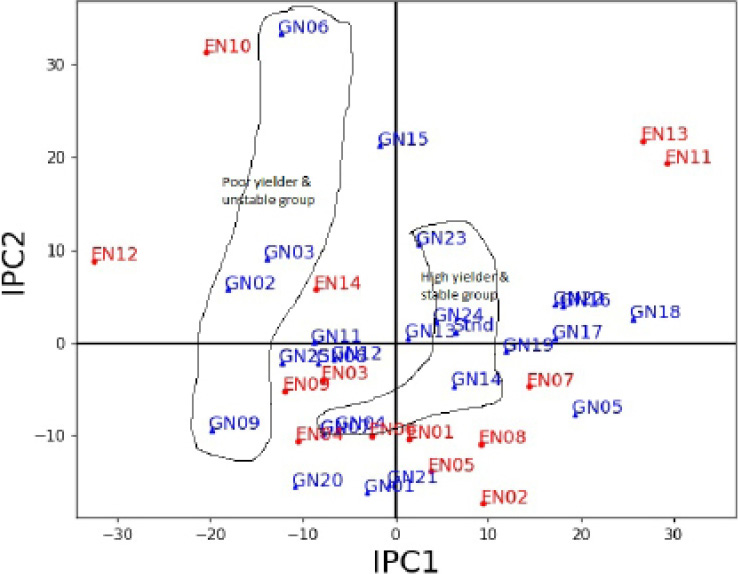
AMMI-2 biplot indicating IPCA-1 (Interaction Principal Component Axis-1) scores in abscissa and IPCA-2 scores on the ordinate axis. Two groups (high yielder & stable) and (Poor yielder & unstable) are encircled separately.


