
Performance Analysis and Development of Closed-House Broiler Farm Business (Case Study at Camara Farm, Cigendel Village, Pamulihan District, Sumedang Regency)


Research Article
Performance Analysis and Development of Closed-House Broiler Farm Business (Case Study at Camara Farm, Cigendel Village, Pamulihan District, Sumedang Regency)
Eluzia A. Barus*, Khansa N. Salsabilah, Achmad Firman, Linda Herlina
Department of Social Economics, Faculty of Animal Husbandry, Universitas Padjadjaran, Jl. Raya Bandung Sumedang Km 21 Jatinangor, Sumedang, Indonesia, 45363
Abstract | The demand for chicken meat is steadily increasing in Indonesia, resulting in an increase in broiler chicken farming businesses, often with differing farming systems and designs. However, any business needs to be profitable to be economically sustainable. This research aims to analyze profitability and Break Even Point in closed-house system broiler chicken farming businesses with a capacity of 63,000 birds. We will also plan developmental strategies to increase the business’ income. This research was conducted using the survey method at Camara Farm, Cigendel Village, Pamulihan District, Sumedang Regency, in October 2023. Data collection consisted of primary and secondary data obtained using the interview method. Based on the research results, Camara Farm’s average total production cost per period for a year was Rp. 2,342,573,664. The average revenue per production period was Rp. 2,429,151,070, so the average revenue obtained per production period was Rp. 87,170,606 with profitability at 3.31%. The average BEP obtained unit was 101,590.53 kg, and the BEP price in rupiah was Rp. 2,187,762,256. The SWOT analysis results show that Camara Farm’s business development strategies should focus on building expansion, better management and price-contractor, higher quality breed, feed, and human resources, business diversification, and technological advancement. Overall, the Camara broiler farm business is profitable in the short term and has potential to provide even higher benefits in a long run.
Keywords | Closed-house broiler farm, Cost revenue, Profitability, Break even point, SWOT analysis, Developmental strategies
Received | November 29, 2023; Accepted | January 24, 2024; Published | February 15, 2024
*Correspondence | Eluzia A. Barus, Department of Social Economics, Faculty of Animal Husbandry, Universitas Padjadjaran, Jl. Raya Bandung Sumedang Km 21 Jatinangor, Sumedang, Indonesia, 45363; Email: [email protected]
Citation | Barus EA, Salsabilah KN, Firman A, Herlina L (2024). Performance analysis and development of closed-house broiler farm business (Case study at camara farm, Cigendel village, Pamulihan district, Sumedang Regency). Adv. Anim. Vet. Sci., 12(4):657-667.
DOI | https://dx.doi.org/10.17582/journal.aavs/2024/12.4.657.667
ISSN (Online) | 2307-8316
Copyright: 2024 by the authors. Licensee ResearchersLinks Ltd, England, UK.
This article is an open access article distributed under the terms and conditions of the Creative Commons Attribution (CC BY) license (https://creativecommons.org/licenses/by/4.0/).
INTRODUCTION
As the population, income, and education levels increase, society becomes more aware of the importance of meeting nutritional needs, especially regarding animal protein. As a result, the demand for animal protein-containing food also rises. This is evident in the increasing demand for poultry, particularly chicken meat. In line with Ayugustin’s (2022) statement, chicken meat is a protein source commodity preferred by the public to meet their protein needs due to its widespread breeding worldwide, making it readily available, relatively affordable, and nutritious. Poultry meat is highly popular in all countries, and as no rituals or religions prohibit poultry consumption, poultry meat consumption steadily increases (Statsenko et al., 2021).
Livestock farming is the process of combining production factors, including land, livestock, labor, and capital, to produce livestock products (Campanhola and Pandey, 2019). According to Law No. 18 of 2009, livestock farming encompasses all matters related to physical resources, seeds, seedlings and/or young animals, feed, livestock equipment and machinery, animal husbandry, harvesting, post-harvest processing, marketing, and management. Meanwhile, livestock companies are individuals or corporations, both legal entities and non-legal entities, established and domiciled within the territory of the Unitary State of the Republic of Indonesia, managing livestock businesses with specific criteria and scales, producing products and services that support livestock farming.
The increasing demand for chicken meat must be accompanied by efforts to ensure its supply. One of the efforts to meet this demand is maximizing broiler chicken farming. According to Yemima (2014), broiler chicken farming has excellent prospects and business opportunities. Broiler chickens are one of the leading livestock commodities due to their relatively short harvest time, which is 30-40 days, with a relatively fast body weight growth at 5-6 weeks, averaging 1.4-1.6 kg (Susanti, 2023). The development of broiler farming has prospects for development in both large-scale and small-scale farming because, compared to other livestock commodities, one of the advantages of broiler chickens is their short production cycle (4-6 weeks), allowing farmers to recover their investment quickly, and profits can be realized sooner (Respati et al., 2020). The success of broiler chicken farming depends on effective management, including financial management, production, human resources, and marketing.
Although broiler chicken farming has good prospects and opportunities, farmers will face various challenges and obstacles, including those related to capital, technology, and marketing. Broiler chicken farming often faces fluctuating situations, such as changes in broiler chickens’ selling price, day-old chicks (DOC), and feed prices, which impact profits (Kurnianto et al., 2018). In line with Allaily’s et al. (2022) statement, broiler chicken farming have not been able to increase profits for breeders, especially for small scale broiler chicken rearing. High operational costs, especially fees rations are one of the factors that cause profits for small farmers. To reduce these risks, many farmers enter into partnerships with livestock companies. This partnership model helps ensure stable and productive broiler farming in terms of productivity, quantity, quality, and efficiency (Setyawan et al., 2017). The partnership system in Indonesia is regulated by the Regulation of the Minister of Agriculture of the Republic of Indonesia Number 13/PERMENTAN/PK.240/5/2017 concerning Livestock Business Partnerships.
In principle, every business, including broiler chicken farming, aims to achieve optimal profits. Profitability in livestock farming is influenced by various factors, including breeding, feeding, management, and financial factors (Arrienda II et al., 2010; Amam et al., 2019). Broiler chicken farming activities will incur various costs. Effective cost management and benefit analysis will lead to optimal profits for the business. Therefore, a business performance analysis is required to determine the extent of profits and cost efficiency in livestock farming. This analysis compares the income from sales with the operational costs incurred. This performance analysis aims to assess how well broiler chicken farming is in generating profits while considering the cost efficiency achieved. Furthermore, a strategy analysis determines the most suitable strategies for developing the business and ensuring optimal profits (Farida and Setiawan, 2022).
The performance analysis in this research includes profitability analysis, R/C ratio, and Break-Even Point (BEP). Profits can be achieved when the total revenue exceeds the total expenses. The higher the difference between revenue and expenses, the greater the profits, which can be economically interpreted as a sustainable and viable business. Conversely, if the difference between revenue and expenses is low, the business experiences losses and is not economically viable to continue (Kurnianto et al., 2018). The R/C ratio is an analysis that calculates the ratio of total revenue to total production costs to measure the efficiency of input utilization. If the ratio is >1, the business is considered efficient, meaning that as the R/C ratio increases, the returns to the farmer also increase. If R/C <1, the business is inefficient, meaning the farmer experiences losses (Murti et al., 2020).
The Break-Even Point (BEP) analysis is used to determine at what level of sales and at what selling price the company reaches the break-even point, where it neither makes a profit nor experiences a loss. This analysis simplifies the farmer’s ability to understand the sales level and selling price at which the business will break even, covering the expenses incurred by the breeder. The product price can be determined by calculating the value of BEP, ensuring that the predetermined product price does not result in losses (Murti et al., 2020).
Camara Farm adopts the nucleus-plasma partnership model of contract farming to increase business efficiency (Kusumastuti and Widiati, 2022). Contract farming refers to a binding agreement between two parties consisting of an agricultural product processing company (contractor) and an individual producer (contract recipient), which in this case, is the owner of Camara Farm. They engage in ‘future agreements’, with clear obligations and rewards for the broiler production and facilities to support said production. This arrangement essentially allows the company to exert influence over the production process delegated to independent farms as long as it is consistent with its objectives (Maria et al., 2008).
As the partner breeder, Camara Farm provides housing and labor, while the livestock company provides production facilities such as day-old chicks, feed, medicines, vitamins, technical guidance, and marketing. Camara Farm is a large-scale community-based poultry farm in the Cigendel Village, Pamulihan District, Sumedang Regency. Based on the description above, this research is necessary to extend previous research on profitability analysis in broiler chicken farming at Camara Farm. This research aims to determine the performance of the broiler chicken farming business carried out by Camara Farm (profits, the comparison between profits and costs, and the break-even point) and to identify strategies for developing Camara Farm’s broiler chicken business.
MATERIALS AND METHODS
Research object
The object of this research is the performance data and business development strategies from Camara Farm, a broiler chicken business with a closed house rearing system. The data consisted of financial reports spanning 6 periods (1 year). It was then analyzed for profitability, Break-Even Point (BEP), and efficiency (R/C ratio).
Research location
The Camara Farm, located in Cigendel village, Pamulihan District, Sumedang Regency, was purposefully selected as the research location. This selection was based on the following considerations:
- Camara Farm operates a broiler chicken farm with a closed house rearing system and follows a partnership model; and
- Camara Farm is the only medium-scale broiler chicken business in the village.
Data collection
The data used in this research consists of primary and secondary data. Primary data in this research was obtained by conducting interviews with informants, namely business owners. Meanwhile, secondary data in this research which includes analysis of Camara Farm’s financial reports over 6 periods (1 year) obtained from the owner. We also reviewed the literature by studying various sources related to the research object.
Analysis method
This research is a case study at Camara Farm, using a descriptive quantitative analysis method, where the research results, in the form of performance analysis calculations, will be described. According to Yusuf (2014), descriptive quantitative analysis is an approach where quantitative information is obtained to address a problem. The performance analysis of the company conducted in this research includes:
Profit analysis
Profit is the result of the difference between revenue and total production costs. The calculation formula for profit used in this study was as follows:
Total production costs
TC=TFC+TVC
Where; TC= Total Cost (Rp/Period), TFC= Total Fixed Cost (Rp/Period), TVC= Total Variable Cost (Rp/Period).
Total revenue
TR=Q × PQ
Where; TR = Total Revenue (Rp/Period), Q= Total Production Quantity (Bird/Periode), PQ = Selling Price (Rp/Bird).
Net revenue
NR=TR - TC
Where; NR= Nett Revenue (Rp/Period), TR= Total Revenue (Rp/Period), TC= Total Cost (Rp/Period)
R/C (Revenue Cost Ratio) analysis
R/C ratio analysis is the comparison between total revenue and cost. R/C analysis is used to determine whether the business is profitable or not (Kurnianto et al., 2018). The calculation formula for R/C used in this study was as follows:

Where; R= Revenue (Rp/Period), C= Cost (Rp/Period), TR= Total Revenue (Rp/Period), TC= Total Cost (Rp/Period), Here are the criteria for R/C analysis: R/C > 1, profitable, R/C = 1, break-even, R/C < 1, non-profitable.
BEP (Break Event Point) analysis
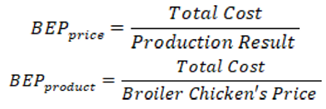
The Break-Even Point is the point at which the company neither experiences a loss nor a profit. BEP analysis is used to determine the point at which sales break even and cover the expenses incurred by the farmer (Gultom et al., 2018). The calculation formula for BEP used in this study was as follows:
SWOT analysis
Analysis of broiler chicken business development strategies in this research was carried out by identifying internal and external factors using SWOT analysis. SWOT analysis is a strategic planning method for evaluating the factors that influence a business in achieving goals, both short-term and long-term goals. These factors consist of internal factors (strengths, weaknesses) and external factors (opportunities, and threats) (Hubeis and Najib, 2014).
Internal factor analysis
The factors that constitute the company’s strengths and weaknesses are formulated into an internal strategy using the IFAS (Internal Factors Analysis Summary) matrix. The results of the IFAS matrix analysis obtained aim to identify how much strengths and weaknesses can influence business continuity and the company’s response to these internal factors (Rusmiyati, 2017).
External factor analysis
The company’s opportunity and threat factors are formulated as an external strategy using the EFAS (External Factors Analysis Summary) matrix. The results of the EFAS matrix analysis obtained aim to identify the extent of opportunities and threats that can influence business continuity and the company’s response to these external factors (Rusmiyati, 2017).
SWOT matrix
According to Rangkuti (2014), the SWOT matrix is a matrix that analyzes all internal and external factors to develop company strategy factors. This matrix will produce four sets of possible strategic alternative companies which are shown in Table 1.
- S-O strategy is a strategy that must be able to use strengths while taking advantage of existing opportunities
- The W-O strategy is a strategy that must be demonstrated to reduce the weaknesses faced and at the same time take advantage of existing opportunities
- The S-T strategy is a strategy that must be able to highlight strengths to overcome threats that may arise.
- The W-T strategy is a strategy that aims to overcome and minimize the impact of existing threats.
RESULTS AND DISCUSSIONS
Company overview
Camara Farm, a broiler chicken farming business, is located in Cigendel Village, Pamulihan District, Sumedang Regency. This broiler chicken farming business was established by Guntur Barus in 2005 with an initial population of 22,000 chickens, and it has been using a two-story closed-house system. Over time, Camara Farm has expanded and now includes two closed-house units, one equipment warehouse, one mess, and one feed warehouse, which can accommodate up to 63,000 broiler chickens per production period.
The broiler chicken farming activities at Camara Farm are organized based on the broiler cycle, which starts from preparing the house until harvesting. Each cycle lasts for 50 days, resulting in a total of 6 production periods per year. During the first 14 days, preparatory actions are taken, such as cleaning and sterilizing the house. On the 15th day, feeding and drinking equipment is installed, heating systems are activated, and on the 16th day, the day-old chicks (DOC) arrive. Chicken maintenance occurs from day 16 to 48, and the chickens are harvested on the 49th and 50th days.
|
IFAS and EFAS |
Strengths (S) |
Weakness (W) |
|
Determine internal strengths factors |
Determine internal weakness factors |
|
|
Opportunities (O) |
S-O Strategy |
W-O Strategy |
|
determine external opportunity factors |
Create a strategy that uses strengths to take advantages of opportunities |
Create strategies that minimize weaknesses to take advantage of opportunities |
|
Threats (T) |
S-T Strategy |
W-T Strategy |
|
determine external threats factors |
Create strategies that use strengths to overcome threats |
Create a strategy that minimizes vulnerabilities and avoids threats |
Table 2: Fixed costs of broiler chicken farming business per period with a business scale of 63.000 birds.
|
No |
Fixed cost |
Quantity (Year) |
Price (Rp) |
Value (Rp) |
|
1 |
Building depreciation |
20 |
2,400,000,000 |
20,000,000 |
|
2 |
Equipment depreciation |
10 |
374,500,000 |
6,242,000 |
|
Total fixed cost |
26,242,000 |
Camara Farm has partnered with PT Anjawani and PT Janu Putra Barokah, a nucleus company in the broiler industry, without a feed mill and small-scale breed production (Parent Stock), with a nucleus-plasma partnership model with Camara Farm. In this partnership, the nucleus company provides farming production facilities, including DOC, feed, vaccines, medications, disinfectants, and the distribution of plasma livestock products. The price of DOC, feed, and chemicals are determined in the cooperation agreement signed by the nucleus company and the plasma farmers. Anggriawan and Kurniawan (2020) stated that in a core-plasma partnership scheme, profit sharing is determined based on the agreement of both parties and in this partnership, the farmer as plasma provides cages and labor while the core party provides DOC, feed, medicine, and vaccine.
Cost and revenue analysis
Cost analysis
Fixed costs in broiler chicken farming include depreciation costs for the poultry house, equipment, and labor. The largest fixed cost is the depreciation of the poultry house, primarily due to the substantial construction cost with a 20-year economic life (Table 2). Camara Farm’s poultry houses have an average of 6 production periods per year. Other fixed costs include labor and equipment depreciation, such as feeding equipment, drinking equipment, heaters, thermoregulators, exhaust fans, gas cylinders, and lighting. The percentage of depreciation cost in this research is much lower than those reported by Horne (2020) in the Netherlands (8%). The total fixed costs and the percentage of fixed costs are presented in Table 3.
|
No |
Fixed cost |
Quantity (Person) |
Price (Rp) |
Value (Rp) |
|
1 |
Manager |
1 |
2,200,000 |
2,200,000 |
|
2 |
Production technician |
1 |
4,500,000 |
4,500,000 |
|
3 |
Mechanical and water technician |
1 |
2,000,000 |
2,000,000 |
|
4 |
Period workers |
6 |
1,800,000 |
10,800,000 |
|
5 |
Daily labor |
15 |
175,000 |
2,625,000 |
|
Total labor cost |
22,125,000 |
|||
Variable costs incurred by the farmer during the production process include chick costs (DOC), feed costs, vaccine, medication and other chemical costs, litter costs, electricity costs, and other expenses to support various operational activities (Table 4). In one production period, Camara Farm can operate with a population of 63,000 chickens, with an average price of Rp 8,450 per chicken per the agreed contract. Feed cost is the largest variable cost (71%) of total production costs, as confirmed by another similar research (Hastang et al., 2021; Sehabudin et al., 2020; Putri et al., 2020). Camara Farm uses processed feed types BR0 (fine crumble), BR11+ (crumble), and BR12G for starter, grower, and finisher phases. Feed and water are provided ad libitum. In addition to chicks, feed, medicines, litter, electricity, and gas, other expenses include cage lime, detergent, twine, engine oil, gasoline, harvesting costs, consumption costs, and village security expenses.
Table 4: Variable costs of broiler chicken farming business per period with a business scale of 63,000 birds.
|
No |
Variable cost components |
Average cost (Rp) |
Percentage (%) |
|
1 |
DOC |
532,350,000 |
21.55 |
|
2 |
Feed |
1,650,027,708 |
71.03 |
|
3 |
Vaccine and medicines |
35,730,915 |
1.33 |
|
4 |
Litter |
20,760,000 |
0.84 |
|
5 |
Electricity |
20,593,040 |
1.08 |
|
6 |
Gas |
28,750,000 |
1.33 |
|
7 |
Others |
11,995,000 |
0.89 |
|
Total variable cost |
2,294,206,664 |
97.94 |
Table 5: Total cost per production period.
|
No |
Description |
Price (Rp) |
|
1 |
Fixed cost |
48,367,000 |
|
2 |
Variable cost |
2,294,206,664 |
|
Total cost |
2,342,573,664 |
Simanjuntak (2018) states that the total cost is the sum of fixed and variable costs incurred by the farmer during one production cycle. Variety in production costs was also influenced by the contract prices based on the prices set by the input market (Sehabudin et al., 2022). Total cost (TC) is the overall cost incurred by the farmer per production period (one production cycle). The total cost during the production period is shown in Table 5.
Production revenue
The production revenue at Camara Farm comes from the sale of chickens and the sale of chicken manure (litter). The chickens are sold directly by partner II, while the chicken litters are sold directly by the breeder to other farmers. The average depletion of the number of chickens in each period is 4.14%, or 2,610 chickens, including deaths, culling, and donations to local organizations around the farm. The lower mortality rate in period 6 results in a significant increase in profit. Lembong et al. (2015) also state that farm profitability is influenced by the population that can be maintained in a poultry house, as it increases the number of kilograms of poultry sold and enhances fixed cost efficiency. The average kg of chicken sold in Camara Farm (1,79) is also lower than other research results (1,83) (Laode Geo et al., 2020). The lower sales in periods 1-2 were due to the low average chicken body weight at harvest, as against the normal broiler body weight standard at 5 weeks (1.9-2.0 kg) (Pakage et al., 2020).
The average acceptance from chicken production, the average acceptance from chicken manure sells, and the average total production revenue in 6 production periods are shown in Table 6, 7 and 8, respectively.
Table 6: Average revenue from chicken production with a population of 63,000 birds.
|
Period |
Selling price (Rp) |
Average weight (Kg) |
Production (Kg) |
Total (Rp) |
|
1 |
21,381 |
1,61 |
100,632 |
2,151,605,415 |
|
2 |
21,351 |
1,635 |
101,222 |
2,161,184,415 |
|
3 |
21,778 |
1,89 |
112,871 |
2,458,112,765 |
|
4 |
22,339 |
1,78 |
108,685 |
2,427,957,820 |
|
5 |
22,092 |
1,83 |
114,146 |
2,521,740,490 |
|
6 |
22,424 |
2,015 |
124,304 |
2,787,448,213 |
|
Average |
21,894 |
1,794 |
110,310 |
2,418,008,186 |
Table 7: Acceptance of chicken manure.
|
Period |
Selling price (Rp) |
Production (Sack) |
Total (Rp) |
|
1 |
3,500 |
3,354 |
11,739,000 |
|
2 |
3,500 |
3,300 |
11,550,000 |
|
3 |
3,500 |
3,350 |
11,725,000 |
|
4 |
3,500 |
3,397 |
11,889,100 |
|
5 |
3,500 |
3,330 |
11,655,000 |
|
6 |
3,500 |
3,388 |
11,858,200 |
|
Average |
3,500 |
3,353.2 |
11,736,083 |
Table 8: Average total production revenue.
|
Period |
Revenue |
Total |
|
|
Broiler production (Rp) |
Litter sacks (Rp) |
||
|
1 |
2,151,605,415 |
11,739,000 |
2,162,994,415 |
|
2 |
2,161,184,415 |
11,550,000 |
2,172,384,415 |
|
3 |
2,458,112,765 |
11,725,000 |
2,469,332,765 |
|
4 |
2,427,957,820 |
11,889,100 |
2,438,837,920 |
|
5 |
2,521,740,490 |
11,655,000 |
2,532,729,490 |
|
6 |
2,787,448,213 |
11,858,200 |
2,798,627,413 |
|
Total |
14,508,049,118 |
70,416,500 |
14,574,906,418 |
|
Average |
2,418,008,186 |
11,736,083 |
2,429,151,070 |
Profitability analysis and R/C analysis
Table 9 shows that the highest total revenue and efficiency level in the last year was in period 6, at Rp. 2,799,306,213 and 8.55%. Although the production costs incurred were higher than in the previous periods, the 6th-period production yielded higher total bird weight and revenue. The higher cost from the increasing feed and chick costs can be solved by the higher selling price of chickens. Plasma partnership contracts enabled profits to be maintained even with higher production costs. The average income per period over the past year was Rp. 87,170,606, and the average efficiency rate of 3.31%, much lower than the results obtained in other closed-house farms, which can reach 9.48% with a population of 44,000 chickens (Mukminah and Purwasih, 2019) and 8.8% for half the population size (Hastang et al., 2021).
Table 9: Profitability and efficiency analysis.
|
Period |
Total revenue (Rp) |
Total production cost (Rp) |
Profitability (Rp) |
Efficiency (%) |
|
1 |
2,163,344,415 |
2,170,747,616 |
-7,403,201 |
-0.34 |
|
2 |
2,172,734,415 |
2,193,137,336 |
-20,402,921 |
-0.94 |
|
3 |
2,469,837,765 |
2,385,743,803 |
84,093,962 |
3.40 |
|
4 |
2,439,847,920 |
2,285,787,776 |
154,059,544 |
6.31 |
|
5 |
2,533,395,490 |
2,460,178,704 |
73,216,786 |
2.89 |
|
6 |
2,799,306,213 |
2,559,846,748 |
239,459,465 |
8.55 |
|
Avg. |
2,429,744,270 |
2,342,573,664 |
87,170,606 |
3.31 |
Break even point (BEP) analysis
Break Even Point (BEP) is the level of production sales for a specific period equal to the costs incurred so the farmer does not incur losses and reaches a break-even point (Heisinger and Hoyle, 2012; Rentsen et al., 2023). According to Gultom et al. (2018), BEP positively affects profitability, meaning that the higher the BEP, the higher the profitability. Based on Table 10, the average BEP unit obtained by Camara Farm for each period over a year was 101,590.53 kg of chickens. At this point, the farmer neither incurs a loss nor makes a profit; it is a break-even point. This means that if sales are below BEP, the farmer will incur losses, but if sales are above BEP, the farmer will gain profits. The average BEP in rupiah obtained per period over the year was Rp. 2,187,762,256. Therefore, to reach the break-even point in one period, the farmer must strive to produce chickens that yield total sales equal to that amount.
|
Period |
BEP price (Rp) |
BEP unit (Kg) |
|
1 |
3,560,499,296 |
166,525.96 |
|
2 |
6,367,051,917 |
298,207.84 |
|
3 |
984,692,298 |
45,214.79 |
|
4 |
616,312,932 |
27,588.57 |
|
5 |
1,109,489,534 |
50,220.63 |
|
6 |
488,527,560 |
21,785.42 |
|
Average |
2,187,762,256 |
101,590.53 |
Table 11: IFAS matrix of the Camara broiler camara farm business.
|
No. |
Internal factor |
Value |
Rating |
Score |
|
Strength (S) |
||||
|
1. |
Good breed and feed quality |
0,12 |
2 |
0,24 |
|
2. |
Availability of adequate equipment |
0,11 |
3 |
0,33 |
|
3. |
Clear marketing strategy from the partner |
0,16 |
3 |
0,48 |
|
4. |
Availability of loans and financial performance from partners |
0,15 |
4 |
0,6 |
|
5. |
Ownership of land and farm capital |
0,12 |
5 |
0,6 |
|
Total strength value |
2,25 |
|||
|
Weakness (W) |
||||
|
1. |
Limited capital |
0,09 |
2 |
0,18 |
|
2. |
Outdated or limited equipment |
0,09 |
3 |
0,27 |
|
3. |
Weak bargaining position from the breeders |
0,08 |
3 |
0,24 |
|
4. |
The limited capacity of farm officers and task division |
0,08 |
3 |
0,24 |
|
Total weakness value |
0,93 |
|||
|
Total IFAS |
1 |
3,18 |
||
Table 12: EFAS Matrix of the Camara Broiler Camara Farm Business
|
No. |
External factors |
Value |
Rating |
Skor |
|
Opportunities (O) |
||||
|
1. |
High growth of the broiler industry |
0,14 |
3 |
0,42 |
|
2. |
The trend of increasing chicken consumption |
0,1 |
4 |
0,4 |
|
3. |
Government support for partnerships in the poultry industry |
0,1 |
2 |
0,2 |
|
4. |
Availability of labor, breed and feed resources |
0,1 |
2 |
0,2 |
|
5. |
Diversification of business profits |
0,1 |
3 |
0,3 |
|
Total opportunities value |
1,52 |
|||
|
Threats (T) |
||||
|
1. |
Increased competitors in the broiler chicken industry |
0,09 |
3 |
0,27 |
|
2. |
The threat of disease outbreaks |
0,14 |
3 |
0,42 |
|
3. |
Fluctuations in breed and feed prices |
0,13 |
4 |
0,52 |
|
4. |
Changes in government regulations |
0,1 |
2 |
0,2 |
|
Total threats value |
1,41 |
|||
|
Total EFAS |
1 |
2,93 |
||
Business development strategy
Analysis of internal-external factors
A business’s development must be systematically strategized to maintain profits above the calculated BEP. The internal and external environmental factors of Camara Farm were analyzed and are presented in Tables 11 and 12, respectively.
After the internal and external environmental analysis, the IFAS and EFAS matrix analysis was carried out. The total internal factor score obtained was 3.18. The IFAS matrix shows that the internal strength factors that play a dominant role in the development of Camara Farm’s broiler chicken farming business are the availability of loans and financial performance from partners and having their own land and housing capital, both with a score of 0.60. The total external factor score obtained was lower than the internal factors (2.93). The dominant opportunities for Camara Broiler Farm are the high growth of the broiler industry (0.42), and the dominant threats are fluctuations in DOC and feed prices (0.52)
The results obtained from calculating the IFAS and EFAS matrices are then used to prepare the Internal-External (IE) matrix. The IE matrix is used to obtain a more detailed business strategy so that the position of the broiler chicken farming business at Camara Farm can be known. The IE matrix is divided into 9 cells, as presented in Figure 1. The total score in the IFAS matrix is 3.18, and the EFAS matrix’s is 2.93. This score places the broiler chicken farming business at Camara Farm in cell IV, namely Grow and Build (Abdillah and Arnila, 2019). This shows that the company needs a strategy to grow and develop the company for the better.
SWOT analysis
A SWOT matrix was used to systematically identify and develop strategic factors for Camara Farm broiler chicken farming. The matrix was formulated based on the
Table 13: Formulated SWOT matrix of Camara broiler farm.
|
IFAS and EFAS |
Strengths (S) |
Weakness (W) |
|
1. Good breed and feed quality 2. Availability of adequate equipment 3. Clear marketing strategy from the partner 4. Availability of loans and financial performance from partners 5. Ownership of land and farm capital |
1. Limited capital 2. Outdated or limited equipment 3. Weak bargaining position from the breeders 4. The limited capacity of farm officers and task division |
|
|
Opportunities (O) |
S-O Strategy |
W-O Strategy |
|
1. High growth of the broiler industry 2. The trend of increasing chicken consumption 3. Government support for partnerships in the poultry industry 4. Availability of labor, breed and feed resources 5. Diversification of business profits |
1. Strive to use better quality DOC and feed to partners to increase business results and grow the broiler industry (S1, O1); 2. Develop a production plan according to market conditions to meet the trend of increasing chicken consumption, such as certain holidays (S3, O2); and 3. Expanding the stable to increase business scale; increasing the efficiency of existing resources, facilities and workforce; optimizing capital facilities and resources from partners; following the growth of the broiler chicken industry; and increasing profits from sales of gross husks (S2, S4, S5, O3, O4, O5). |
1. Increase farmer experience to improve broiler chicken farming performance (W3, W4, O1, O3, O4); 2. Improved modern technology to increase cost efficiency (W1, W2); and 3. Develop diversification of business results, especially final products, to increase profits (O2, O5). |
|
Threats (T) |
S-T Strategy |
W-T Strategy |
|
1. Increased competitors in the broiler chicken industry 2. The threat of disease outbreaks 3. Fluctuations in breed and feed prices 4. Changes in government regulations |
1. Changing partnerships to stronger companies with their own breed and feed to increase access to higher quality resources, economic capacity and more stable target markets (S1, S3, S4, T1, T3); and 2. Improve maintenance and care patterns to avoid disease outbreaks and facilitate livestock control (S2, T2). |
1. Increase capital to prepare for fluctuations in DOC and feed prices (W1, T3); 2. Regularly upgrade farm equipment to overcome the threat of disease outbreaks and business competitors (W2, T1, T2); and 3. Increase the quality of human resources to improve farmers' bargaining position and understand and deal with changes in government regulations (W3, W4, T4). |
obtained IFAS and EFAS matrix ratings. The SWOT matrix is presented in Table 13. The internal (strength and weakness) and external (opportunity and threat) factor values were combined to form a SWOT diagram. The SWOT diagram is presented in Figure 2.
The x and y coordinates in the diagram were determined by the formula:
X coordinate = Total strength value - total weakness value
= 2.25 - 0.93
= 1.32
Y coordinate = Total opportunity value - total threat value
= 1.9 - 1.41
= 0.49
Both x and y coordinates in this research showed a positive value, putting Camara Broiler farming business in Quadrant I. Businesses in Quadrant 1 are considered to be very profitable business. The business, therefore, can support an aggressive growth strategy to exploit all possible opportunities and promote its prime condition to achieve maximum growth (Abdillah and Arnila, 2019). Business strategy analysis is essential to determine the best strategies that can be implemented to achieve optimal profitability.
The contract price-partnership model adopted by Camara Farm accommodates farmers to gain higher income than other partnership models, such as Makloon or rent (Sehabudin et al., 2022). It also provides several strengths to the business, such as contract protection against a drop in market prices below the cost of production (HPP), guaranteed access to high-quality day-old chicks (DOC), and the management of feed and medications by the nucleus-plasma partnership (Mahyudi and Husinsyah, 2019). The farm also employs a closed-house system that helps protect the chickens from diseases and external influences, improving performance and income (Febrianto et al., 2021).
However, Camara Farm will face challenges such as fluctuating feed and chick contract prices due to national or global threats, even though the partner contractor is able to suppress the changes. Inflation, electricity prices, gas, and other variable costs also tend to rise over time. As DOC, cage area, feed, and operational cost are the 4 variables that most influence the total broiler production, this instability in farm performance can result in greater losses (Djumadil and Syafie, 2020; Suwarta and Hanafie, 2021). Competition with other broiler chicken businesses and potential contract changes can also be detrimental in the longer term. Camara Farm needs to focus on its business development to maintain income above the BEP and increase profitability.
Improvements can enhance farm development, such as maintaining stable cage performance. In a closed-house system, the farm should have environmental control equipment like air conditioning, heating, and ventilation (Patria, 2023). Camara Farm has been operating for more than 10 years with the same equipment, so most of their technology has been outdated and easily malfunction. If the equipment or system malfunctions, the farm’s performance can be disrupted, so regular technological update and maintenance are necessary.
Closed-house chicken farming also has growth potential due to the increasing demand of broiler chickens; both live and carcass. The demand for chicken meat in Indonesia, especially in Java, will continue to rise with the increasing population and economic development. Increasing broiler production through higher performance and farm population can also contribute to fulfilling the local chicken meat demand (Purnawan et al., 2021). Performance stability can be achieved by increasing the utilization of technology, knowledge, and good farming practices. Farmers can diversify their income sources, such as selling chickens or developing other by-products. The large land area is also one of the farm’s biggest economic advantages. Increased chicken populations also increased profitability (Utomo et al., 2015). The land where the broiler houses are located still has unused space, allowing the farmer to expand the houses to increase the broiler chicken population and optimize fixed and variable costs (Suwarta et al., 2012).
CONCLUSIONs and Recommendations
The average revenue for broiler chicken farmers in a closed-house system, as seen in the case study of Camara Farm in Cigendel Village, Sumedang, was approximately Rp. 2,429,744,270 for a year. The average total production cost was around Rp. 2,342,573,664, resulting in an average income of Rp. 85,266,184 and an efficiency rate of 3.31%. The average production quantity for broiler chickens was 110,301 kg, with an average weight of 1.79 kg per bird and a selling price of Rp. 21,894 per kg. The farm neither makes a profit nor incurs a loss (break-even) in Indonesian Rupiah when broiler chicken sales reach Rp. 2,187,762,256, or the total broiler production (Break-Even Point unit) was 101,590.53 kg.
Camara Farm’s strength lies on the stable loans, capital, financial support and farmers’ ownership, with an opportunity in the growing broiler industry. The main weakness is outdated equipment while threats include fluctuations in DOC and feed prices. Despite these challenges, Camara Farm is in a very profitable situation (Quadrant I). Greater benefits could be achieved by developing the farm’s potential, such as through building expansion, better management and price-contract partners, higher quality breed, feed, and human resources, increased business diversification, and farm’s technological advancement. It is concluded that this broiler farming is profitable for a year, and has potential to provide even higher benefits in the long run.
Novelty Statement
The novelty of this research lies in the size of the livestock business, namely a medium scale broiler farm with a core-plasma partnership model that located in West Java. This research shows the financial performance and the development strategy using SWOT analysis of the medium-scale closed house broiler chicken farm.
Author’s Contribution
Achmad Firman and Linda Herlina : Conceptualization, Supervision, Validation, and Writing Review. Eluzia Aloina Barus: Data Analysis, Writing Original Draft, Resources. Khansa Nurul Salsabilah: Writing Original Draft, Methodology, Editing.
Conflict of interest
The authors have declared no conflict of interest.
REFERENCES
Abdillah AH, Arnila H (2019). Broiler chicken farming business development strategy in South Sangatta District, East Kutai Regency. J. Integr. Agric., 7(1): 47-58. https://doi.org/10.36084/jpt..v7i1.182
Allaily, Septian AW, Daud M (2022). Analysis of broiler business with addition of probiotics and digestive enzyme in fermented ration. Integr. Anim. Husb. Sci. J., 10(2): 124–132. https://doi.org/10.23960/jipt.v10i2.p124-132
Amam, Fanani Z, Hartono B, Nugroho A (2019). The power of resources in independent livestock farming business in Malang District, Indonesia. IOP Conf. Series: Earth Environ. Sci., 372: 012055. https://doi.org/10.1088/1755-1315/372/1/012055
Anggriawan R, Kurniawan D (2020). The relation between broiler production management with its business analysis in Kediri District, East Java. J. Anim. Sci., 3(3): 205–211. https://doi.org/10.21776/ub.jiip.2020.030.03.05
Arrienda II FQ, Cruz C, Perilla M, Setiawan B (2010). Feasibility study of establishing an artificial insemination (Ai) center for carabaos in San Ildefonso, Bulacan, Philippines. J. Indonesian Trop. Anim. Agric., 35(2): 134-141. https://doi.org/10.14710/jitaa.35.2.134-141
Ayugustin, Sari FP, Oktarina Y (2022). Break event point analysis on broiler farms of Oku regency. Int. J. Soc. Sci., 2(2): 1329-1334. https://doi.org/10.53625/ijss.v2i2.2729
Campanhola C, Pandey S (2019). Chapter 33 agrifood systems. Sustainable food and agriculture, academic press. pp. 305-330. https://doi.org/10.1016/B978-0-12-812134-4.00033-9
Djumadil N, Syafie Y (2020). Analyses of factors affecting the production of broiler chickens in ternate. https://doi.org/10.2991/aer.k.200325.061
Farida I, Setiawan D (2022). Business strategies and competitive advantage: The role of performance and innovation. J. Open Innov. Technol. Market, Complex., 8(3): 163. https://doi.org/10.3390/joitmc8030163
Febrianto BS, Mastuti S, Hidayat NN (2021). Comparative analysis of the economic performance of broiler business with open house system and closed house system in Banyumas Regency. J. Anim. Sci. Technol., 3(2): 223-232.
Gultom LBN, Santoso SI, Suprijatna E (2018). Profitability and break point analysis of broiler chicken farming Damin farm in The Perbalan Village, Gunungpati, Semarang. J. Agribus. Sci., 2(2): 38–46.
Hastang, Asnawi A, Daryatmo, Meidiana T (2021). Analysis of the gross profit margin of broiler in the closed house at the Faculty of Animal Science, Hasanuddin University. IOP Conf. Ser. Earth Environ. Sci., 788: 012223. https://doi.org/10.1088/1755-1315/788/1/012223
Heisinger K, Hoyle J (2012). Managerial accounting. Washington D.C.: Saylor Foundation.
Horne PLM (2020). Economics of broiler production systems in the Netherlands; economic aspects within the greenwell sustainability assessment model. Wageningen, Wageningen Economic Research, Report 2020-027: 28.
Hubeis, M, Najib A (2014). Strategic Management in Developing Organizational Competitiveness. Jakarta, Indonesia: PT Elex Media Komputindo.
Indonesia (2009). Republic of Indonesia law number 18 of 2009 on livestock and animal health. Official Gazette of the Republic of Indonesia Year 2009, No. 84. Jakarta: State Secretariat.
Kurnianto A, Subekti E, Nurjayanti ED (2018). Business analysis of broiler chicken farming business with core-plasma partnership scheme (Case Study of PT. Bilabong Plasma Farmers in Limpung District, Batang Regency). Mediagro, 15(2): 47–57.
Kusumastuti TA, Widiatia R (2022). Availability of production inputs in broiler partnership in sleman regency Yogyakarta. Hasanuddin J. Anim. Sci., 4(2): 97-108. https://doi.org/10.20956/hajas.v4i2.20268
Laode GH, Saediman WOR, Ariani (2020). Profit and financial feasibility analysis of broiler chicken livestock in South Konawe district, Indonesia. IOP Conf. Ser. Earth Environ. Sci., 465: 012059. https://doi.org/10.1088/1755-1315/465/1/012059
Lembong, Joicke E, Santa NM, Makalew A, Elly FH (2015). Break event point analysis of broiler duck farming business (Case study of a duck business owned by the Masawang Group in Talikuran Village, Remboken District). Zootek J., 35(1): 39–45. https://doi.org/10.35792/zot.35.1.2015.6460
Mahyudi F, Husinsyah (2019). The role of broiler chicken-poultry in plasma PT. Ciomas Adisatwa to farm revenue (case study in Sarang Halang village Sub-district Pelaihari Tanah Laut Regency South Kalimantan Province). Ziraa’ah, 44(1): 28-35. https://doi.org/10.31602/zmip.v44i1.1592
Maria A, Catelo O, Costales AC (2008). Contract farming and other market institutions as mechanisms for integrating smallholder livestock producers in the growth and development of the livestock sector in developing countries. Rome, Italy Food Agric. Organ. Anim. Prod. Health Division.
Ministry of Agriculture of the Republic of Indonesia. (2017). Minister of Agriculture Regulation Number 13/PERMENTAN/PK.240/5/2017 concerning Livestock Business Partnerships. Jakarta: Ministry of Agriculture.
Mukminah N, Purwasih R (2019). The profitability of broiler chicken farming with different types of cages. Sci. J. Eng. Sci. Technol., 2: 1–6.
Murti AT, Suroto KS, Karamina H (2020). Analysis of the benefits of an independent pattern broiler chicken farming business in Malang regency (case study in Karangploso District, Malang regency). SOCA J. Sosial Ekonomi Pertanian, 14(1): 40–54. https://doi.org/10.24843/SOCA.2020.v14.i01.p04
Pakage S, Hartono B, Fanani Z, Nugroho BA, Iyai DA, Palulungan JA, Ollong AR, Nurhayati D (2020). Production performance measurement of broiler in closed house system and open house system in Kabupaten Malang Jawa Timur Indonesia. Indones. Anim. Sci. J., 15(4): 383-389. https://doi.org/10.31186/jspi.id.15.4.383-389
Patria CA (2023). Pattern of a two floors closed house on broiler at Edi Sujarwo Farm, Lampung Central Regency. J. Appl. Anim. Husb. (Peterpan), 4(2): 45-51. https://doi.org/10.25181/peterpan.v4i2.2706
Purnawan TA, Hidayat NN, Yuwono E (2021). Trends analysis of population and production of broiler commercial chicken partnership patterns (case study of PT Cemerlang Unggas Lestari in Banyumas Regency). ANGON J. Anim. Sci. Technol., 3(2): 214-222.
Putri ED, Cepriadi, Restuhadi F (2020). Analysis of production efficiency broiler chicken farm on pattern partnership of contract farming in Kampar District. J. Agribus. Commun. Empower., 3(1): 60-70. https://doi.org/10.32530/jace.v3i1.94
Rangkuti DF (2014). SWOT analysis techniques for dissecting business cases. Jakarta: PT. Gramedia Pustaka Utama.
Rentsen E, Chu-luundorj B, Natsagdorj T (2023). Optimization approach to constrained break even points with respect to price. iBusiness, 15: 183-191. https://doi.org/10.4236/ib.2023.153014
Respati AN, Hakim A, Kusuma AHA (2020). Comparation of production and financial analysis of broiler farm with close house and open house farm system in partnership patterns. Bantara J. Anim. Sci., 2(1): 1-7. https://doi.org/10.32585/bjas.v2i1.645
Rusmiyati (2017). Strategy for development of purebred chicken farming business broilers in Teluk Pandan District East Kutai Regency. Integr. Agric. J., 6(1): 59-73. https://doi.org/10.36084/jpt..v6i1.143
Sehabudin U, Daryanto A, Sinaga BM, Priyanti A (2020). The structure of costs and income of broiler chicken farming in different partnership patterns in Sukabumi Regency, West Java, Indonesia. Indones. J. Livest. Farm., 32(3): 380-387. https://doi.org/10.21776/ub.jiip.2022.032.03.09
Setyawan WI, Dahlan M, Wahyuning D (2017). Livestock business analysis broiler chickens partnership pattern in District Sumberejo District Bojonegoro. Livest. J. Sci. J. Fac. Anim. Husb. Lamongan Islamic Univ., 8(2). https://doi.org/10.30736/ternak.v8i2.20
Simanjuntak MC (2018). Analisis Usaha Ternak Ayam Broiler di Peternakan Ayam Selama Satu Kali Masa Produksi. J. Fapertanak, 3(1): 60–81. https://uswim.e-journal.id/fapertanak/article/view/152.
Statsenko E, Omarov R, Shlykov S, Nesterenko A, Rebezov M (2021). Chicken nuggets recipe and technology development with dietary fiber. Int. Trans. J. Eng. Manage. Appl. Sci. Technol., 12(11): 1-8. http://doi.org/10.14456/ITJEMAST.2021.230
Susanti HI (2023). A study of closed-house systems in broiler production. JIA (Sci. J. Agribus.): J. Agribus. Agric. Socioecon. Sci., 8(3): 214-219. https://doi.org/10.37149/jia.v8i3.188
Suwarta, Hanafie R (2021). The production risk of broiler farm management at plasma breeders: Evidence from Indonesia. J. Socioecon. Dev., 4(1): 134-144. https://doi.org/10.31328/jsed.v4i1.1501
Suwarta, Irham, Hartono S (2012). Cost and revenue structure of broiler chicken farming business in Sleman Regency. AGRIKA, 6(1): 65-85.
Utomo HR, Setyiawan H, Santoso SI (2015). Profitability analysis of livestock broiler business with partnership pattern in the District Limbangan Kendal. Anim. Agric. J., 4(1): 7-14. https://media.neliti.com/media/publications/187959-ID-none.pdf.
Yemima (2014). Analysis of broiler chicken farming businesses on people’s farms in Karya Bakti village, Rungan District, Gunung Mas Regency, Central Kalimantan Province. J. Trop. Anim. Sci., 3(1): 27–32.
Yusuf AM (2014). Research methods: Quantitative, qualitative, and combined research. Jakarta: Kencana.
To share on other social networks, click on any share button. What are these?

