Optimization of Laccase Production Parameters by Aspergillus niger from Different Eco-Logical Sites of Lahore
Optimization of Laccase Production Parameters by Aspergillus niger from Different Eco-Logical Sites of Lahore
Syeda Rubab Zaidi* and Safdar Ali Mirza
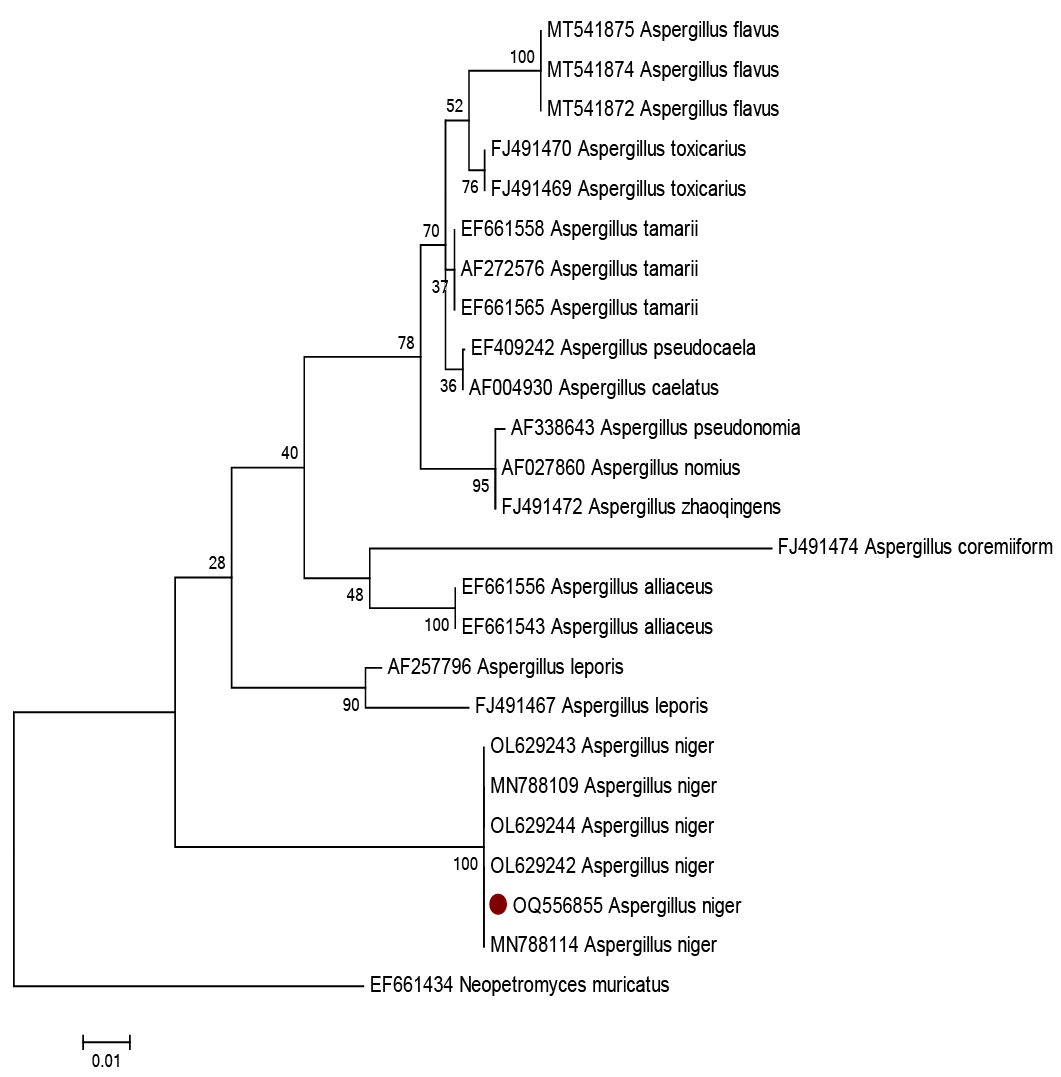
The evolutionary history was inferred by using the maximum likelihood method based on the Tamura 3-parameter model. A discrete Gamma distribution was used to model evolutionary rate differences among sites (5 categories (+G, parameter= 0.2474)). The analysis involved 25 nucleotide sequences. Evolutionary analyses were conducted in MEGA6. The sequence generated in the present study is marked with.
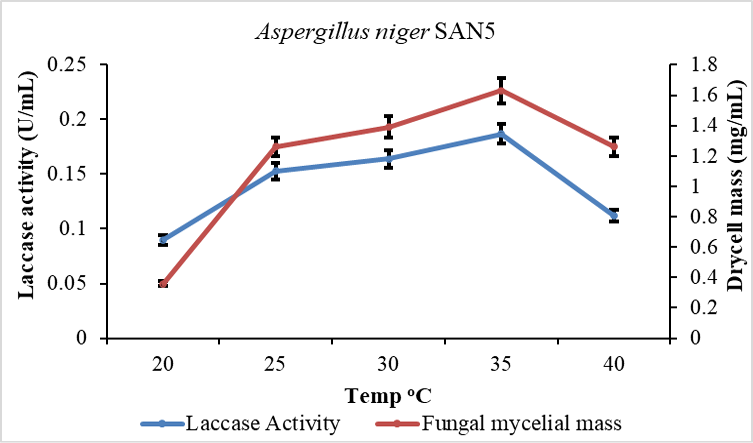
Optimization of temperature for laccase produce from Aspergillus niger (SAN5).
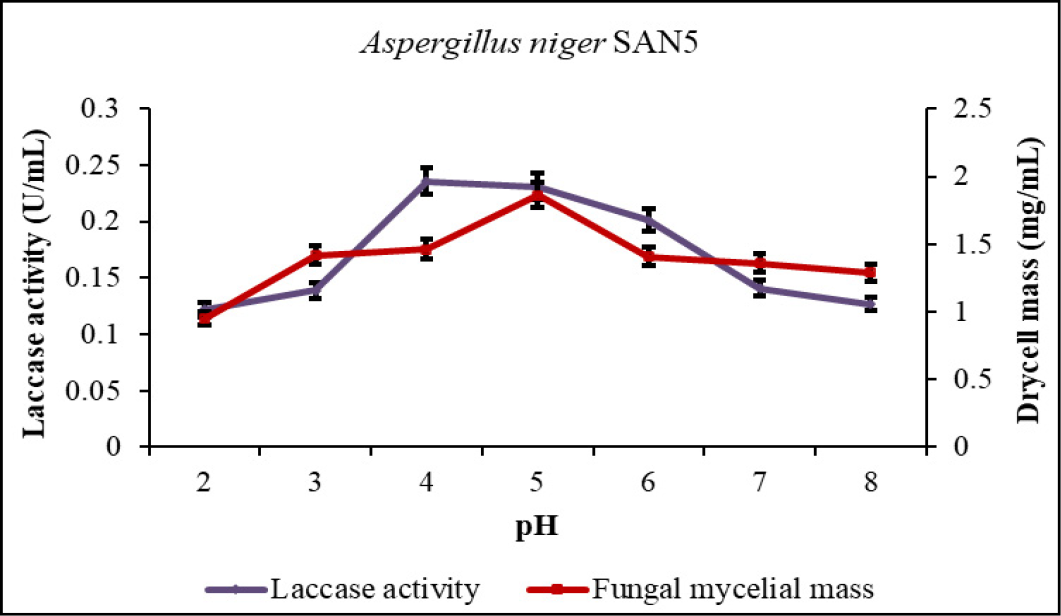
Optimization of pH for laccase production from Aspergillus niger (SAN5).
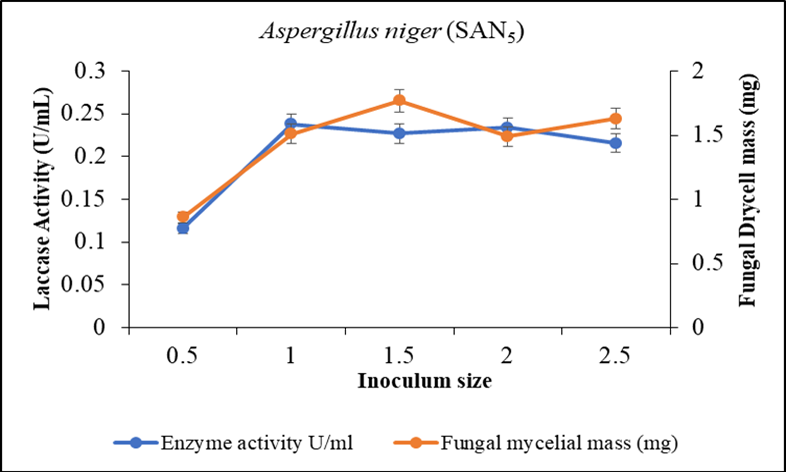
Optimization of size of inoculum for enzyme production from Aspergilluus niger (SAN5).
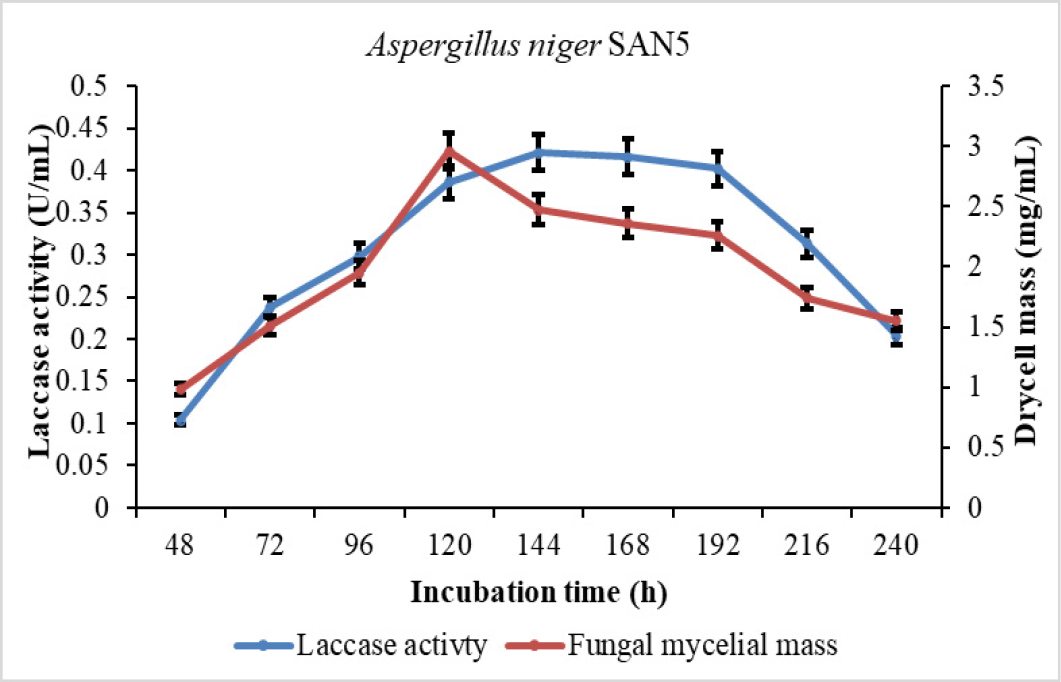
Effect of incubation time on the production of laccase and fungal mycelial mass of Aspergillus niger (SAN5).
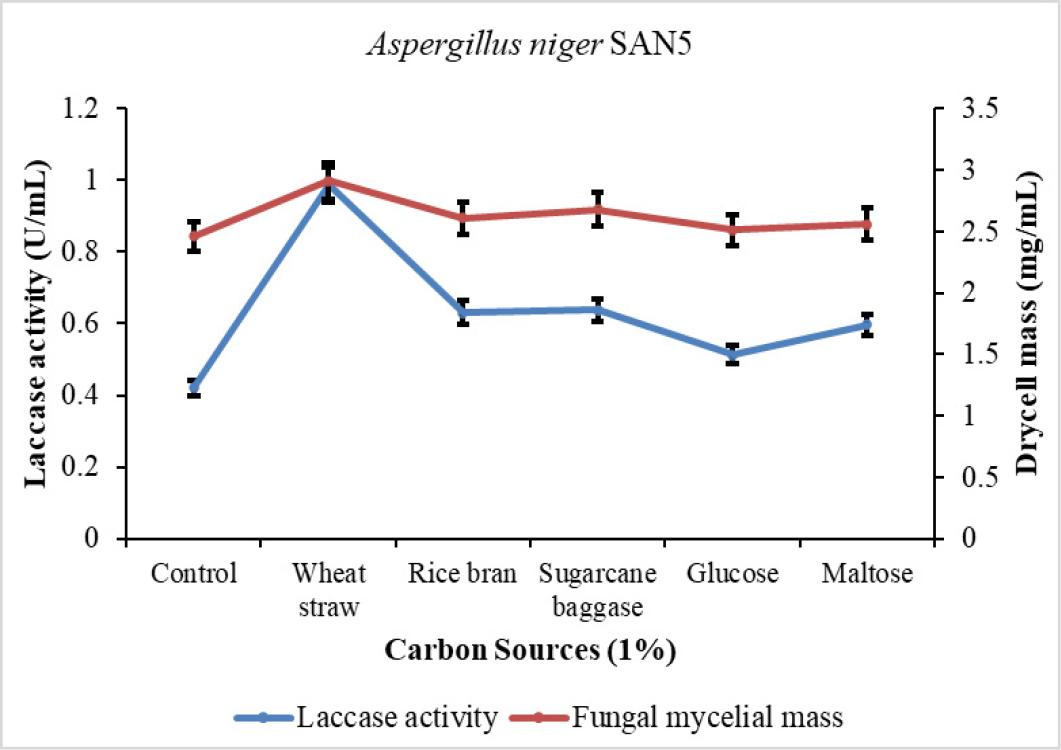
Carbon source optimization (1%) for production of laccase through Aspergillus niger (SAN5).
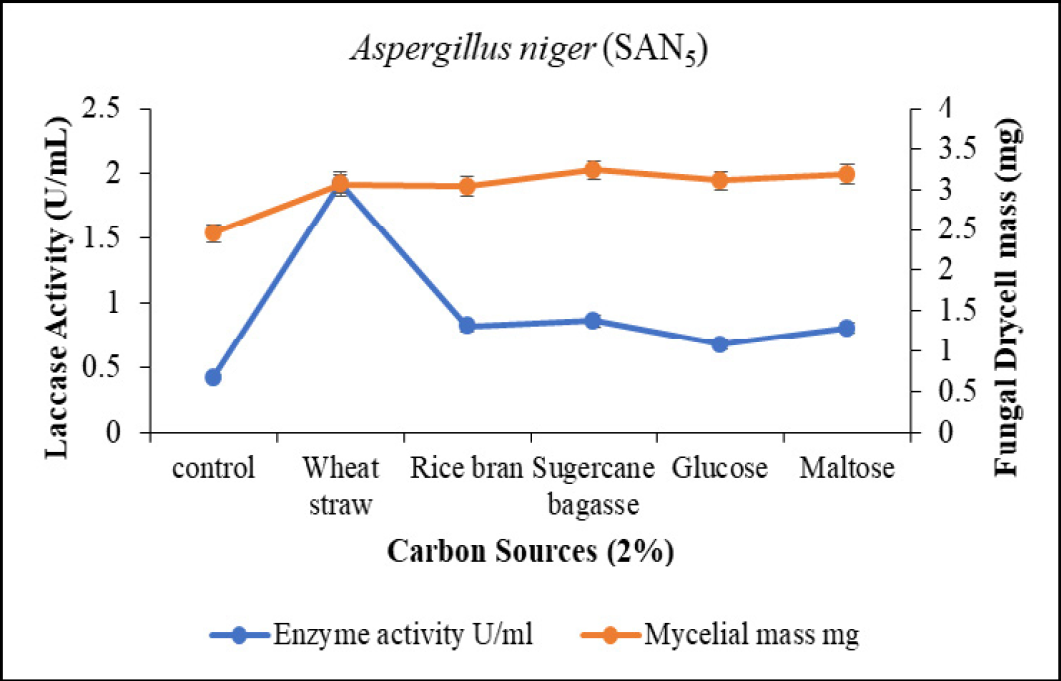
Carbon source optimization (2%) for production of laccase through Aspergillus niger (SAN5).
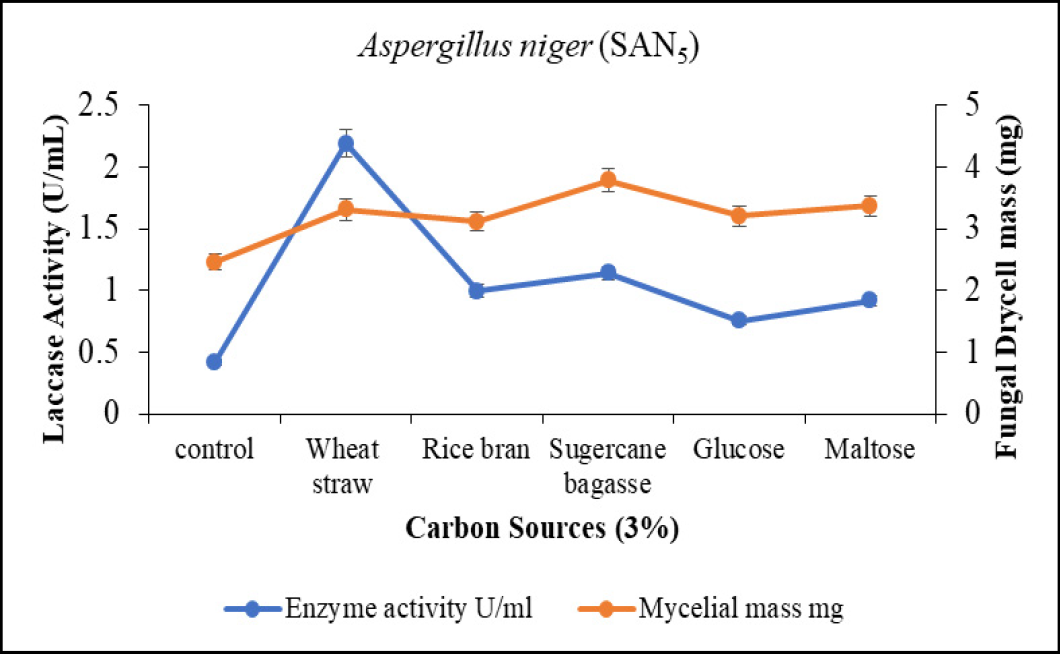
Carbon source optimization (3%) for production of laccase through Aspergillus niger (SAN5)
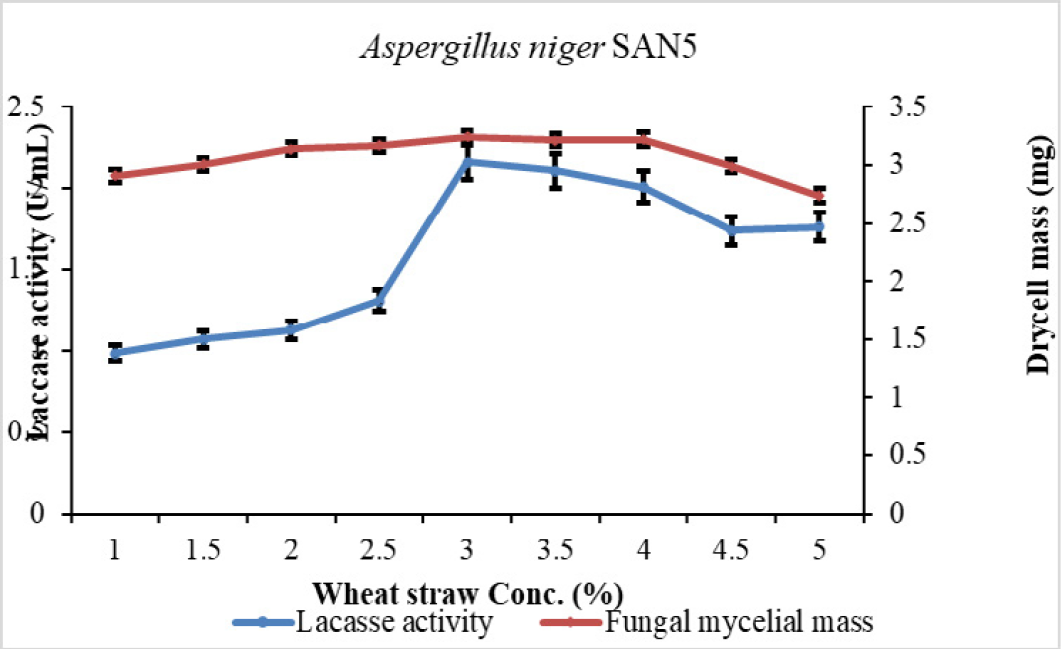
Wheat straw concentration optimization for laccase production through Aspergillus niger (SAN5).
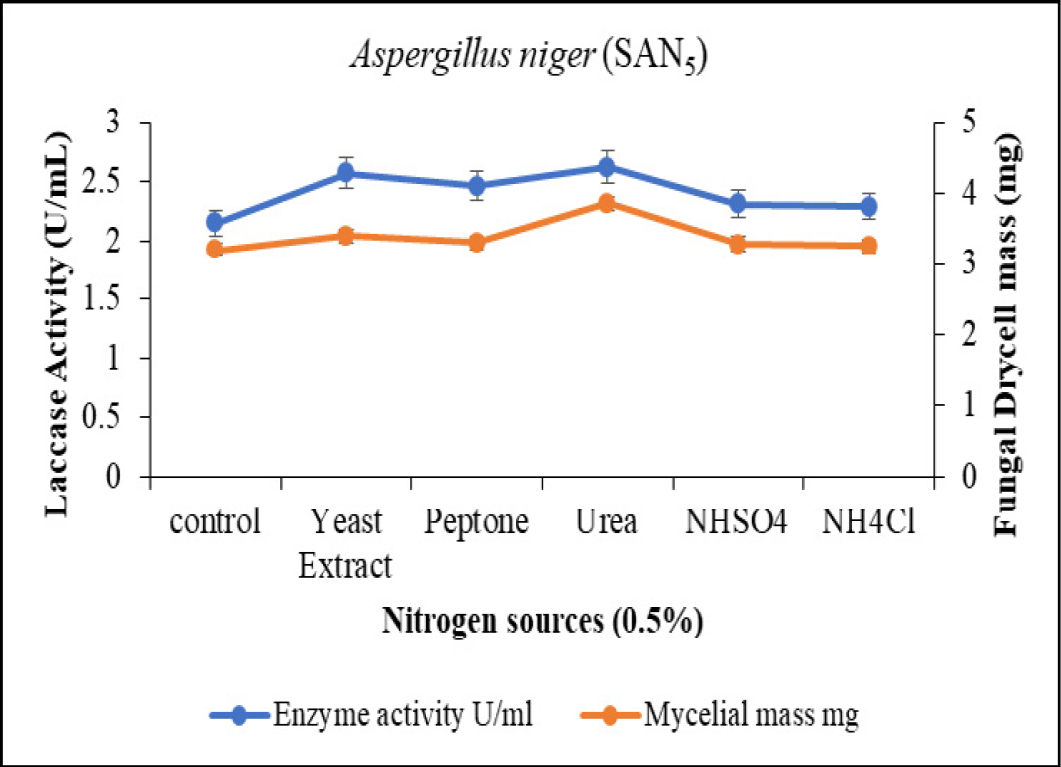
Nitrogen source optimization (0.5%) for laccase production through Aspergillus flavus (SAN5).
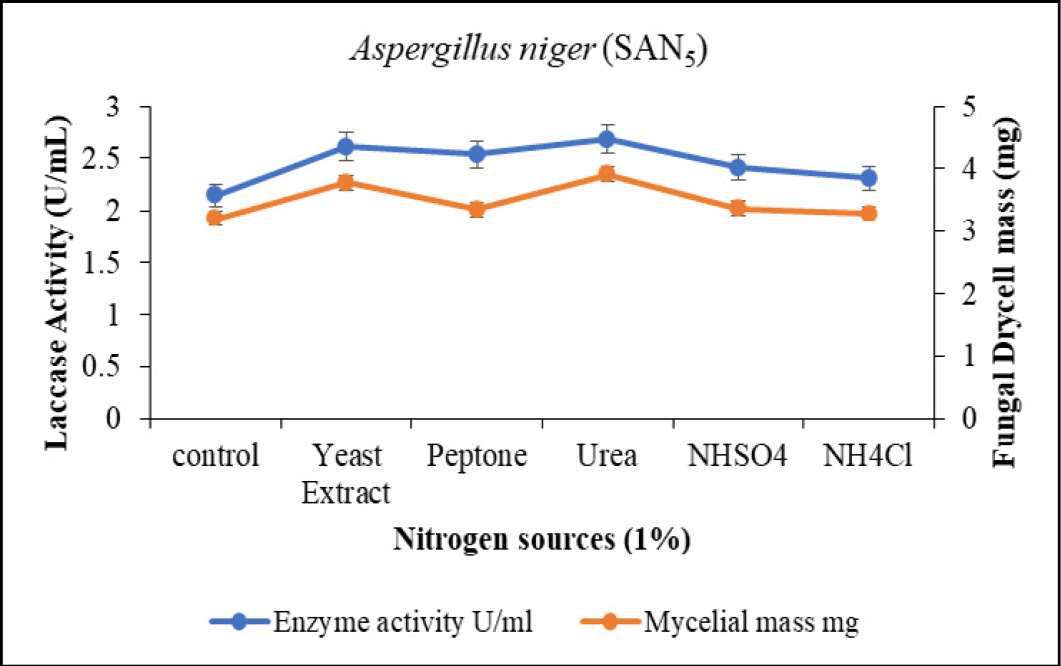
Nitrogen source optimization (1%) for production of laccase through Aspergillus niger (SAN5).
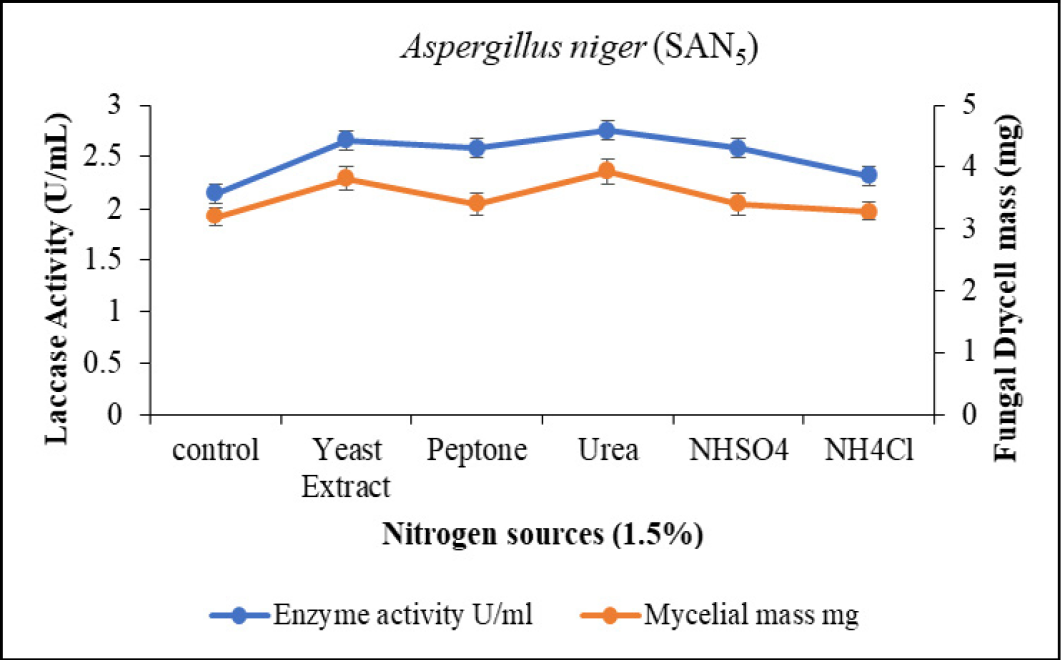
Nitrogen source optimization (1.5%) for production of laccase through Aspergillus niger (SAN5).
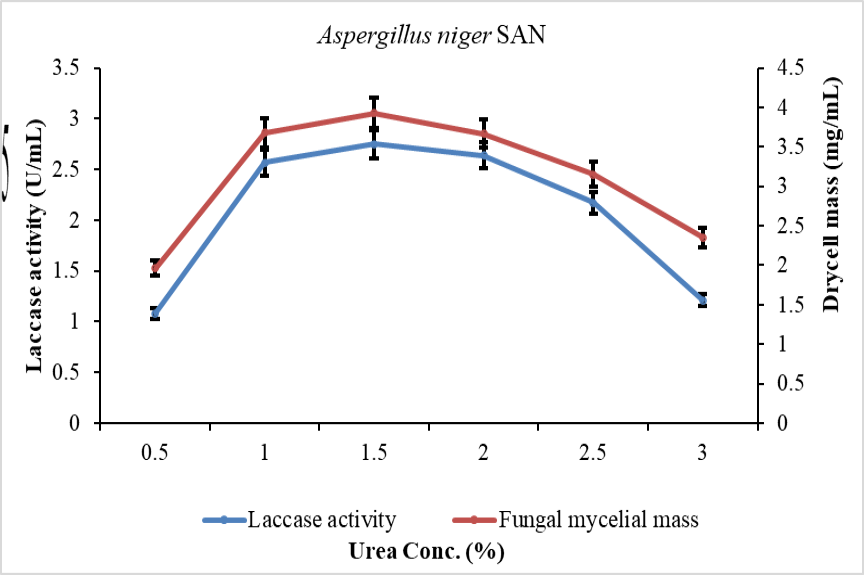
Optimization of urea concentration for laccase production from Aspergillus niger (SAN5).
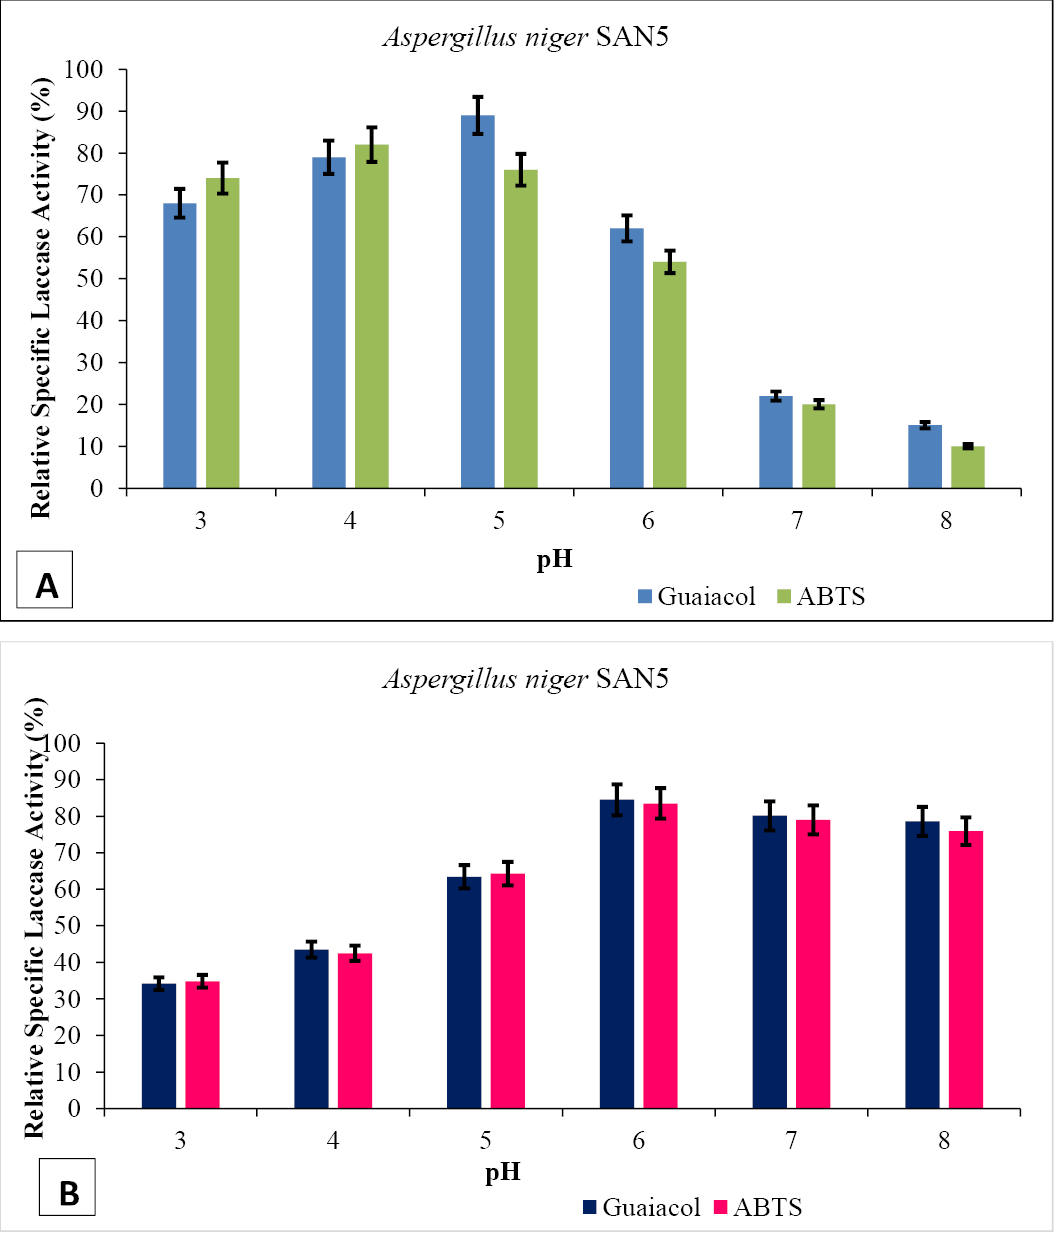
Effect of pH on crude enzyme (A), purified enzyme (B) produced by Aspergillus niger.
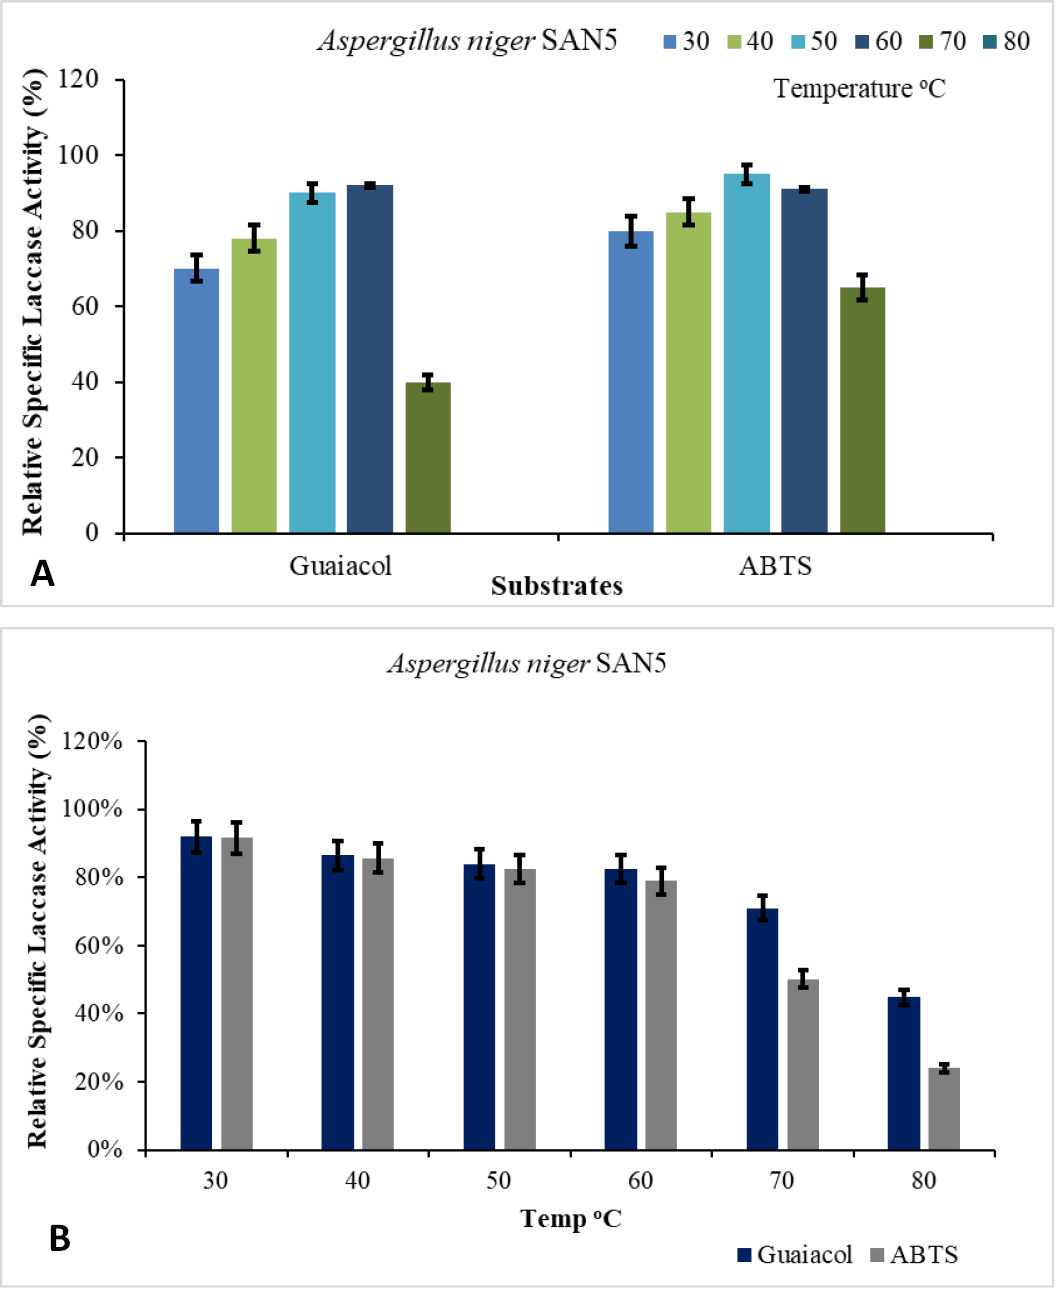
Effect of temperature on activity of crude enzyme (A), purified enzyme (B), produced by Aspergillus niger.


