

Optimization of Calcium and Phosphorous Ratio in the Pract ical Diet of Hypophthalmichthys molitrix


Optimization of Calcium and Phosphorous Ratio in the Practical Diet of Hypophthalmichthys molitrix
Sehrish Ishtiaq1, Mahroze Fatima1*, Syed Zakir Hussain Shah2, Noor Khan3, Muhammad Bilal4, Maryam2 and Sobia Nisa1
1Department of Fisheries and Aquaculture, University of Veterinary and Animal Sciences, Lahore, Pakistan.
2Department of Zoology, University of Gujrat, Gujrat, Pakistan.
3Institute of Zoology, University of the Punjab, Lahore, Pakistan
4School of Life Science and Food Engineering, Huaiyin Institute of Technology, Huaian, 223003, China
ABSTRACT
An experiment of 90-days was performed to investigate the effects of dietary calcium (Ca), phosphorus (P) and their interaction on growth, whole-body composition, nutrient digestibility and mineralization of silver carp, Hypophthalmichthys molitrix (average initial weight 13.7 ± 0.05 g). Nine isonitrogenous, isocaloric and isolipidic diets with three Ca levels (0, 1 and 2%) combined with three P levels (0, 1 and 2% P) were prepared. Results showed that silver carp fed the diet supplemented with 1% Ca and 1% P level yielded the similar (p > 0.05) growth performance as was recorded for that fed diet containing 2% Ca and 2% P. No significant difference in survival rate was recorded except for the diet containing 1% Ca with 2% P supplement. The feed intake (FI) of juvenile remained unaffected (p > 0.05) by mineral supplementation. Whole body protein content increased (p < 0.05) slightly with Ca and P supplementation. However, moisture, fat and ash contents remained unaffected (p > 0.05). Dietary Ca and P supplementation improved (p < 0.05) the protein and fat digestibility in silver carp. Ca and P contents showed significant increase (p < 0.05) with increasing Ca and P levels in the whole body, bones and scales, achieving the highest (p < 0.05) values at 2% Ca supplemented with 2% P. Whereas, Mg and Zn contents decreased (p < 0.05) with increasing Ca and P supplementation. Fish fed the diet containing 2% Ca level without P supplement had higher (p < 0.05) Ca/P ratio in whole body and bones. However, it decreased (p < 0.05) at 2% Ca level in scales. Further, increase in P supplementation significantly reduced (p < 0.05) Ca/P ratio regardless of Ca level. Conclusively, supplementation of 1% Ca in the presence of 1% P (1:1 ratio) is required for optimum performance of silver carp.
Article Information
Received 15 May 2022
Revised 18 June 2022
Accepted 05 July 2022
Available online 15 September 2022
(early access)
Published 01 October 2023
Authors’ Contribution
SI conducted the experiment. MF planned and supervised the experiment. SZHS and NK helped in analysis. MB helped in writing the manuscript. Maryam and SN helped in experiments.
Key words
Ca:P, Calcium lactate, Disodium phosphate, Growth, Nutrient digestibility, Body chemical composition
DOI: https://dx.doi.org/10.17582/journal.pjz/20220515090536
* Corresponding author: [email protected]
030-9923/2023/0006-2639 $ 9.00/0
Copyright 2023 by the authors. Licensee Zoological Society of Pakistan.
This article is an open access article distributed under the terms and conditions of the Creative Commons Attribution (CC BY) license (https://creativecommons.org/licenses/by/4.0/).
Introduction
Calcium (Ca) and phosphorous (P) are essential minerals for optimum growth and physiology of fish. They constitute up to 70% of total mineral elements in fish body (Hossain and Yoshimatsu, 2014). Calcium has important key roles in skeletal development, muscle contraction, osmoregulation, blood clotting, neuro-transmission and enzyme activation in fish (NRC, 2011). As Ca-binding proteins act as a carrier for binding of Ca and P intestine, hence, Ca is vital for P utilization as well (Brody, 1998). Most of the aquatic species can fulfil their Ca requirements from water. However, many studies have reported insufficient water-borne Ca in channel catfish (Robinson et al., 1986), tiger puffer (Hossain and Furuichi, 1998), red lip mullet (Hossain and Furuichi, 2000a), scorpion fish (Hossain and Furuichi, 2000b), American cichlid (Sanchez et al., 2000), juvenile tilapia (Shiau and Tseng, 2007) and giant croaker (Hossain and Furuichi, 1999).
Phosphorous is considered as a limiting nutrient for the growth of fish. It actively participates in skeletal development, bioenergetics and intermediary metabolism (Fontagné et al., 2009). Unlike Ca, low concentration of P is present in marine and freshwater. Thus, fish depends upon the dietary P supplementation to satisfy their metabolic P requirement (Yang et al., 2021). Previous studies showed that supplementation of P improved the growth performance of blunt snout bream, (Yang et al., 2021), catfish (Zafar and Khan, 2018), gibel carp (Xie et al., 2017) and snakehead (Shen et al., 2017). The range of dietary P requirements in fishes varies from 3.0 to 15.0 g/kg diet (NRC, 2011).
Many fishes have a potential to maintain constant Ca/P ratio in their bones and plasma. Thus, Ca/P ratio must be optimized in the artificial diet of fish otherwise, imbalances in ratio can cause negative effects on mineralization and nutrient bioavailability of fish (Hossain and Yoshimatsu, 2014) resulting in reduced growth rate. High dietary Ca level has an antagonistic effect on P absorption (Laining et al., 2011). The presence of excess Ca in diet interferes with the absorption of P in fish intestine as it combines with Ca to form insoluble complexes. This calcium phosphate complex is not biological available to fish, hence results in excretion of excessive nutrients into water bodies. Accumulation of these nutrients especially undigested P stimulate the algal bloom into water bodies resulting in water pollution (Sun et al., 2017). In addition, high Ca level has an inhibitory effect on trace elements absorption such as zinc, manganese and iron (Hossain and Yoshimatsu, 2014). Moreover, excessive Ca level consequently increased the P requirement in fish which in turn increased the feeding cost (Ye et al., 2006). It is suggested that optimum Ca/P ratio ranges from 1:1 to 1:17 in different fish species (Sanchez et al., 2000; Ye et al., 2006). Thus, it is very important to optimize Ca/P ratio in silver carp diet for better growth and physiological functions of fish.
Silver carp is native to Asia and widely cultivated in China. Its production was 4.51 million tons in 2017 (Gui et al., 2018). Rapid growth, high availability, delicious taste and low market price make it a potential candidate for fish farming (Gui et al., 2018). The presence of high protein content, unsaturated fatty acids and essential amino acids make it a suitable alternative to marine fish for surimi processing (Peres et al., 2015). There is not much literature available on the nutritional requirements of silver carp, however, recently the researchers are focusing on the nutrition of this species. Recently, some dietary studies have been reported to improve the growth, immunity and disease resistance in this species. Harikrishnan et al. (2021) reported addition of 200 mg/kg glycyrrhizic acid improved the immune system of silver carp. Mushtaq et al. (2022) studied that addition of 0.5 mg/kg Se methionine is efficient in improving the growth and antioxidative status of silver carp. Similarly, 5 g/kg micro and nano-scale chitosan effectively enhanced growth performance, non-specific immunity, and resistance of silver carp against Staphylococcus aureus infection (Younus et al., 2020). Likewise, there is scarce knowledge regarding the optimization of Ca/P ratio in silver carp. The outcomes of this study will help the feed manufacturers to formulate a cost effective and well-balanced feed for silver carp.
Materials and Methods
Ethical statement
This research was performed in Fish Seed Rearing Unit, Department of Fisheries and Aquaculture, UVAS Ravi Campus, C Block Pattoki after the approval of ethical committee of university.
Experimental design and diets
Nine isonitrogenous, isocaloric and isolipidic experimental diets were formulated by supplementing Ca and P at (0,0), (0,1), (0,2), (1,0), (1,1), (1,2), (2,0), (2,1) and (2,2) % levels, respectively in basal diet. They were named as Ca0P0, Ca0P1, Ca0P2, Ca1P0, Ca1P1, Ca1P2, Ca2P0, Ca2P1 and Ca2P2. Calcium lactate (Sigma-Aldrich) and disodium phosphate (Sigma-Aldrich) were used as a source of Ca and P, respectively (Table I). The ingredients were analyzed for proximate composition (AOAC, 1995) before feed formulation. Fishmeal, soya bean and canola meal, fish oil was used as lipid source and wheat flour were used in basal diet. Mineral and vitamin mixture was prepared by following NRC (2011). The basal diet contained 31.04% crude protein and 9.0% crude lipid. All feed ingredients were dried, weighed, ground, sieved and mixed with other feed ingredients including wheat flour, vitamin mixture, mineral mixture and chromic oxide by using an electric mixture. The pre-weighted fish oil was added with continuous mixing followed by the addition of distilled water for dough formation. A dough of even consistency was pelleted to 2mm diameter die by using a hand pelletizer. Pellets were oven-dried at 80℃ until moisture was reduced to 10%. The dried pellets were packed in labelled zip lock bags and frozen (-20°C) for feeding trial.
Feeding trial
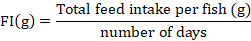
Healthy Hypophthalmichthys molitrix juveniles were taken from Hatchery of UVAS and acclimated in flow through system (0.4L/min) for 02 weeks. Juveniles were hand fed with basal diet during acclamation period. For feeding trial, 405 juveniles were randomly kept into 27 tanks (58 x 30 x 49 cm) at a density of 15 fish (average initial weight 13.7 ± 0.05 g) per tank. Three tanks were allotted randomly to each diet for 90 days. Juveniles were fed twice to apparent satiation per day. Uneaten pellets were collected for the estimation of feed conversion ratio (FCR) and feed intake (FI) after each feeding session.
Table I. Composition of experimental diets (%).
|
Ingredients |
Diets |
|||||||||||||
|
Ca0P0 |
Ca0P1 |
Ca0P2 |
Ca1P0 |
Ca1P1 |
Ca1P2 |
Ca2P0 |
Ca2P1 |
Ca2P2 |
||||||
|
Fish meal1 |
25 |
25 |
25 |
25 |
25 |
25 |
25 |
25 |
25 |
|||||
|
Soya bean meal1 |
20 |
20 |
20 |
20 |
20 |
20 |
20 |
20 |
20 |
|||||
|
Canola meal1 |
15 |
15 |
15 |
15 |
15 |
15 |
15 |
15 |
15 |
|||||
|
Rice polish1 |
15 |
15 |
15 |
15 |
15 |
15 |
15 |
15 |
15 |
|||||
|
Wheat flour1 |
12.5 |
12.5 |
12.5 |
12.5 |
12.5 |
12.5 |
12.5 |
12.5 |
12.5 |
|||||
|
Fish oil2 |
6 |
6 |
6 |
6 |
6 |
6 |
6 |
6 |
6 |
|||||
|
Vitamin C |
2 |
2 |
2 |
2 |
2 |
2 |
2 |
2 |
2 |
|||||
|
Vitamin premix3 |
2 |
2 |
2 |
2 |
2 |
2 |
2 |
2 |
2 |
|||||
|
Mineral mixture4 |
2 |
2 |
2 |
2 |
2 |
2 |
2 |
2 |
2 |
|||||
|
Disodium phosphate |
- |
3.1 |
6.2 |
- |
3.1 |
6.2 |
- |
3.1 |
6.2 |
|||||
|
Calcium lactate |
- |
- |
- |
7.69 |
7.69 |
7.69 |
15.38 |
15.38 |
15.38 |
|||||
|
Chromic oxide |
0.5 |
0.5 |
0.5 |
0.5 |
0.5 |
0.5 |
0.5 |
0.5 |
0.5 |
|||||
|
Proximate composition |
||||||||||||||
|
Moisture |
8.42 |
8.61 |
8.52 |
8.38 |
8.53 |
8.44 |
8.4 |
8.52 |
8.58 |
|||||
|
Crude protein |
30.13 |
30.42 |
30.24 |
30.36 |
30.4 |
30.27 |
30.22 |
30.33 |
30.39 |
|||||
|
Crude fats |
9.1 |
8.95 |
8.99 |
9.16 |
9.2 |
9.14 |
9.2 |
9.17 |
9.17 |
|||||
1Fishmeal, soybean meal, canola meal, rice polish and wheat flour were purchased from local market. 2Fish oil was purchased from Poultry-vet Co, Nazimabad, Karachi, Pakistan. 3Vitamin premix (kg-1 diet): Vitamin A 15 M.I.U; Vitamin D3 3 M.I.U; Nicotinic acid 25000mg; Vitamin B1 5000 mg; Vitamin E 6000 IU 9000 mg; Vitamin B2 6000 mg; Vitamin K3 4000 mg; Vitamin B6 4000 mg; Folic acid 750 mg; Vitamin B12 9000 mg; Vitamin C 15000mg; Calcium pantothenate 10000mg. 4Mineral premix (kg-1 diet): MgSO4.7H2O 153mg; NaCl 51mg; COCl.6H2O 0.0816mg; AlCl3.6H2O 0.255mg; CuSO4.5H2O 210.67mg; FeSO4.H2O 100.67mg; MnSO4.5H2O 116.67mg; ZnSO4.7H2O 121.33 mg.
After 2h interval, the fecal matter from each replicate tank was collected for further analysis. Water quality parameters such as water temperature (27.85- 29.33°C), dissolved oxygen (5.56-6.65 mg/L), water total ammonia (0.16 to 0.2 mg/L) and pH (8.04-8.30) were monitored daily throughout the feeding trial.
Data collection
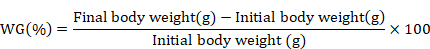
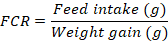
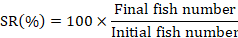
At the end of 90th experimental day, fish was starved and anesthetized by using clove oil (3000 mg/L) for 60 seconds (Khajepour and Hosseini, 2012). The growth performance and feed utilization were determined by using following formulas.

Proximate composition analysis
Five fish (from each replicate) were chosen for proximate composition analysis. Samples (fish, feed and feces) were pooled and ground. The standard method of AOAC (1995) was followed for proximate composition analysis. Dry matter was determined by oven-drying method (Model UNB-400, Memmert, Germany); crude protein (N×6.25) was analyzed by micro Kjeldahl method; crude fat was estimated by Soxhlet system while crude ash by igniting the samples at 550°C in muffle furnace (Ney VULCAN 3-550).
Mineral contents analysis
Four fish from each replicate were chosen for mineral content analysis. Scales were scrapped, pooled, oven-dried and stored till analysis. Fish carcass were dipped into hot water until the flesh was stripped off. Samples were rinsed, oven-dried and ether extracted through Soxhlet apparatus for fat removal. Defatted samples were ground and digested through wet digestion method (AOAC, 1995). Phosphorus analysis was performed on UV-Vis Spectrophotometer, while mineral estimation was done through atomic absorption spectrophotometry (Irmeco, Model U2020).
Nutrient digestibility
Feces from each experimental tank were siphoned out, pooled and oven-dried daily throughout the feeding trial of 90-days (AOAC, 1995). Chromic oxide was added as an inert marker of nutrient digestibility in the experimental diets. The dried fecal samples were weighed and frozen at −20℃ in labelled bags. Digestion of feces was done by the method of Czarnocki et al. (1961). The apparent digestibility coefficient (ADC%) was determined by using the given formula (NRC, 2011).

Statistical analysis
The data were subjected to two-way analysis of variance (ANOVA) to determine the interaction between Ca and P. CoStat statistical software package (Version 6.303) was used for all statistical analysis. Tukey’s Honestly Significant Difference Test was used for comparing means at 5% significance level.
Results
Growth performance
Dietary supplementation of Ca and P individually as well as in interaction significantly improved the final weight (FW), weight gain% (WG%), specific growth rate (SGR) and FCR of silver carp (Table II). No significant variation in survival rate was recorded except for the diet containing 1% Ca with 2% P supplement. However, feed intake (FI) remained unaffected (p > 0.05) by their supplementation. Results showed that increase in Ca supplementation from 1 to 2% did not cause further improvement (p > 0.05) in the FW, WG% and SGR of fish, however, increase in P supplementation from 1 to 2% at 0 and 2% Ca level, significantly improved these parameters. Moreover, 1% Ca at 1% P fed silver carp yielded similar (p > 0.05) growth performance as was exhibited by fish fed diet containing 2% Ca and 2% P.
Whole-body composition
Supplementation of Ca and P enhanced (p < 0.05) the whole body protein content while moisture, fat and ash content remained unaffected (p > 0.05) by their supplementation. The protein content increased with P without Ca supplement, however, remained non-significant at 1 and 2% Ca level. Similarly, increase in Ca supplementation from 1 to 2% did not improve (p > 0.05) the body protein level (Table III).
Nutrient digestibility
Results of nutrient digestibility are depicted in Table IV. The highest (p < 0.05) protein and fat digestibility was observed in fish fed 2% Ca supplemented diet but it was similar (p < 0.05) to those fed 1% supplemented diet. Considering the individual element, increase in P from 0 to 1% enhanced (p < 0.05) protein digestibility at 1% Ca level, however, further increase in its supplementation did not improve (p > 0.05) the protein digestibility. Moreover, dry matter remained unaffected (p > 0.05) by Ca, P and their interaction.
Table II. Effect of different experimental diets on growth performance of H. molitrix juveniles.
|
Diets |
FW (g) |
WG% |
SGR (%/day) |
FI (g) |
FCR |
SR% |
|
Ca0P0 |
49.06±0.91e |
272.51±7.33e |
1.60±0.02d |
60±2.64 |
1.67±0.1a |
100±0a |
|
Ca0P1 |
51.74±0.08d |
291.72±0.64d |
1.66±0.02cd |
58.33±3.78 |
1.51±0.1ab |
100±0a |
|
Ca0P2 |
53.1±0.12bc |
306±3.04bc |
1.70±0.01bc |
56±2.64 |
1.39±0.07b |
100±0a |
|
Ca1P0 |
52.70±0.49cd |
298.71±5.56cd |
1.68±0.01c |
55.16±0.76 |
1.39±0.02b |
100±0a |
|
Ca1P1 |
55.92±0.15a |
326.51±4.63a |
1.76±0.01ab |
60±1.32 |
1.4±0.02b |
100±0a |
|
Ca1P2 |
53.03±0.09bc |
304.92±2.85bc |
1.70±0.02bc |
56.33±1.52 |
1.41±0.03b |
98.3±1b |
|
Ca2P0 |
54.05±0.08b |
312.83±3.95b |
1.72±0.01abc |
56.33±1.52 |
1.37±0.03b |
100±0a |
|
Ca2P1 |
53.65±0.39bc |
307.58±4.47bc |
1.71±0.01bc |
56±2.05 |
1.38±0.04b |
100±0a |
|
Ca2P2 |
57.03±0.26a |
335.58±2.42a |
1.79±0.00a |
59±1.03 |
1.34±0.02b |
100±0a |
|
Two-way ANOVA (p-value) |
||||||
|
Ca |
< 0.05 |
< 0.05 |
< 0.05 |
> 0.05 |
< 0.05 |
< 0.05 |
|
P |
< 0.05 |
< 0.05 |
< 0.05 |
> 0.05 |
< 0.05 |
< 0.05 |
|
Ca*P |
< 0.05 |
< 0.05 |
< 0.05 |
< 0.05 |
< 0.05 |
< 0.05 |
Mean values of triplicates ± Standard deviation mean; Means within same column sharing dissimilar letters differ significantly (p < 0.05). FW, Final weight; WG%, weight gain%; SGR, Specific growth rate; FI, Feed intake; FCR, Feed conversion ratio; SR%, Survival rate%.
Table III. Effect of different experimental diets on whole-body composition (%) of H. molitrix juveniles.
|
Diets |
Moisture |
Protein |
Fat |
Ash |
|
Ca0P0 |
78.83±3.23 |
16.1±0.15b |
4.33±0.1 |
2.21±0.11 |
|
Ca0P1 |
75.26±0.68 |
18.68±0.41a |
4.35±0.11 |
2.16±0.01 |
|
Ca0P2 |
74.75±0.44 |
18.1±0.48a |
4.27±0.07 |
2.29±0.18 |
|
Ca1P0 |
74.81±0.76 |
18.1±0.19a |
4.22±0.07 |
2.16±0.08 |
|
Ca1P1 |
73.83±0.7 |
18.14±0.21a |
4.25±0.06 |
2.22±0.03 |
|
Ca1P2 |
74.18±0.7 |
18.21±0.21a |
4.25±0.10 |
2.16±0.03 |
|
Ca2P0 |
73.79±0.99 |
18.24±0.29a |
4.25±0.02 |
2.23±0.07 |
|
Ca2P1 |
74.8±1.15 |
18.14±0.18a |
4.29±0.02 |
2.27±0.03 |
|
Ca2P2 |
74.3±0.43 |
18.26±0.03a |
4.26±0.06 |
2.18±0.01 |
|
Two-way ANOVA (p-value) |
||||
|
Ca |
> 0.05 |
< 0.05 |
> 0.05 |
> 0.05 |
|
P |
> 0.05 |
< 0.05 |
> 0.05 |
> 0.05 |
|
Ca*P |
> 0.05 |
< 0.05 |
> 0.05 |
> 0.05 |
Mean values of triplicates ± Standard deviation mean; Means within same column sharing dissimilar letters differ significantly (p < 0 .05).
Mineralization
Results indicated that Ca and P contents showed significant increase with the increase in Ca and P levels in the body, bones and scales, achieving the highest values at 2% Ca supplemented with 2% P (Tables V-VII). Whereas, Mg content showed significant reduction with increasing Ca supplementation. With regard to the effect of P, maximum (p < 0.05) Mg content was recorded at 1% P in bones and 2% P in body and scales. Body and bone Zn level also tend to decrease with an increase in Ca and P supplementation (p < 0.05). However, an opposite trend (p < 0.05) was noticed in scales where the highest (p < 0.05) Zn content was recorded at 2% Ca level supplemented with 2% P. The Ca/P ratio was improved (p < 0.05) by Ca, P and their interaction. Fish fed the diet containing 2% Ca level without P supplement had higher Ca/P ratio in body and bones compared to those fed with other diets (p < 0.05). Whereas, scales Ca/P ratio tend to decrease at 2% Ca level. Further, increase in P supplementation significantly reduced (p < 0.05) Ca/P ratio regardless of Ca level.
Table IV. Effect of different experimental diets on nutrient digestibility (%) of H. molitrix juveniles.
|
Diets |
Digestibility of DM |
Digestibility of protein |
Digestibility of fat |
|
Ca0P0 |
61.34±0.99 |
61.85±0.77c |
64.66±0.35b |
|
Ca0P1 |
61.6±1.09 |
63.21±1.76c |
65.61±0.46ab |
|
Ca0P2 |
62.25±0.71 |
63.28±1.61c |
65.53±4.77ab |
|
Ca1P0 |
61.95±1.11 |
63.51±0.74bc |
64.01±0.47b |
|
Ca1P1 |
63.07±1.6 |
68.27±2.26ab |
68.59±2.78ab |
|
Ca1P2 |
61.7±0.35 |
68.76±0.47a |
68.62±2.34ab |
|
Ca2P0 |
61.88±0.75 |
70.34±0.47a |
68.56±0.87ab |
|
Ca2P1 |
61.04±0.62 |
70.72±0.86a |
68.96±0.35ab |
|
Ca2P2 |
63.15±0.26 |
71.13±0.65a |
71.01±2.05a |
|
Two-way ANOVA (p-value) |
|||
|
Ca |
> 0.05 |
< 0.05 |
< 0.05 |
|
P |
> 0.05 |
< 0.05 |
< 0.05 |
|
Ca*P |
> 0.05 |
> 0.05 |
> 0.05 |
Mean values of triplicates ± Standard deviation mean; Means within same column sharing dissimilar letters differ significantly (p < 0.05).
Table V. Effect of different experimental diets on levels of minerals in whole-body of H. molitrix juveniles.
|
Diets |
Ca (mg/g) |
P (mg/g) |
Mg (mg/g) |
Zn (µg/g) |
Ca/P |
|
Ca0P0 |
8.64±0.02h |
5.81±0.02h |
0.28±0.01c |
38.91±0.03a |
1.48±0.01d |
|
Ca0P1 |
8.70±0.01g |
6.11±0.01e |
0.38±0.00ab |
37.93±0.03b |
1.42±0.00f |
|
Ca0P2 |
8.93±0.02f |
6.35±0.01c |
0.41±0.01a |
37.1±0.04e |
1.4±0.00g |
|
Ca1P0 |
8.97±0.02f |
5.91±0.01g |
0.23±0.01d |
37.84±0.07b |
1.51±0.00c |
|
Ca1P1 |
9.04±0.00e |
6.23±0.01d |
0.35±0.01b |
37.69±0.04c |
1.45±0.00e |
|
Ca1P2 |
9.11±0.01d |
6.41±0.02b |
0.39±0.01a |
37.55±0.02d |
1.42±0.00f |
|
Ca2P0 |
9.49±0.03c |
5.99±0.02f |
0.18±0.01e |
36.95±0.04f |
1.58±0.00a |
|
Ca2P1 |
9.68±0.01b |
6.19±0.01d |
0.23±0.01d |
36.78±0.03g |
1.56±0.00b |
|
Ca2P2 |
9.82±0.03a |
6.60±0.01a |
0.29±0.01c |
36.57±0.02h |
1.48±0.00d |
|
Two-way ANOVA (p-value) |
|||||
|
Ca |
< 0.05 |
< 0.05 |
< 0.05 |
< 0.05 |
< 0.05 |
|
P |
< 0.05 |
< 0.05 |
< 0.05 |
< 0.05 |
< 0.05 |
|
Ca*P |
< 0.05 |
< 0.05 |
< 0.05 |
< 0.05 |
< 0.05 |
Mean values of triplicates ± Standard deviation mean; Means within same column sharing dissimilar letters differ significantly (p < .05).
Table VI. Effect of different experimental diets on levels of minerals in bones of H. molitrix juveniles.
|
Diets |
Ca (mg/g) |
P (mg/g) |
Mg (mg/g) |
Zn (µg/g) |
Ca/P |
|
Ca0P0 |
158.54±0.05i |
82.23±0.07i |
3.33±0.05e |
155.21±0.29c |
1.92±0.00e |
|
Ca0P1 |
166.93±0.73h |
93.93±0.1f |
3.51±0.01bc |
155.18±0.13c |
1.77±0.00g |
|
Ca0P2 |
188.82±0.07g |
100.21±0.1d |
3.43±0.01d |
154.13±0.22d |
1.88±0.00f |
|
Ca1P0 |
192.47±0.02f |
89.06±0.1h |
3.62±0.01a |
158.88±0.2a |
2.16±0.00c |
|
Ca1P1 |
199.99±0.06e |
90.3±0.02g |
3.56±0.01ab |
158.02±0.1b |
2.21±0.00b |
|
Ca1P2 |
204.14±0.03d |
104.15±0.04b |
3.51±0.01bc |
154.96±0.13c |
1.96±0.00d |
|
Ca2P0 |
217.19±0.02c |
97.27±0.03e |
3.41±0.01d |
150.12±0.13f |
2.23±0.00a |
|
Ca2P1 |
222.53±0.16b |
100.94±0.38c |
3.47±0.02cd |
152.57±0.41e |
2.2±0.00b |
|
Ca2P2 |
240.91±0.2a |
111.94±0.11a |
3.44±0.01d |
148.79±0.04g |
2.15±0.00c |
|
Two-way ANOVA (p-value) |
|||||
|
Ca |
< 0.05 |
< 0.05 |
< 0.05 |
< 0.05 |
< 0.05 |
|
P |
< 0.05 |
< 0.05 |
< 0.05 |
< 0.05 |
< 0.05 |
|
Ca*P |
< 0.05 |
< 0.05 |
< 0.05 |
< 0.05 |
< 0.05 |
Mean values of triplicates ± Standard deviation mean; Means within same column sharing dissimilar letters differ significantly (p < .05).
Table VII. Effect of different experimental diets on levels of minerals in scales of H. molitrix juveniles.
|
Diets |
Ca (mg/g) |
P (mg/g) |
Mg(mg/g) |
Zn (µg/g) |
Ca/P |
|
Ca0P0 |
123.15±0.27i |
44.85±0.08i |
2.41±0.02d |
142.34±0.08f |
2.74±0.00d |
|
Ca0P1 |
128.01±0.1h |
51.84±0.05d |
2.51±0.01bc |
142.42±0.11f |
2.46±0.00g |
|
Ca0P2 |
132.05±0.28g |
57.3±0.01c |
2.63±0.02a |
150.08±0.19b |
2.3±0.00h |
|
Ca1P0 |
143.96±0.13f |
46.6±0.2h |
2.35±0.02e |
148.5±0.17c |
3.08±0.01a |
|
Ca1P1 |
145.19±0.01e |
46.99±0.11g |
2.27±0.01g |
148.44±0.39c |
3.08±0.00a |
|
Ca1P2 |
147.69±0.04d |
59.41±0.02b |
2.55±0.02b |
152.73±0.26a |
2.48±0.00f |
|
Ca2P0 |
152.49±0.03c |
50.07±0.04f |
2.29±0.01fg |
139.96±0.16g |
3.04±0.00b |
|
Ca2P1 |
153.14±0.03b |
51.19±0.02e |
2.34±0.02ef |
143.45±0.22e |
2.99±0.00c |
|
Ca2P2 |
156.41±0.02c |
61.08±0.09a |
2.48±0.01c |
145.28±0.03d |
2.56±0.00e |
|
Two-way ANOVA (p-value) |
|||||
|
Ca |
< 0.05 |
< 0.05 |
< 0.05 |
< 0.05 |
< 0.05 |
|
P |
< 0.05 |
< 0.05 |
< 0.05 |
< 0.05 |
< 0.05 |
|
Ca*P |
< 0.05 |
< 0.05 |
< 0.05 |
< 0.05 |
< 0.05 |
Mean values of triplicates ± Standard deviation mean; Means within same column sharing dissimilar letters differ significantly (p < .05).
Discussion
In the contemporary study, fish fed the diets without Ca supplement showed no symptoms of Ca deficiency indicating that silver carp might absorb water-borne Ca rather than from artificial feed to satisfy their Ca requirement for optimum performance. Moreover, P unsupplemented diets showed significantly lower FW, WG% and SGR than P supplemented diets. It implies that dietary P supplementation is very necessary for the optimum growth performance of silver carp. Similar phenomenon was observed in yellowtail (Sarker et al., 2009), European sea bass (Oliva‐Teles and Pimentel‐Rodrigues, 2004), rainbow trout, (Koko et al., 2010) haddock (Roy and Lall, 2003) and Chinese mitten crab (Lei et al., 2021). The poor growth performance due to P deficiency corresponds to the impaired metabolic functions in fish (Vielma et al., 2002).
Fish fed the diet containing 1% Ca with 1% P yielded the similar growth performance as exhibited by that fed 2% Ca with 2% P (Ca/P=1), in this study. This ratio was in accordance to the findings of earlier researchers who also reported Ca/P ratio of 1:1 improved the growth, feed utilization and mineralization in fish (Nakamura and Yamada, 1980; Nose, 1975; Phillips, 1959; Satoh et al., 1991; Sakamoto, 1973). In addition, Yang et al. (2006) observed that Ca/P ratio of 1:1 found to be optimum in terms of growth and mineral deposition. Sanchez et al. (2000) reported that Ca/P ratio of 1:3 was important for the normal growth of in American cichlid. Moreover, Laining et al. (2011) reported a significant improvement in the growth performance of tiger puffer at 0:5 Ca/P ratio. In African catfish, Ca/P ratio of 2:1.5 was documented as effective ratio for the optimum growth of fish (Nawanna and Oni, 2018). Further, 0.6:1 ratio improved the growth, feed utilization, whole body composition and nutrient digestibility in Nile tilapia (Hassaan et al., 2013). On the contrary, no optimum Ca/P ratio was documented in Pacific white shrimp (Davis et al., 1993), black tiger shrimp (Peñaflorida, 1999), catfish (Andrews et al., 1973) and juvenile abalone (Coote et al., 1996; Tan et al., 2001).
The analysis of whole-body proximate composition can be used for estimating the nutrient utilization and vigorous health of fish (Fernández-Gimenez et al., 2009). Increased body protein as a results of increased dietary P level, in our study, coincides with the results of Tan et al. (2001) and Eya and Lovell (1997). This may be attributed to the availability of high-energy yielding nucleotides by high P levels for protein synthesis (Tan et al., 2001). In this study, Ca and P supplemental levels had a non-significant effect on whole body fat content. On the contrary, significant reduction in body fat content was observed in African catfish (Nwanna and Oni, 2018), grouper (Ye et al., 2006), abalone (Tan et al., 2001) and discus (Liu et al., 2021) in response to Ca and P supplemented diets. The findings of these studies indicated that supplemental P plays a vital role in fat reduction in fish by yielding fatty Acyl-CoA through enhanced esterification of the free fatty acid with extra-mitochondrial CoA. Moreover, it inhibits the fatty acids formation via TCA cycle from amino acids and resulted in reduced fat deposition in fish body (Roy and Lall, 2003). The increased ash content in whole body and bone corresponds to P retention in body tissues and supply of P from feed (Ye et al., 2006). No significant variations in ash content was recorded for Ca and P supplementation in our study. Similar trend was narrated by Robinson et al. (1987) in tilapia. Contrarily, Ye et al. (2006) observed significantly increased ash content in response to Ca and P supplemented diets. These discrepancies in the results may owe to the variations in fish species, diet composition, experimental conditions and trial duration. Moreover, moisture content in whole body remained unaffected by Ca, P levels and their interaction in this study. This result was in line to the findings of other researchers who also documented a non-significant influence of Ca and P supplementation on moisture content (Tan et al., 2001; Ye et al., 2006).
Significantly improved protein digestibility was recorded at 1% Ca feeding which was not significantly different from that of 2% Ca level, in this experiment. Similarly, Hassaan et al. (2013) reported significant improvement in protein digestibility for the supplementation of Ca/P of 0.6:1 with 1000 U/kg phytase in Nile tilapia. In addition, Laining et al. (2011) concluded that Ca/P ratio of 0.5 combined with 2000 FTU phytase per kg significantly improved the protein digestibility. This showed that phytase supplementation with low Ca/P ratio improved the growth of fish.
Bones, scales, and whole body are considered reliable indicators for evaluating the mineral utilization especially P in fish (Ye et al., 2006). Scales are the major sites of Ca storage and metabolism in fish. Moreover, exchange rate of Ca is three folds in scales than that of bone which tended to decrease during stressful conditions (Liu et al., 2021). Whole body, bones and scales were chosen to compare the response of these samples to different Ca and P levels in this study. The comparison will help in the indication of P utilization in tissues. The lower mineral contents in the whole body, bones and scales as a result of without P supplementation diet. Feeding, in this study, showed that P is essential element for mineral deposition in fish. These findings are in consistent with the results of other researchers who also reported un-supplemented P diet caused a marked reduction of mineral deposition in fish (Roy and Lall, 2003; Baeverfjord et al., 1998; Andrews et al., 1973; Ogino and Takeda, 1978; Lovell, 1978; Brown et al., 1993; Wilson et al., 1982; Shim and Ho, 1989; Sakamoto and Yone, 1978; Watanabe et al., 1980; Skonberg et al., 1997). In the current study, the maximum Ca and P concentration in body, bone and scales was observed in 2% Ca with 2% P fed fish, indicating that uptake of Ca from the diet or surrounding water with adequate P was sufficient for bone mineralization. Similar phenomenon was observed in discus fish (Liu et al., 2021), juvenile grouper (Ye et al., 2006) and African catfish (Andrews et al., 1973). Magnesium is present in scales and hard tissues of dermal and skeletal bones of fish. In this study, significant reduction in Mg content was recorded with the increasing Ca and P levels in diets in whole body and scales. The result was in accordance to the findings of earlier researchers who reported that excess Ca and P level had the antagonistic effects on the deposition and metabolism of Mg content in fish body (Andrews et al., 1973; Cheng et al., 2006; Hardy and Shearer, 1985; Porn-Ngam et al., 1993; Vielma and Lall, 1998). The reduction in Mg concentration might be attributed to increase in sodium and potassium ions in scales due to enhanced membrane permeability by increased Ca and P levels (Hossain and Yoshimatsu, 2014; Peñaflorida, 1999). This increase in Na/K+ ions caused the negative effects on the Mg concentration that plays key roles in cell metabolism, osmoregulation, mineralization and neuromuscular transmission (NRC, 2011). Zinc influenced the bone mineralization by acting as a divalent cation, cofactor for nucleation and mineral deposition (Ye et al., 2006). Zinc deposition showed a negative correlation with increased Ca and P supplementation in this study. This result is in concurrent to the findings of Hossain and Furuichi (2000b) who observed a significant reduction in Zn content from 0.162 to 0.076 mg/g in vertebrae in response to 2.5% tricalcium phosphate. Likewise, Apines et al. (2003) also reported an inhibitory effect of 4% tricalcium phosphate on Zn content in rainbow trout. This is because high Ca and P levels interfere with the absorption of trace elements and Mg, resulting in poor mineralization in bones. In the present experimental study, Ca/P ratio was improved by Ca, P and their interaction. This showed that silver carp has a great potential to stabilize Ca/P ratio through absorption from surrounding water in response to Ca and P fluctuations in diet. This finding is supported by Liu et al. (2021) who also observed significant positive effect of Ca and P supplementation on Ca/P ratio in discus.
Conclusion
In summary, silver carp appear to require no more than 1% Ca in the diet. With respect to P, 1% P yielded the optimum growth performance of fish. Although, increase in P supplementation up to 2% is not found detrimental for fish. Thus, dietary supplementation of 1% Ca with 1% P (Ca/P =1) is recommended for better growth performance of silver carp. However, Ca should not added be supplemented in excessive amount as it negatively affects the mineralization in fish.
Funding
This study received no particular support from funding agencies in the public, commercial, or non-profit sectors.
Statement of conflict of interest
The authors have declared no conflict of interest.
References
Andrews, J.W., Murai, T. and Campbell, C., 1973. Effects of dietary calcium and phosphorus on growth, food conversion, bone ash and hematocrit levels of catfish. J. Nutr., 103: 766-771. https://doi.org/10.1093/jn/103.5.766
AOAC, 1995. Official methods of analysis. Association of Official Analytical Chemists, 15th edn. Washington, DC.
Apines, M.J.S., Satoh, S., Kiron, V., Watanabe, T. and Aoki, T., 2003. Availability of supplemental amino acid-chelated trace elements in diets containing tricalcium phosphate and phytate to rainbow trout, Oncorhynchus mykiss. Aquaculture, 225: 431-444 https://doi.org/10.1016/S0044-8486(03)00307-7.
Baeverfjord, G., Asgard, T. and Shearer, K.D., 1998. Development and detection of phosphorus deficiency in Atlantic salmon, Salmo salar L., parr and post-smolts. Aquac. Nutr., 4: 1-11. https://doi.org/10.1046/j.1365-2095.1998.00095.x
Brody, T., 1998. Nutritional biochemistry. 2nd edn. pp. 761–794. Elsevier.
Brown, M.L., Jaramillo Jr, F. and Gatlin III, D.M., 1993. Dietary phosphorus requirement of juvenile sunshine bass, Morone chrysops ♀× M. saxatilis ♂. Aquaculture, 113: 355-363. https://doi.org/10.1016/0044-8486(93)90405-N
Cheng, K.M., Hu, C.Q., Liu, Y.N., Zheng, S.X. and Qi, X.J., 2006. Effects of dietary calcium, phosphorus and calcium/phosphorus ratio on the growth and tissue mineralization of Litopenaeus vannamei reared in low-salinity water. Aquaculture, 251: 472-483. https://doi.org/10.1016/j.aquaculture.2005.06.022
Coote, T.A., Hone, P.W., Kenyon, R. and Maguire, G.B., 1996. The effect of different combinations of dietary calcium and phosphorus on the growth of juvenile Haliotis laevigata. Aquaculture, 145: 267-279. https://doi.org/10.1016/S0044-8486(96)01303-8
Czarnocki, J., Sibbald, I.R. and Evans, E.V., 1961. The determination of chromic oxide in samples of feed and excreta by acid digestion and spectrophotometry. Can. J. Anim. Sci., 41: 167-179 https://doi.org/10.4141/cjas61-024.
Davis, D.A., Lawrence, A.L. and Gatlin III, D.M., 1993. Response of Penaeus vannamei to dietary calcium, phosphorus and calcium: phosphorus ratio. J. World Aquac. Soc., 24: 504-515. https://doi.org/10.1111/j.1749-7345.1993.tb00581.x
Eya, J.C. and Lovell, R.T., 1997. Available phosphorus requirements of food-size channel catfish (Ictalurus punctatus) fed practical diets in ponds. Aquaculture, 154: 283-291. https://doi.org/10.1016/S0044-8486(97)00055-0
Fernández-Gimenez, A.V., Díaz, A.C., Velurtas, S.M. and Fenucci, J.L., 2009. In vivo and in vitro protein digestibility of formulated feeds for Artemesia longinaris (Crustacea, Penaeidae). Braz. Arch. Biol. Technol., 52: 1379-1386. https://doi.org/10.1590/S1516-89132009000600009
Fontagné, S., Silva, N., Bazin, D., Ramos, A., Aguirre, P., Surget, A., Abrantes, A., Kaushik, S.J. and Power, D.M., 2009. Effects of dietary phosphorus and calcium level on growth and skeletal development in rainbow trout (Oncorhynchus mykiss) fry. Aquaculture, 297: 141-150. https://doi.org/10.1016/j.aquaculture.2009.09.022
Gui, P., Zhang, L., Hong, H., Feng, L. and Luo, Y., 2018. Gel properties of silver carp (Hypophthalmichthys molitrix) and chicken mixture gels as affected by setting temperatures. Int. J. Fd. Prop., 21: 2250-2264. https://doi.org/10.1080/10942912.2018.1508155
Hardy, R.W. and Shearer, K.D., 1985. Effect of dietary calcium phosphate and zinc supplementation on whole body zinc concentration of rainbow trout (Salmo gairdneri). Can. J. Fish. aquat. Sci., 42: 181-184. https://doi.org/10.1139/f85-022
Harikrishnan, R., Devi, G., Van Doan, H., Jawahar, S., Balasundaram, C., Saravanan, K., Arockiaraj, J., Soltani, M., and Jaturasitha, S., 2021. Study on antioxidant potential, immunological response, and inflammatory cytokines induction of glycyrrhizic acid (GA) in silver carp against vibriosis. Fish Shellf. Immunol., 119: 193-208. https://doi.org/10.1016/j.fsi.2021.09.040
Hassaan, M.S., Soltan, M.A., Agouz, H.M. and Badr, A.M., 2013. Influences of calcium/phosphorus ratio on supplemental microbial phytase efficiency for Nile tilapia (Oreochromis niloticus). Egypt. J. aquat. Res., 39: 205-213. https://doi.org/10.1016/j.ejar.2013.09.001
Hossain, M.A. and Furuichi, M., 1998. Availability of environmental and dietary calcium in tiger puffer. Aquacult. Int., 6: 121-132. https://doi.org/10.1023/A:1009286206931
Hossain, M.A. and Furuichi, M., 1999. Dietary calcium requirement of giant croaker Nibea japonica. J. Fac. Agric. Kyushu Univ., 44: 99-104. https://doi.org/10.5109/24311
Hossain, M.A. and Furuichi, M., 2000a. Essentiality of dietary calcium supplement in redlip mullet, Liza haematocheila. Aquacult. Nutr., 6: 33-38. https://doi.org/10.1046/j.1365-2095.2000.00123.x
Hossain, M.A. and Furuichi, M., 2000b. Essentiality of dietary calcium supplement in fingerling scorpion fish (Sebastiscus marmoratus). Aquaculture, 189: 155-163. https://doi.org/10.1016/S0044-8486(00)00366-5
Hossain, M.A. and Yoshimatsu, T., 2014. Dietary calcium requirement in fishes. Aquacult. Nutr., 20: 1-11. https://doi.org/10.1111/anu.12135
Khajepour, F. and Hosseini, S.A., 2012. Calcium and phosphorus status in juvenile Beluga (Huso huso) fed citric acid‐supplemented diets. Aquacult. Res., 43: 407-411. https://doi.org/10.1111/j.1365-2109.2011.02843.x
Koko, G.K., Sarker, P.K., Proulx, É. and Vandenberg, G.W., 2010. Effects of alternating feeding regimes with varying dietary phosphorus levels on growth, mineralization, phosphorus retention and loading of large rainbow trout (Oncorhynchus mykiss). Aquat. Living Resour., 23: 277-284. https://doi.org/10.1051/alr/2010032
Laining, A., Ishikawa, M., Kyaw, K., Gao, J., Binh, N.T., Koshio, S., Yamaguchi, S., Yokoyama, S. and Koyama, J., 2011. Dietary calcium/phosphorus ratio influences the efficacy of microbial phytase on growth, mineral digestibility and vertebral mineralization in juvenile tiger puffer, Takifugu rubripes. Aquacult. Nutr., 17: 267-277. https://doi.org/10.1111/j.1365-2095.2009.00749.x
Lei, Y., Sun, Y., Wang, X., Lin, Z., Bu, X., Wang, N., Du, Z., Qin, J. and Chen, L., 2021. Effect of dietary phosphorus on growth performance, body composition, antioxidant activities and lipid metabolism of juvenile Chinese mitten crab (Eriocheir sinensis). Aquaculture, 531: 735856. https://doi.org/10.1016/j.aquaculture.2020.735856
Liu, Y., Liu, Y.N., Tian, X.C., Liu, H.P., Wen, B., Wang, N., Gao, J.Z. and Chen, Z.Z., 2021. Growth and tissue calcium and phosphorus deposition of juvenile discus fish (Symphysodon haraldi) fed with graded levels of calcium and phosphorus. Aquaculture, 541: 736755. https://doi.org/10.1016/j.aquaculture.2021.736755
Lovell, R.T., 1978. Dietary phosphorus requirement of channel catfish (Ictalurus punctatus). Trans. Am. Fish. Soc., 107: 617-621. https://doi.org/10.1577/1548-8659(1978)107<617:DPROCC>2.0.CO;2
Mushtaq, M., Fatima, M., Shah, S. Z. H., Khan, N., Naveed, S., Khan, M., 2022. Effects of sodium selenite, selenium methionine, and selenium yeast on growth performance, carcass composition, blood biochemistry, and antioxidant status of intensively reared Hypophthalmichthys molitrix. Aquacult. Rep., 24: 101182. https://doi.org/10.1016/j.aqrep.2022.101182
Nakamura, Y. and Yamada, J., 1980. Effects of dietary calcium levels, Ca/P ratios, and calcium components on the calcium absorption rate in carp. 北海道大學水産學部研究彙報, 31: 277–282. https://eprints.lib.hokudai.ac.jp/dspace/bitstream/2115/23727/1/31(4)_P277-282.pdf
Nose, T., 1975. Recent advances in studies on mineral nutrition of fish in Japan. Adv. Aquacult., https://ci.nii.ac.jp/naid/10004880402/
NRC, 2011. In nutrient requirement of fish and shrimp. National Research Council, The National Academies Press.
Nwanna, L.C. and Oni, O.V., 2018. Determination of optimum calcium and phosphorous ratio for the production of african catfish Clarias gariepinus (Burchell, 1822). J. appl. Sci. Environ. Manag., 22: 689-692. https://doi.org/10.4314/jasem.v22i5.12
Ogino, C. and Takeda, H., 1978. Requirements of rainbow trout for dietary calcium and phosphorus. Bull. Japan Soc. Sci. Fish, 44: 1019-1022. https://doi.org/10.2331/suisan.44.1015
Oliva‐Teles, A. and Pimentel‐Rodrigues, A., 2004. Phosphorus requirement of European sea bass (Dicentrarchus labrax L.) juveniles. Aquacult. Res., 35: 636-642. https://doi.org/10.1111/j.1365-2109.2004.01059.x
Peñaflorida, V.D., 1999. Interaction between dietary levels of calcium and phosphorus on growth of juvenile shrimp, Penaeus monodon. Aquaculture, 172: 281-289. https://doi.org/10.1016/S0044-8486(98)00503-1
Peres, H., Costas, B., Perez‐Jimenez, A., Guerreiro, I. and Oliva‐Teles, A., 2015. Reference values for selected hematological and serum biochemical parameters of Senegalese sole (Solea senegalensis Kaup, 1858) juveniles under intensive aquaculture conditions. J. appl. Ichthyol., 31: 65-71. https://doi.org/10.1111/jai.12641
Phillips, A., 1959. The known and possible role of minerals in trout nutrition and physiology. Trans. Am. Fish. Soc. 88: 133–135. https://afspubs.onlinelibrary.wiley.com/doi/abs/10.1577/15488659 (1959)88[133:TKAPRO]2.0.CO;2 https://doi.org/10.1577/1548-8659(1959)88[133:TKAPRO]2.0.CO;2
Porn-Ngam, N., Satoh, S., Takeuchi, T. and Watanabe, T., 1993. Effect of the ratio of phosphorus to calcium on zinc availability to rainbow trout in high phosphorus diet. Nippon Suisan Gakkaishi (Japanese Ed.), 59: 2065–2070. https://doi.org/10.2331/suisan.59.2065
Robinson, E.H., LaBomascus, D., Brown, P.B. and Linton, T.L., 1987. Dietary calcium and phosphorus requirements of Oreochromis aureus reared in calcium-free water. Aquaculture, 64: 267-276. https://doi.org/10.1016/0044-8486(87)90189-X
Robinson, E.H., Rawles, S.D., Brown, P.B., Yette, H.E. and Greene, L.W., 1986. Dietary calcium requirement of channel catfish Ictalurus punctatus, reared in calcium-free water. Aquaculture, 53: 263-270. https://doi.org/10.1016/0044-8486(86)90356-X
Roy, P.K. and Lall, S.P., 2003. Dietary phosphorus requirement of juvenile haddock (Melanogrammus aeglefinus L.). Aquaculture, 221: 451-468. https://doi.org/10.1016/S0044-8486(03)00065-6
Sakamoto, S. and Yone, Y., 1978. Effect of dietary phosphorus level on chemical composition of red sea bream. Bull. Japan Soc. Sci. Fish., 44:227-229 https://doi.org/10.2331/suisan.44.227.
Sakamoto, S., 1973. Effect of dietary calcium/phosphorus ratio upon growth, feed efficiency, and blood serum Ca and P level in red sea bream. Bull. Japan Soc. Sci. Fish., 39: 343-348. https://doi.org/10.2331/suisan.39.343
Sanchez, C.C., Palacios, M.C.A., Perez, G.M. and Ross, L.G., 2000. Phosphorus and calcium requirements in the diet of the American cichlid Cichlasoma urophthalmus (Günther). Aquacult. Nutr., 6: 1–9. https://www.cabdirect.org/cabdirect/abstract/20001411279 https://doi.org/10.1046/j.1365-2095.2000.00118.x
Sarker, P.K., Satoh, S., Fukada, H. and Masumoto, T., 2009. Effects of dietary phosphorus level on non‐faecal phosphorus excretion from yellowtail (Seriola quinqueradiata Temminck and Schlegel) fed purified and practical diets. Aquacult. Res., 40: 225-232. https://doi.org/10.1111/j.1365-2109.2008.02086.x
Satoh, S., Takeuchi, T. and Watanabe, T., 1991. Availability of manganese and magnesium contained in white fish meal to rainbow trout Oncorhynchus mykiss. 日本水産学会誌, 57: 99-104. http://jlc.jst.go.jp/DN/JALC/00007258862?from=Google https://doi.org/10.2331/suisan.57.99
Shen, H.M., Chen, X.R., Chen, W.Y., Lin, S.M., Chen, Y.J., Zhang, L. and Luo, L., 2017. Influence of dietary phosphorus levels on growth, body composition, metabolic response and antioxidant capacity of juvenile snakehead (Channa argus× Channa maculata). Aquac. Nutr., 23: 662-670. https://doi.org/10.1111/anu.12433
Shiau, S.Y. and Tseng, H.C., 2007. Dietary calcium requirements of juvenile tilapia, Oreochromis niloticus × O. aureus, reared in fresh water. Aquacult. Nutr., 13: 298–303. https://doi.org/10.1111/j.1365-2095.2007.00481.x
Shim, K.F. and Ho, C.S., 1989. Calcium and phosphorus requirements of guppy Poecilia reticulata. Nippon Suisan Gakkaishi, 55: 1947-1953. https://agris.fao.org/agris-search/search.do?recordID=JP9003977 https://doi.org/10.2331/suisan.55.1947
Skonberg, D.I., Yogev, L., Hardy, R.W. and Dong, F.M., 1997. Metabolic response to dietary phosphorus intake in rainbow trout (Oncorhynchus mykiss). Aquaculture, 157: 11-24. https://doi.org/10.1016/S0044-8486(97)00141-5
Sun, Y., Chen, M., Kong, C., Tang, H., Gan, L. and Zhang, M., 2017. Enclosure experiment of effects of dietary phosphorus level on water quality, phosphorus budget, and plankton composition in intensive culture of crucian carp. Aquacult. Int., 25: 1145-1158. https://doi.org/10.1007/s10499-016-0103-0
Tan, B., Mai, K. and Liufu, Z., 2001. Response of juvenile abalone, Haliotis discus hannai, to dietary calcium, phosphorus and calcium/ phosphorus ratio. Aquaculture, 198: 141-158. https://doi.org/10.1016/S0044-8486(00)00595-0
Vielma, J. and Lall, S.P., 1998. Phosphorus utilization by Atlantic salmon (Salmo salar) reared in freshwater is not influenced by higher dietary calcium intake. Aquaculture, 160: 117-128. https://doi.org/10.1016/S0044-8486(97)00300-1
Vielma, J., Ruohonen, K. and Peisker, M., 2002. Dephytinization of two soy proteins increases phosphorus and protein utilization by rainbow trout, Oncorhynchus mykiss. Aquaculture, 204: 145-156. https://doi.org/10.1016/S0044-8486(01)00653-6
Watanabe, T., Murakami, A., Takeuchi, L., Nose, T. and Ogino, C., 1980. Dietary, requirement of chum salmon held in freshwater for phosphorus. Bull. Japan Soc. Sci. Fish, 46: 361-367. https://doi.org/10.2331/suisan.46.361
Wilson, R.P., Robinson, E.H., Gatlin III, D.M. and Poe, W.E., 1982. Dietary phosphorus requirement of channel catfish. J. Nutr., 112: 1197-1202. https://doi.org/10.1093/jn/112.6.1197
Xie, D., Han, D., Zhu, X., Yang, Y., Jin, J., Liu, H. and Xie, S., 2017. Dietary available phosphorus requirement for on‐growing gibel carp (Carassius auratus gibelio var. CAS III). Aquac. Nutr., 23: 1104-1112. https://doi.org/10.1111/anu.12478
Yang, Q., Liang, H., Maulu, S., Ge, X., Ren, M., Xie, J. and Xi, B., 2021. Dietary phosphorus affects growth, glucolipid metabolism, antioxidant activity and immune status of juvenile blunt snout bream (Megalobrama amblycephala). Anim. Feed Sci. Technol., 274: 114896. https://doi.org/10.1016/j.anifeedsci.2021.114896
Yang, S.D., Lin, T.S., Liu, F.G. and Liou, C.H., 2006. Influence of dietary phosphorus levels on growth, metabolic response and body composition of juvenile silver perch (Bidyanus bidyanus). Aquaculture, 253: 592-601. https://doi.org/10.1016/j.aquaculture.2005.09.002
Ye, C.X., Liu, Y.J., Tian, L.X., Mai, K.S., Du, Z.Y., Yang, H.J. and Niu, J., 2006. Effect of dietary calcium and phosphorus on growth, feed efficiency, mineral content and body composition of juvenile grouper, Epinephelus coioides. Aquaculture, 255: 263-271. https://doi.org/10.1016/j.aquaculture.2005.12.028
Younus, N., Zuberi, A., Mahmoood, T., Akram, W., Ahmad, M., 2020. Comparative effects of dietary micro-and nano-scale chitosan on the growth performance, non-specific immunity, and resistance of silver carp Hypophthalmichthys molitrix against Staphylococcus aureus infection. Aquacult. Int., 28: 2363-2378. https://doi.org/10.1007/s10499-020-00595-0
Zafar, N. and Khan, M.A., 2018. Determination of dietary phosphorus requirement of stinging catfish Heteropneustes fossilis based on feed conversion, growth, vertebrae phosphorus, whole body phosphorus, haematology and antioxidant status. Aquacult. Nutr., 24: 1577-1586. https://doi.org/10.1111/anu.12794
To share on other social networks, click on any share button. What are these?


