Niacin Alleviates the Acidosis of Rumen Epithelial Cells Induced by Low pH Resulting from Volatile Fatty Acids
Niacin Alleviates the Acidosis of Rumen Epithelial Cells Induced by Low pH Resulting from Volatile Fatty Acids
Mengxue Sun1, Yanjiao Li1,2, Zhen Gao1, Qinghua Qiu1,2*, Xianghui Zhao1,2, Lanjiao Xu1,2, Huan Liang1,2, Ke Pan, Mingren Qu and Kehui Ouyang1,2*
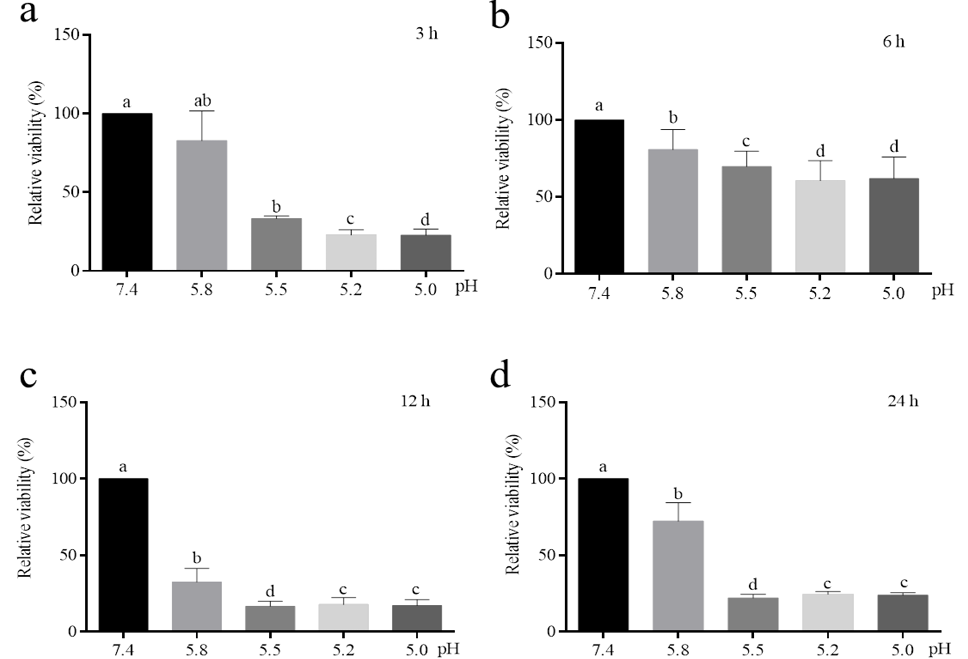
Effects of different solution pH and duration time on cell activity. Cells were treated with different solutions with pH of 7.4, 5.8, 5.6, 5.2 or 5.0 for 3, 6, 12 or 24 h. Relative cell viability was presented as a percentage relative to the control group. a,b,c Mean values within different letters were significantly different (P < 0.05).
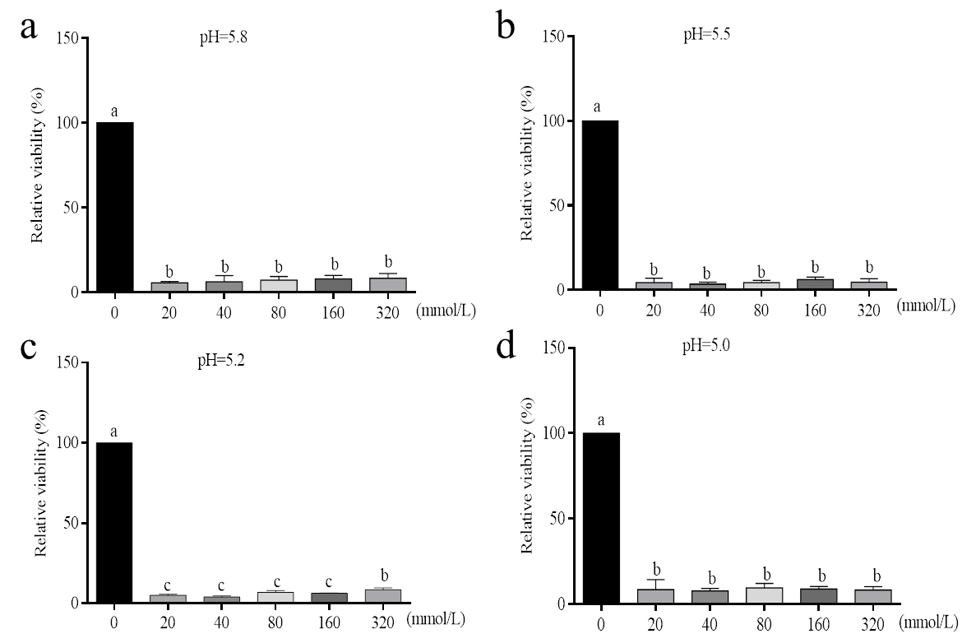
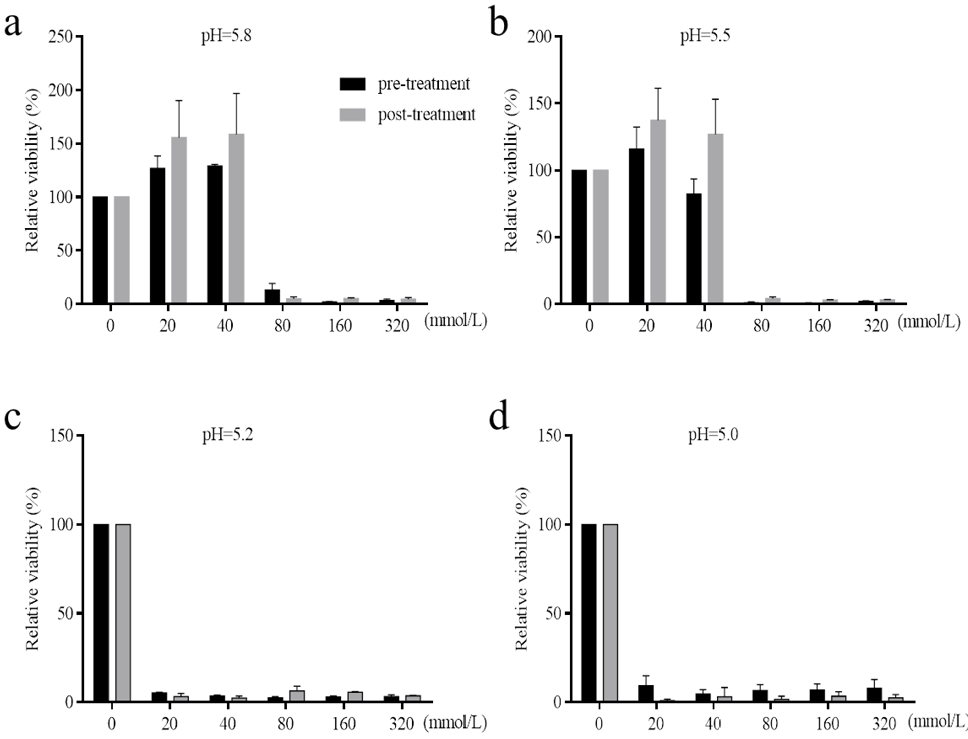
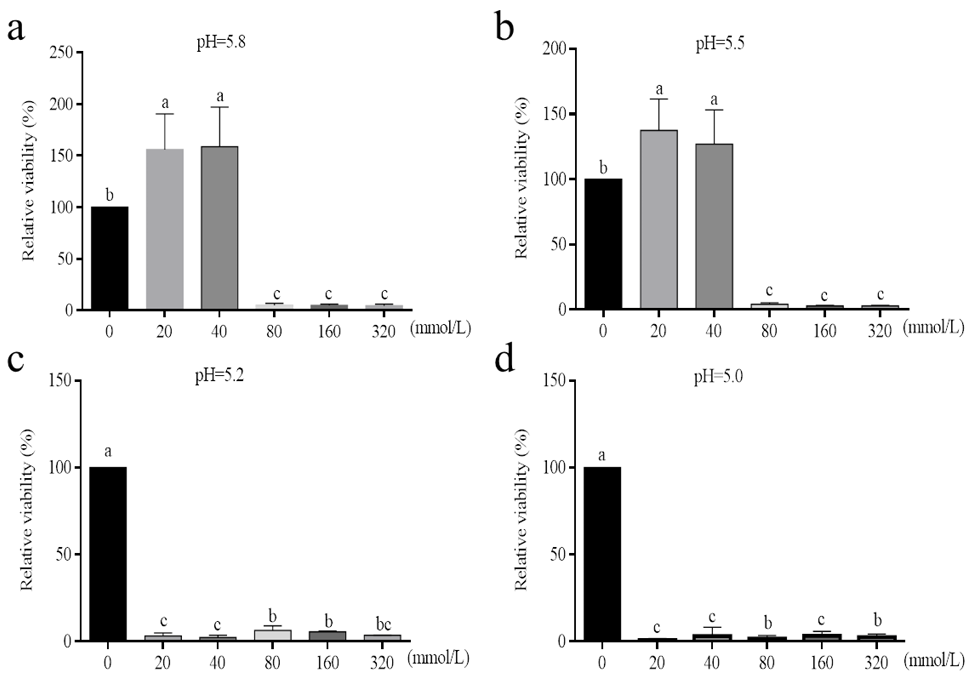
Effects of pre-treatment of niacin on cell viability under low pH. Cells were cultured with niacin (0, 20, 40, 80, 160, or 320 mM) for 12 h before 12 h treatment with low pH (5.8, 5.6, 5.2 or 5.0). Relative cell viability was presented as a percentage relative to the control group. a,b,c Mean values within different letters were significantly different (P < 0.05).
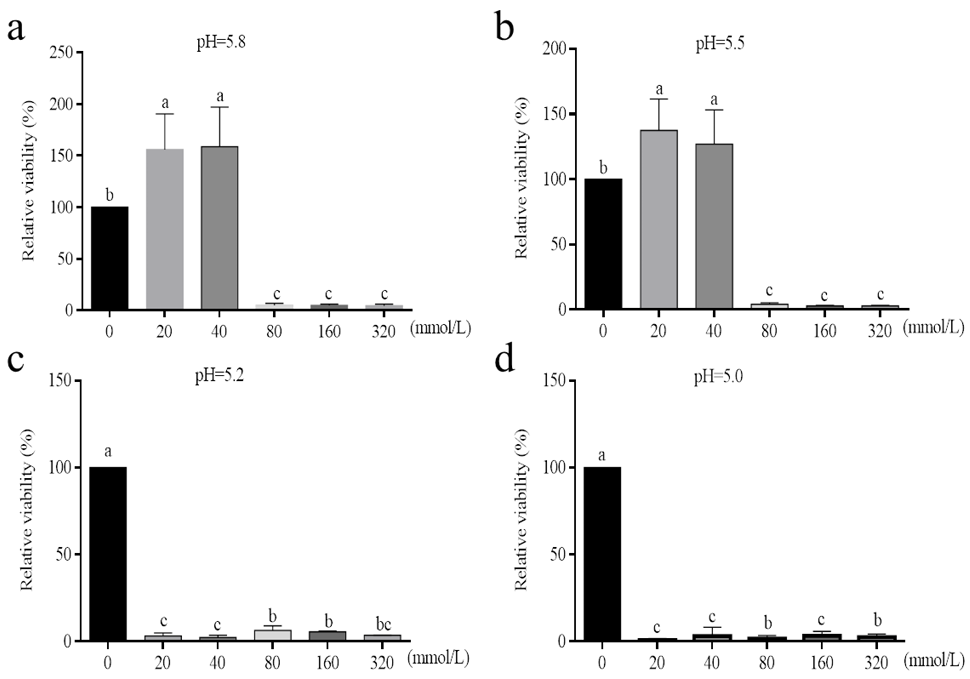
Effects of concurrent treatment of niacin on cell viability under low pH. Cells were cocultured with niacin (0, 20, 40, 80, 160, or 320 mM) and low pH (5.8, 5.6, 5.2 or 5.0) for 12 h. Relative cell viability was presented as a percentage relative to the control group. a,b,c Mean values within different letters were significantly different (P < 0.05).


