
Neuroprotective Effects of Melatonin Against Neurotoxicity Induced by Intrahippocampal Injection of Aluminum in Male Wistar Rats: Possible Involvement of Oxidative Stress Pathway


Neuroprotective Effects of Melatonin Against Neurotoxicity Induced by Intrahippocampal Injection of Aluminum in Male Wistar Rats: Possible Involvement of Oxidative Stress Pathway
Oussama Zghari*, Mouloud Lamtai, Sofia Azirar, Mohamed Yassine El-Brouzi, Hajar Benmhammed, Aboubaker El-Hessni, Ali Ouichou, Abdelhalem Mesfioui
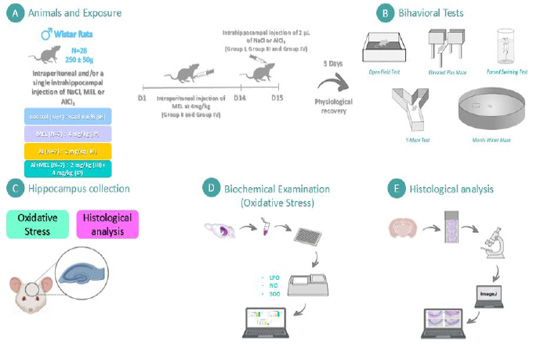
Experimental design of all methodological steps of the study. (A) Sample description of experimental groups and exposure to NaCl (0.9%) or AlCl3; (B) after the intrahippocampal injection, rats were submitted to the behavioral tests assessment through Open Field test (OFT), Elevated Plus Maze (EPM), Forced Swimming Test (FST), Y-maze and Morris Water Maze (MWM) test; (C) The animals were euthanized and the hippocampus was taken; (D) Thereafter, oxidative stress markers (lipid peroxidation (LPO), nitric oxide (NO) levels, and superoxide dismutase (SOD) activities) and (E) histology of CA3 area of the hippocampus were evaluated.

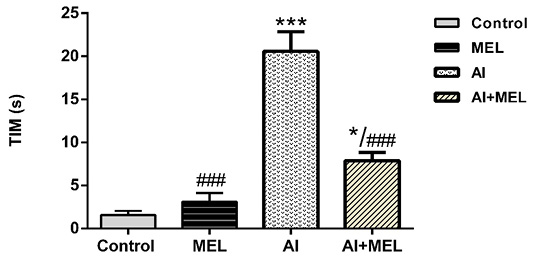
Effect of treatment with Aluminum (2 mg/kg), melatonin (4 mg/kg), and their combination on immobility time (TIM) expressed in seconds in forced swimming test in male Wistar rats. Results are represented as mean ± SEM. *p < 0.05 vs. control group; and #p < 0.05 vs. Al-treated group.
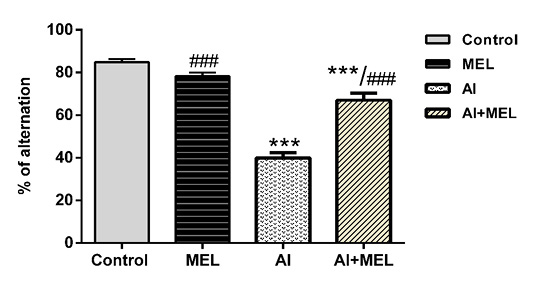
Effects of Al (2 mg/kg) and melatonin (4 mg/kg) on percentage of alternation measured in Y-maze test in male Wistar rats. Results are represented as mean ± SEM. *p < 0.05 vs. control group; and #p < 0.05 vs. Al-treated group.

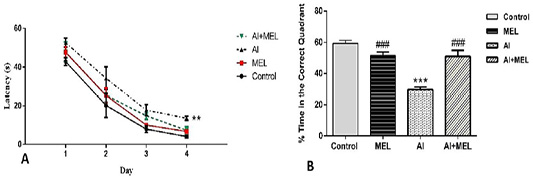
Effects of Al (2 mg/kg) and melatonin (4 mg/kg) on memory performance measured in MWM test in male Wistar rats. (A) Latency to reach the hidden platform on each of the 4 days of learning phase. (B) Percentage of time spent in the correct quadrant. Results are represented as mean ± SEM. *p < 0.05 vs. control group; and #p < 0.05 vs. Al-treated group.

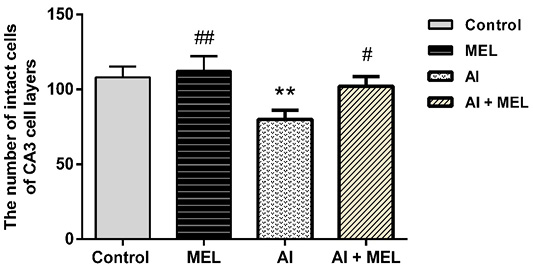
Effect of Al (2 mg/kg), MEL (4 mg/kg) and Al+MEL on the number of neurons in 0.18 mm2 area of CA3 region of hippocampus in male rats. Results are represented as mean ± SEM. *p < 0.05 vs. control group; and #p < 0.05 vs. Al-treated group.
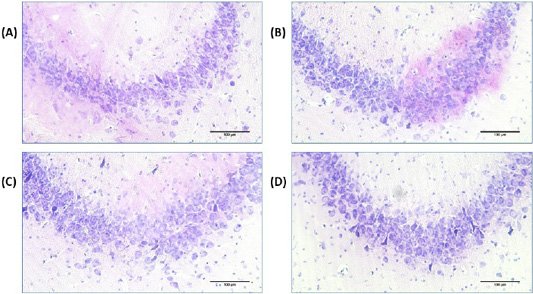
Light micrographs of hippocampus with cresyl violet staining in the control (A), MEL (B), Al (C) and Al+MEL (D) groups in CA3 cell layer of hippocampus in male rats. Bar represents 100μm.

