

Molecular Characterization of Znt Regulon for Multi-Metal Resistance in Klebsiella pneumoniae KW


Molecular Characterization of Znt Regulon for Multi-Metal Resistance in Klebsiella pneumoniae KW
Hafsa Saeed, Soumble Zulfiqar, Abeedha Tu-Allah Khan and Abdul Rauf Shakoori*
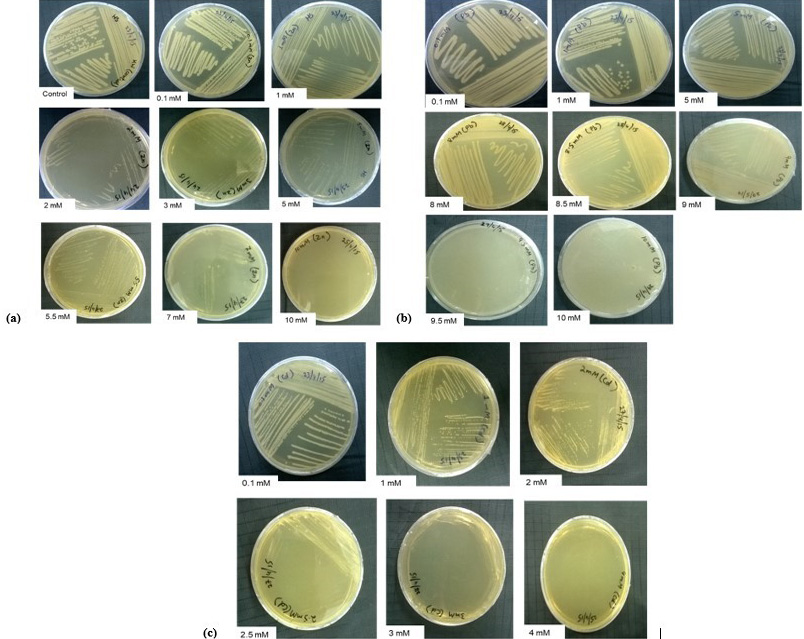
Minimum inhibitory concentrations of heavy metals. Growth of KW was analyzed in the presence of various concentrations of (a) Zn+2 (ZnCl2), (b) Pb+2 (Pb(C2H3O2)2) and (c) Cd+2 (CdCl2.2.5H2O).

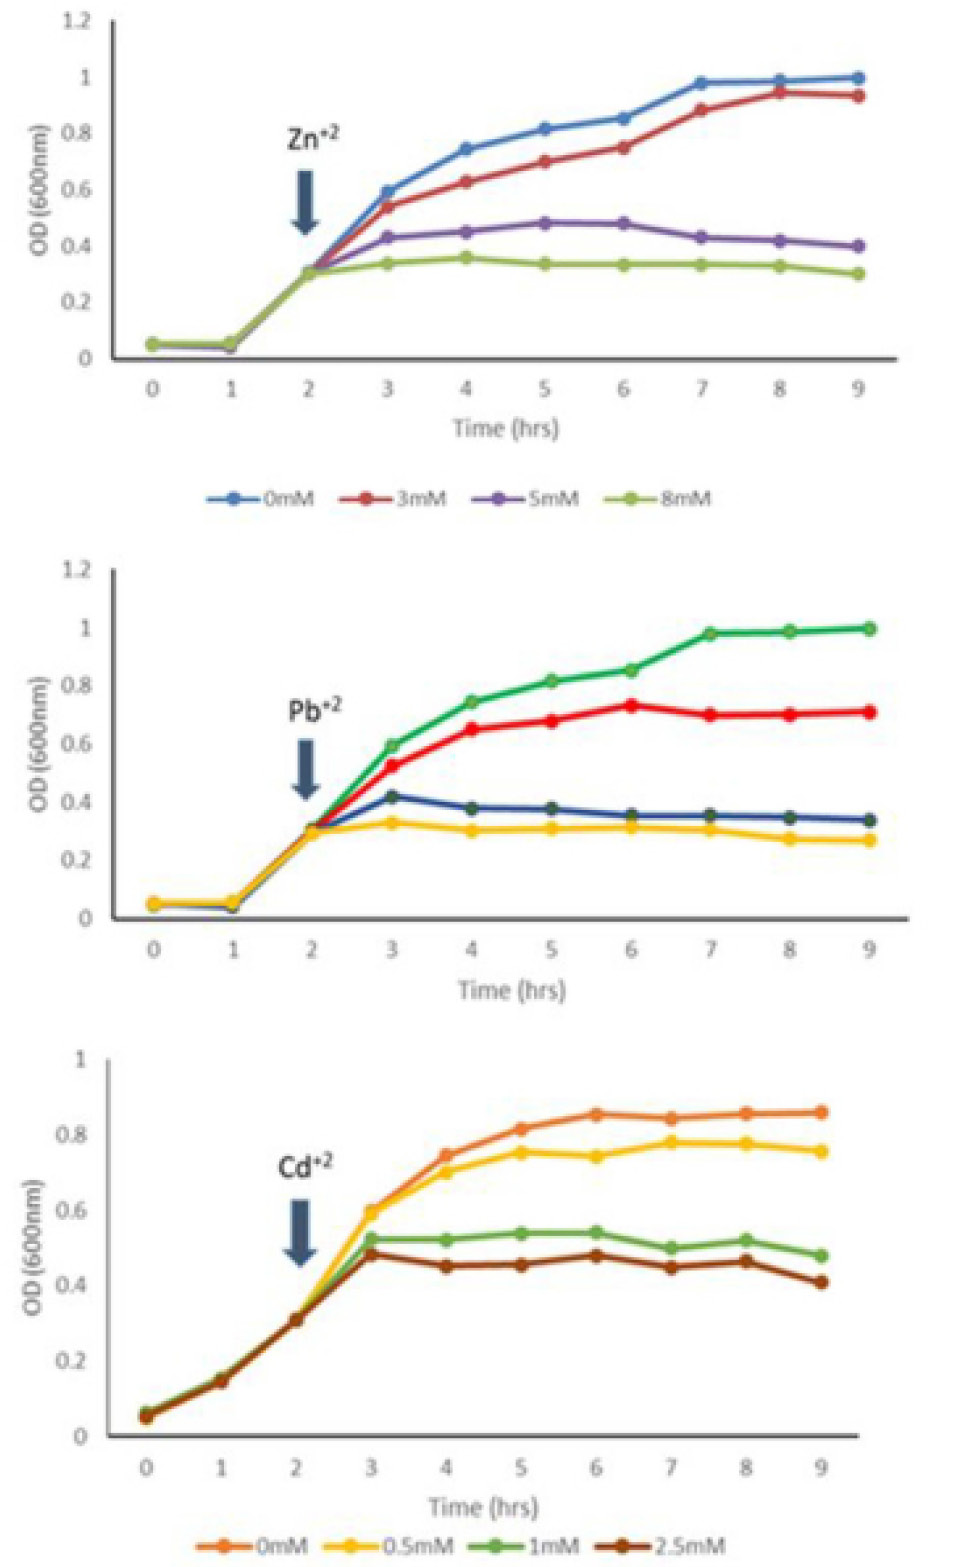
Effect of Zn+2, Pb+2 and Cd+2 on growth of multi-metal resistant K. pneumoniae KW.

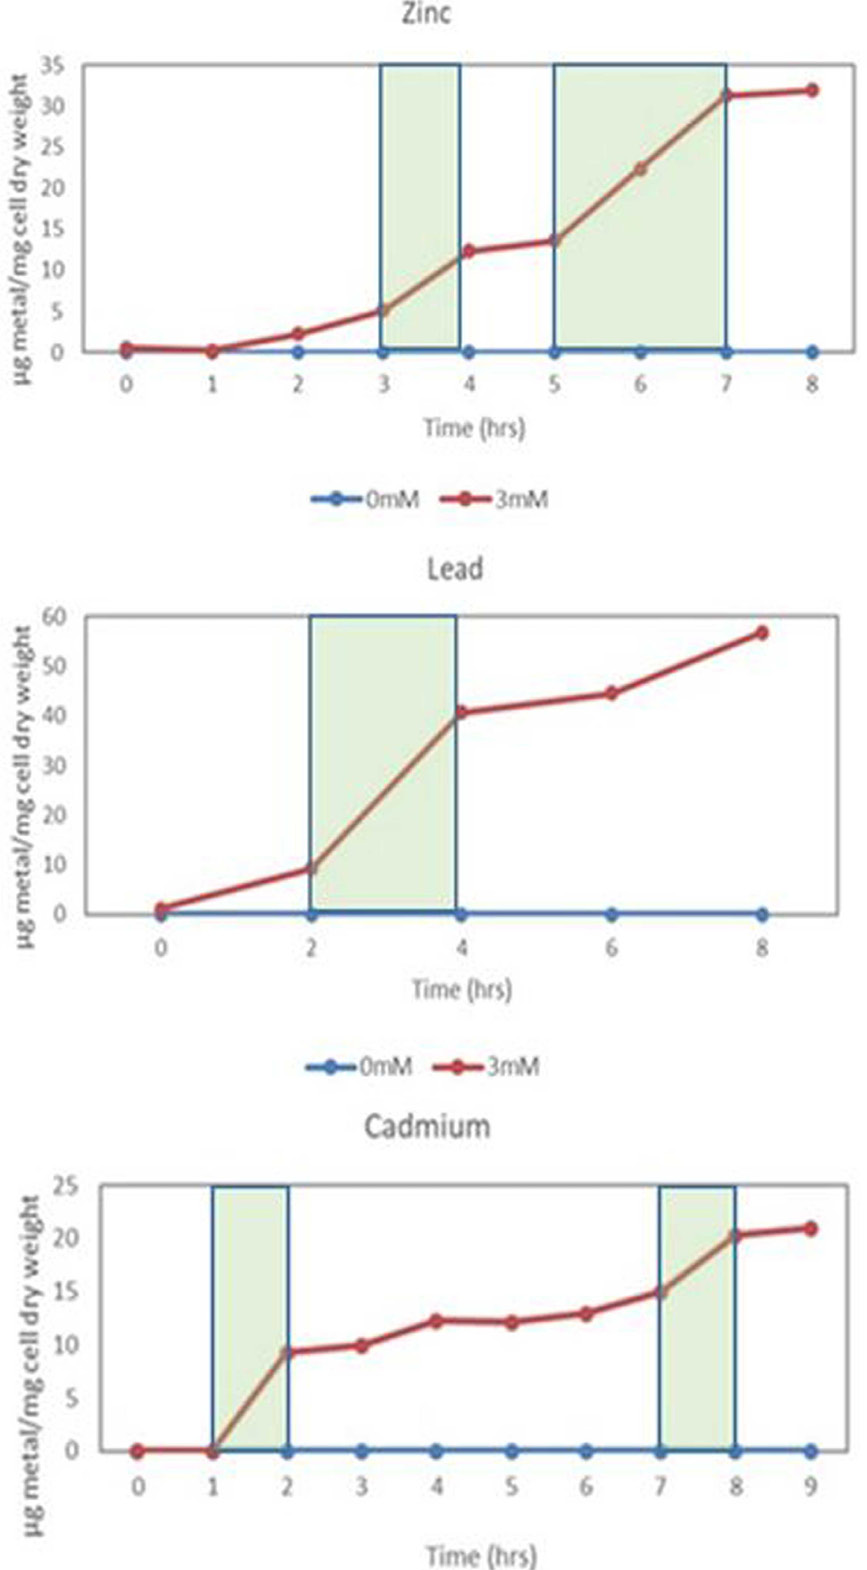
Metal uptake by K. pneumoniae in the presence of 3mM Zn+2, 3mM Pb+2 and 1mM Cd+2. See green shaded area represents rapid uptake rate.

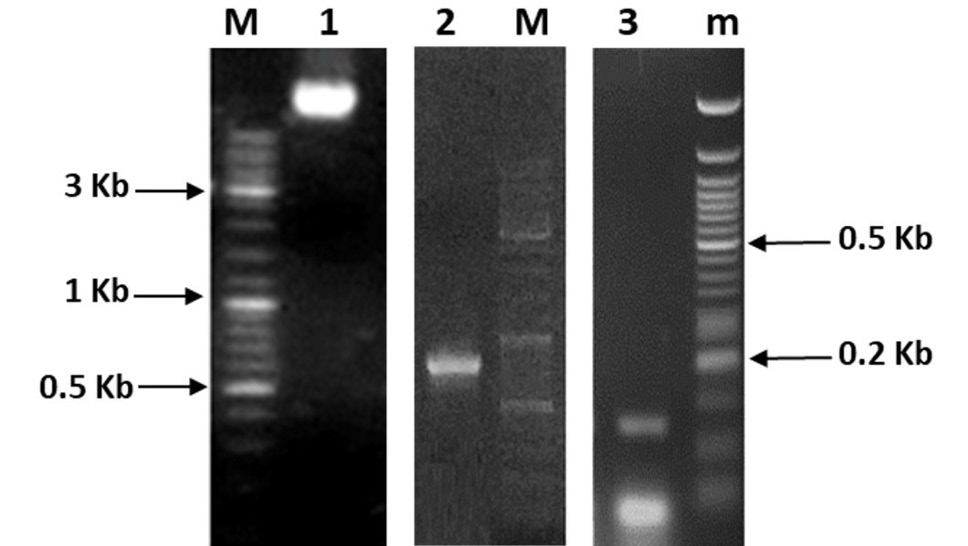
1% agarose gel showing genomic DNA isolated from Klebsiella pneumoniae KW (Lane 1), amplified products of ZntR (810 bp) (Lane 2) and promoter pzntA (Lane 3). DNA ladders used were Fermentas Cat # SM0331 (Lane M) and Fermentas Cat # SM0613 (Lane m).

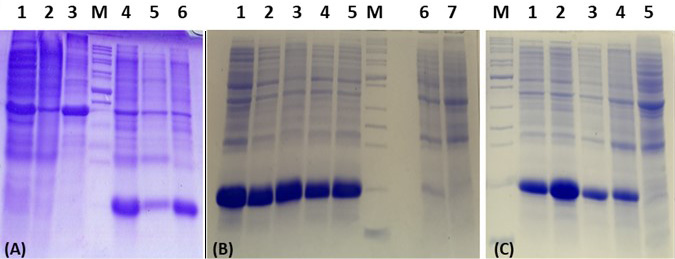
The expression of recombinant protein ZntR after IPTG induction (A) Lanes 1, 2, and 3: proteins from cell lysate, supernatant and pellet from control culture, respectively; Lanes 4, 5, and 6: proteins from cell lysate, supernatant, and pellet from culture expressing ZntR, respectively. Bands at 15kDa in lanes 4-6 represent ZntR protein. (B) Optimization of IPTG concentrations for ZntR expression. Lanes 1, 2, 3, 4 and 5: IPTG induction at concentrations of 0.01, 0.05, 0.1, 0.5 and 1 mM, respectively; Lane 6: No IPTG and lane 7: pET21 vector without ZntR insert. (C) Optimization of IPTG induction time. Lanes 1, 2, 3, and 4: IPTG induction for a time of 2, 4, 6, and 8 hr, respectively; Lane 5: No IPTG. Lane M: Protein ladder (Benchmark cat.no. 10747-012).
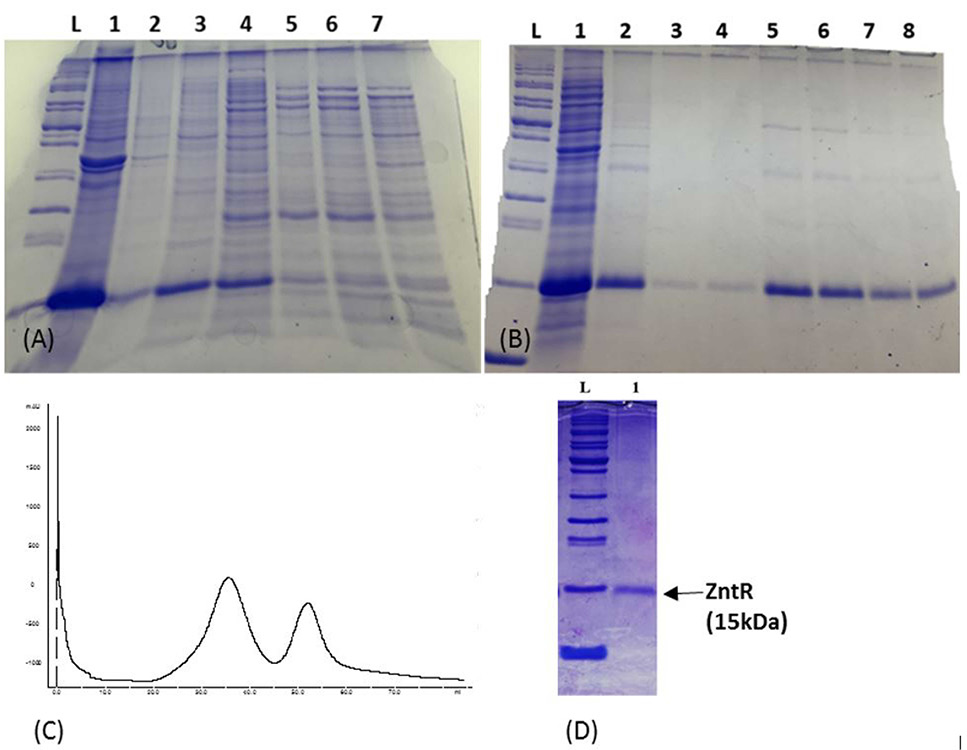
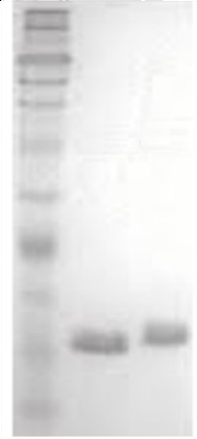
Purification of ZntR (A) Fractionation by ammonium sulphate precipitation. Lanes 1, 2, 3, 4, 5, 6, and 7: Fractions obtained at 20%, 30%, 40%, 50%, 60%, 70%, and 80% saturation levels of ammonium sulphate, respectively. (B) Fractionation by anion exchange chromatography. Lane 1: Sample before FPLC; Lanes 2-8: Fractions obtained from anion exchange column HiTrap QFF. (C) Chromatogram showing elution profile of recombinant ZntR [X-axis, volume of buffer (mL), Y-axis OD280nm mAbs unit]. The peak represents maximum protein elution between 30-40% NaCl gradient. (D) SDS-PAGE showing protein after dialysis. Lane 1: Partially purified ZntR protein. Lane L: Protein ladder (Benchmark cat.no. 10747-012).

Activity assay for recombinant ZntR. Lane 1: promoter pzntA alone, Lane 2: promoter pzntA and ZntR appeared at comparatively higher molecular weight position.

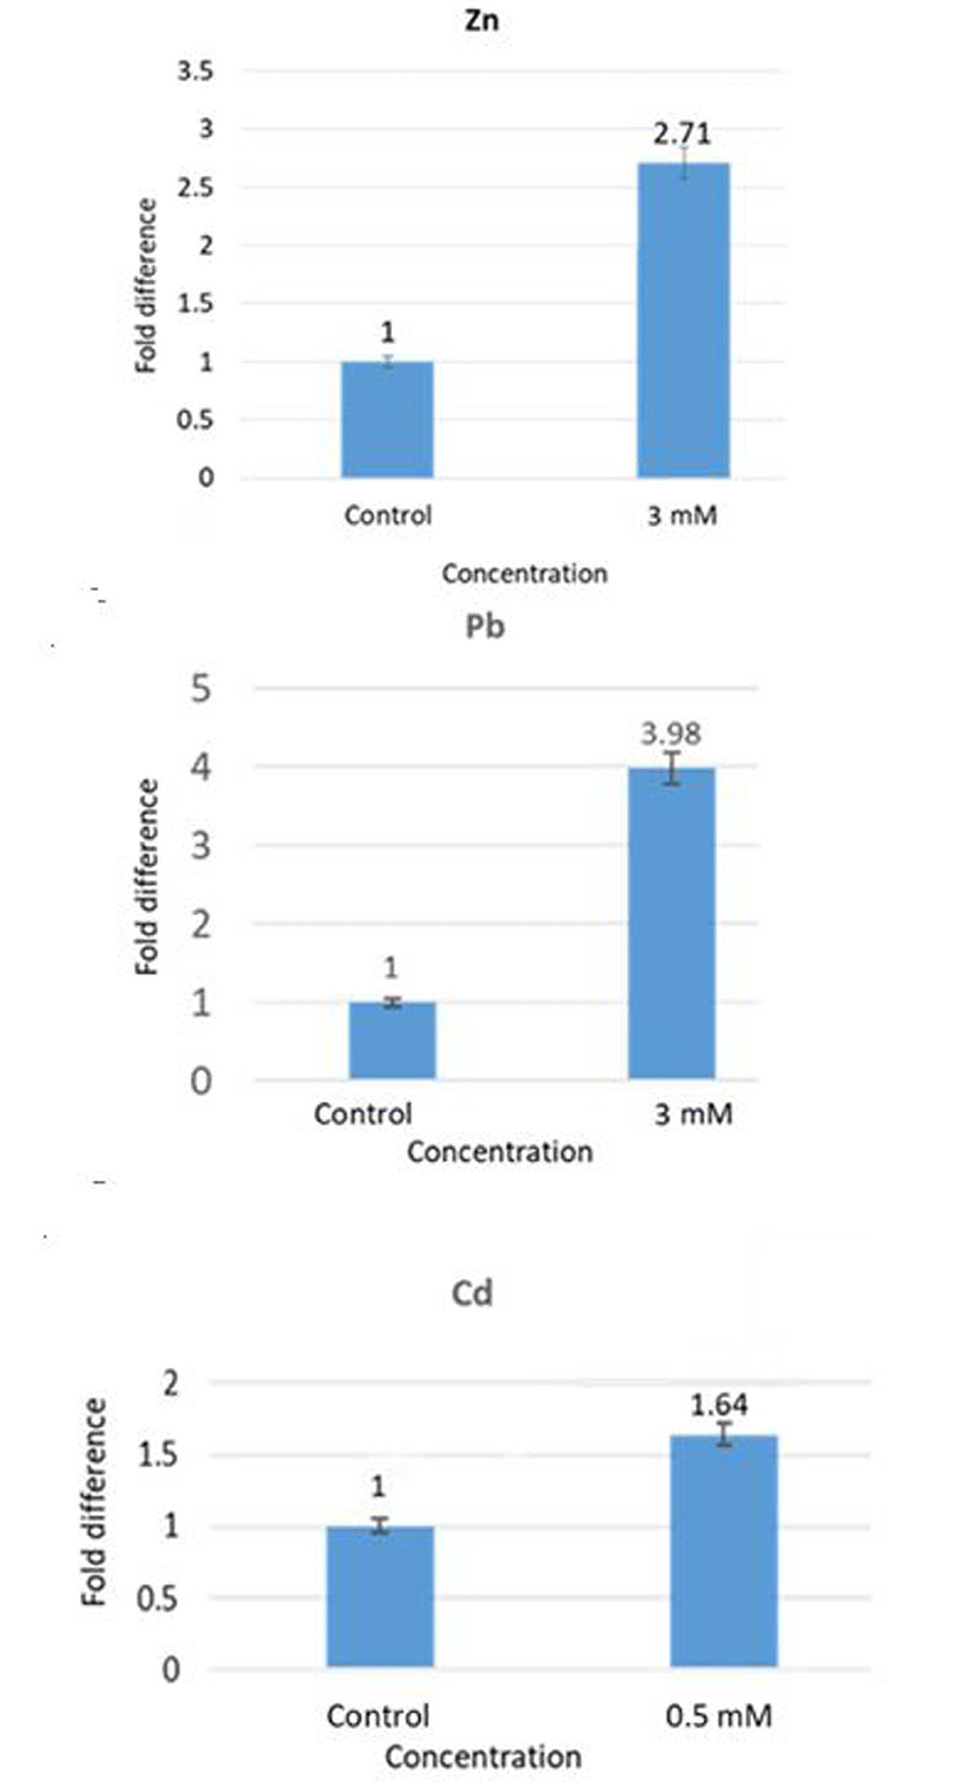
Effect of Zn, Pb and Cd on the transcription of zntR. Upregulated expression of zntR indicates its induction by the metals.

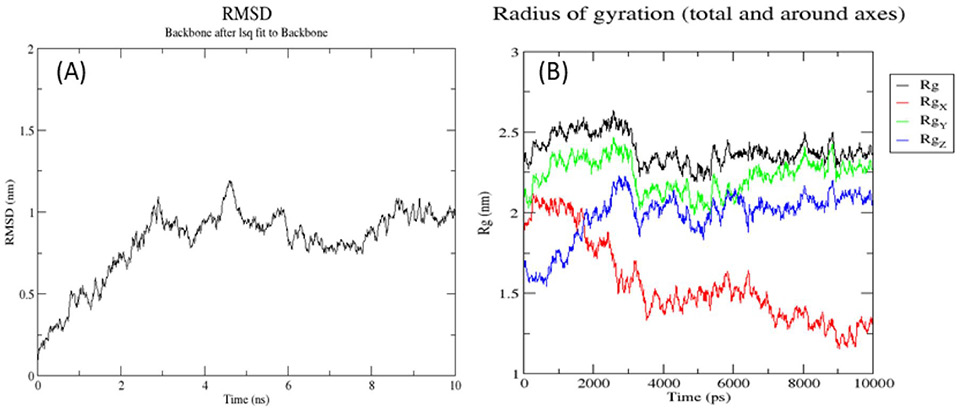
Root man square deviation (RMSD) (A) and radii of gyration (B) of 3D predicted structure of ZntR protein.

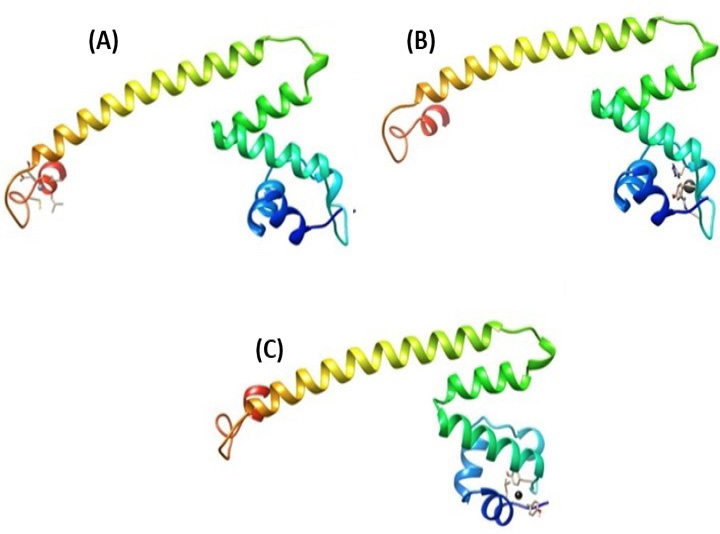
Binding of metal ions with ZntR. Full protein view. (A) Zinc; (B) Lead; and (C) Cadmium.
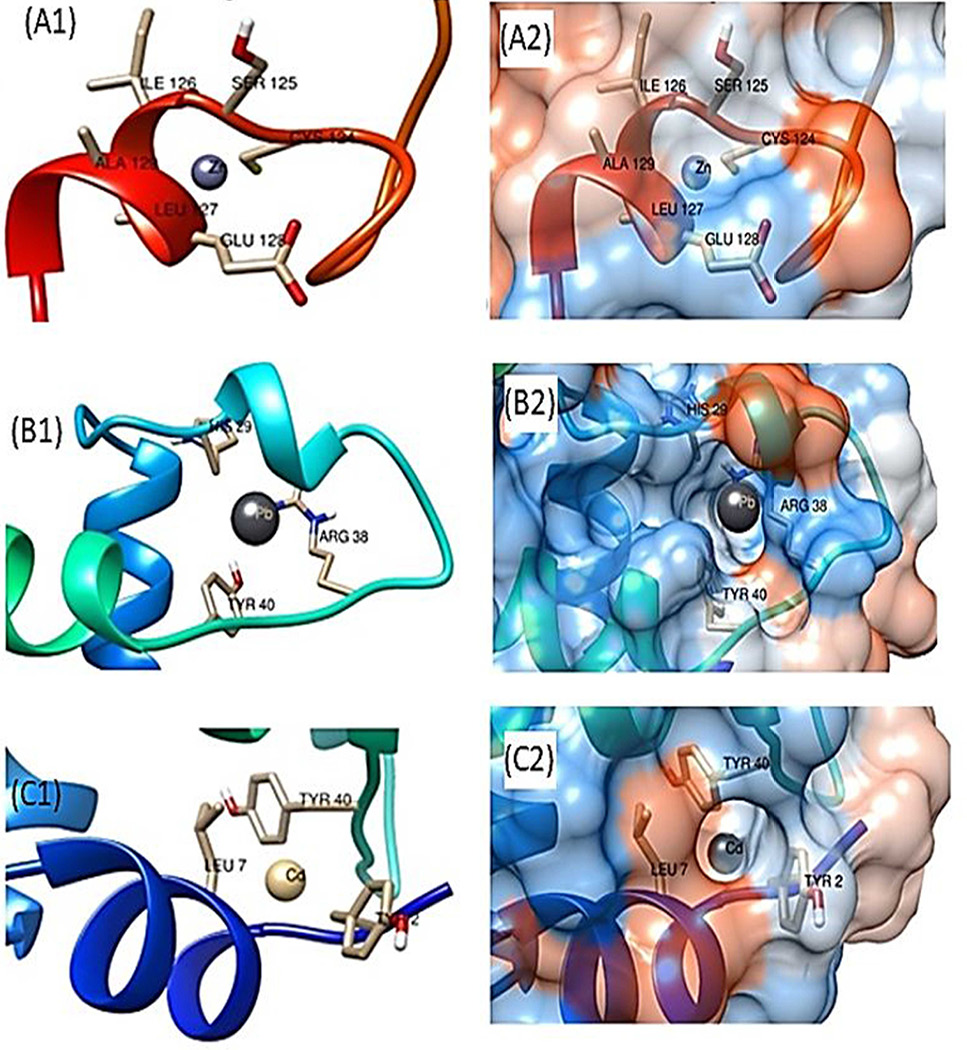
Zoom in metal binding pockets and hydrophobicity view of ZntR for zinc (A1and 2), lead (B1and 2) and cadmium ions (C1and 2), respectively.

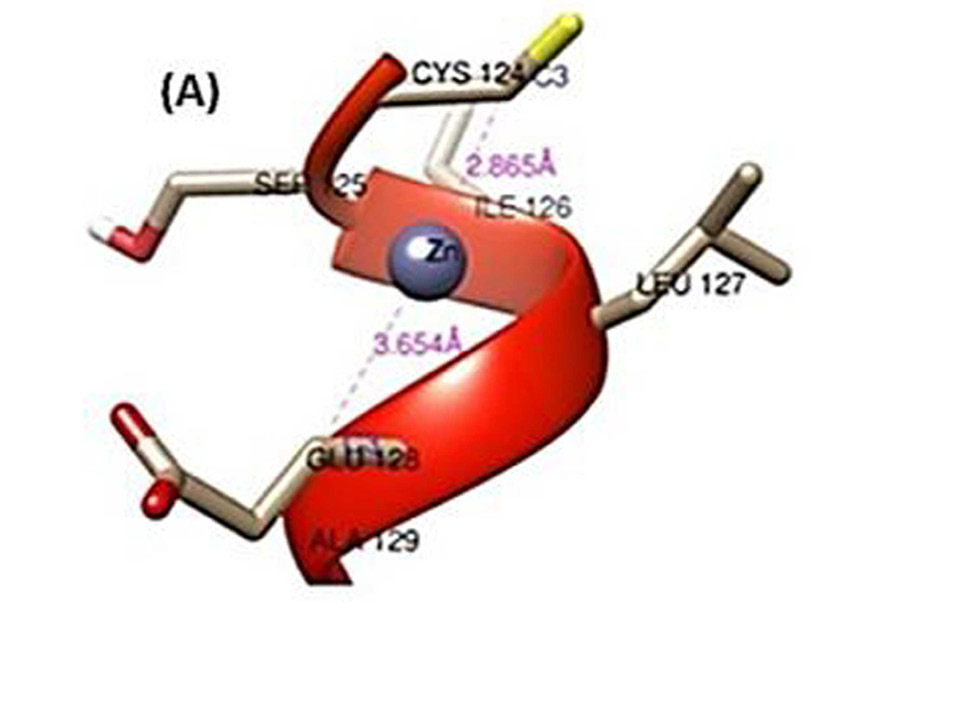
Zoomed in view of interacting residues only. Distances are shown in magenta while names of interacting atoms are in medium blue. (A) Zinc; (B) Lead; and (C) Cadmium.


