
Measuring Multidimensional Poverty Among Farm Households in Rural Pakistan Towards Sustainable Development Goals


Research Article
Measuring Multidimensional Poverty Among Farm Households in Rural Pakistan Towards Sustainable Development Goals
Muhammad Israr1*, Helen Ross2, Shakeel Ahmad3, Nafess Ahmad4 and Urooba Pervaiz5
1Department of Rural Development, Faculty of Rural Social Sciences AMKC, Mardan, The University of Agriculture Peshawar, Khyber Pakhtunkhwa, Pakistan; 2School of Agriculture and Food Sciences, Faculty of Science, The University of Queensland, Australia; 3School of Environment, Tsinghua University, Beijing 100084, China; 4Department of Economics, University of Malakand, Chakdara Dir Lower, Pakistan; 5Department of Agricultural Extension Education and Communication, The University of Agriculture, Peshawar Khyber Pakhtunkhwa, Pakistan.
Abstract | Poverty is multidimensional and presents a great threat to achieving the targets of the “Sustainable Development Goals” (SDGs) across the world. This study makes contribution to the ongoing debate regarding capability, social exclusion, and participatory approaches as measuring strategies for farm poverty. This study was designed to develop a new methodological framework to measure multidimensional poverty that builds on the previous index for measuring three dimensions of poverty at the micro level, and a method to calculate the extent of poverty by using the Alkire and Foster model. The expanded dimensions of multidimensional poverty identified are wealth status, participation/empowerment, environment, health, education, and standard of living. We apply the methodology to a study in northern Pakistan. The index of multidimensional poverty demonstrates that alongside the other dimensions there is severe poverty in terms of environment, empowerment/ participation, and wealth dimensions. The measure of intensity of the poverty shows that 55% of the population was severely poor while the MPI value demonstrated that 54% of the population was severely poor. The regional and resource-related causes contributing to this poverty include isolation and remoteness of the area, low infrastructure, and poor access to markets and to social and communal services. The study suggests that multi-sectorial interventions and investment in terms of education, infrastructure, environment, financial services and agriculture development are necessary to overcome the situation and improve the likelihood of achieving the targets of the SDGs.
Received | July 12, 2019; Accepted | December 01, 2019; Published | February 01, 2020
*Correspondence | Muhammad Israr, Department of Rural Development, Faculty of Rural Social Sciences AMKC, Mardan, The University of Agriculture Peshawar, Khyber Pakhtunkhwa, Pakistan; Email: [email protected]
Citation | Israr, M., H. Ross, S. Ahmad, N. Ahmad and U. Pervaiz. 2020. Measuring multidimensional poverty among farm households in rural pakistan towards sustainable development goals. Sarhad Journal of Agriculture, 36(1): 130-142.
DOI | http://dx.doi.org/10.17582/journal.sja/2020/36.1.130.142
Keywords | Multidimensional poverty index, Poverty intensity and severity, Sustainable development goals and micro-level poverty
Introduction
The origins of multiple dimensional poverty analysis go back to Sen’s (1979, 1985) capability theories, which clarifies that financial and social courses of action ought to be assessed regarding individuals’ abilities and capacities to lead their preferred life. Poverty is by and large characterized in connection to a given setting, which might be worldwide, territorial, and national, regional or personal (Daimon, 2001). Poverty is an idea that is not effortlessly characterized and measured. Further, recognizing the poor for any social mediations is normally testing with respect to precisely focusing on qualified recipients (Aryeetey et al., 2013). The complexity of measuring poverty reflects the plural character of its definition (Bossert et al., 2013). A few conceivable outcomes have been proposed in hypothetical and experimental writing by various specialists (White, 2017), but overall the body of evidence suggests that poverty is a multidimensional phenomenon, referring to multiple aspects of well-being beyond shortfalls in income or consumption which is, a myopic perspective for understanding poverty (Alkire and Sumner, 2013; Alkire and Santos, 2010; Garroway and de-Laiglesia, 2012; Paris HLP, 2013; UN, 2013; OECD, 2013).
Poverty, being multi-dimensional in nature, is the result of different banding financial variables including handicap, lack of education, old age, household size and status, reliance, low wages of female laborers, and family unit obligations (Rahman, 2013). Poverty is related not just one with measurement i.e. income/consumption, but in addition with lacking results in regard to wellbeing, sustenance, literacy, insufficient social relations, weakness, low confidence, and feebleness (UNDP, 2015). Levine et al. (2014) noted that these deprivations also occur in ecology and poverty occurs when an individual or household experiences a number of cumulative deprivations. Very recently, it has been argued that the conceptual space of poverty includes dimensions such as hunger, powerlessness, voice-lessness, dependency, shame and humiliation, lack access to basic infrastructure, little attention for schooling, economic vulnerability, ill-health and gender inequality (UNDP, 2015; Gerlitz et al., 2015; WB, 2015).
Measuring multi-dimensional poverty generally includes the construction of an index incorporating information from a range of indicators of selected dimensions. At that point sufferings on a base number of the measurements are chosen, and soon thereafter one is viewed as poor. Laderchi et al. (2013) identified four types of approaches; i.e. monetary, capabilities, social exclusion and participation as a measurement strategy for the poverty. The Multi-dimensional Poverty Index (MPI), created by the Oxford Poverty and Human Development Initiative (OPHI), is depicted by its makers as an index of intense multidimensional poverty with respect to especially simple managements and core human functioning (Alkire and Foster, 2011a). The MPI decides multidimensional poverty not by income, but rather by deprivation on three measurements: wellbeing, education, and way of life at the household’s level, utilizing ten indicators crosswise over nations and within nations (Alkire and Foster, 2011b). Our study explores three further dimensions: Environment, participation/empowerment and wealth/assist as a measurement strategy for poverty in addition to Alkire and Foster’s (2011a) three dimensions.
Environment
For participation in natural resource management (NRM) activities in rural areas one needs to consider the abundance of natural resources, and community involvement to benefit from these directly or indirectly. During the last couple of decades, community-based natural resource management has been a widely adopted mechanism to combine rural development, prevention of environmental degradation and to reduce rural poverty (Imperiale and Vanclay, 2016; Fabricius et al., 2013; Hulme and Murphree, 2001). The literature demonstrates that linkages between poverty and environment have a long history in the development world. Environment plays a critical part in the life of individuals living in poverty. The poor are more helpless against natural calamities and the effects of environmental change (Gabol et al., 2012). Their helplessness is inseparably connected with their living in ineffectively developed homes, frequently in groups presented to ecological dangers, for example, surges, avalanches or dry spells. The poor are additionally packed in regions lacking fundamental wellbeing managements or framework (Bailey and Lewis, 2009). Further, the welfare misfortunes related with environmental change are probably going to be considerably more prominent for poor nations and needy individuals (WB, 2011).
Participation
In the multidimensional view of poverty, the poor are compelled in their workplace characterized as “what the individual is allowed to do and accomplish in quest for whatever objectives or qualities he or she sees as vital” (Sen, 1985). The idea of workplace is applicable in every single social experience, incorporating into the instance of participation in development activities (Kohl-Arenas, 2011; Ansoms, 2013). The literature on participatory approaches explains that this form of development involves participation of stakeholders such as government, beneficiaries, donor agencies and NGOs, and the local residents (Khan and Bibi, 2011). Recipients’ awareness about development organizations is also important for getting the maximum benefits from development and poverty reduction activities (Carrillo et al., 2007; Gibson, 2015). Cooperation and neediness decrease have as of late increased impressive significance in the dialect of traditional improvement (Cornwall and Brock, 2005; Dhakal et al., 2007). The literature points to a close positive association between poverty and participation, and to long relationship with social developments and with the struggle for citizenship rights and voice (ILO, 2002; Cohen and Uphoff, 1980; Salole, 1991).
Wealth
Wealth and household welfare are positively related and in this case land possession, household’s head’s profession, presences of physical assets, and cultivated land availability play an important role (Mosites,2016; Israr et al., 2013; Li et al., 2014).
Health
Health dimensions have been measured according to the indicators of the number of ill and disabled persons in the household, access to a hospital in terms of time taken, and access to maternal health services at the local hospital (Holmer at al., 2015). The relation between health and poverty is negative and high health is associated with low poverty. Lengthy ill-health, disability in the household, absence of access to health managements and maternal health are motivations for poverty spirals and, thus poverty can make and sustain weakness status (Holmer at al., 2015). The importance of household health status can be seen by the fact that the UN new development agenda Transforming our World, 2030 defines health in goal 3 of the SDGs as to “ensure healthy lives and promote well-being for all at all ages,” and advances 13 targets to be achieved by 2030 in order to reduce health poverty in all its forms.
Education
Education is fundamental in schools and for kids, as well as for individuals of any age. This is placed as goal number 4 of the SDGs, and the Millennium Development Goal (MDG) of general primary education has been extended with 10 SDG targets tending to all areas of education (WHO, 2015). The fulfillment of fundamental education is additionally generally viewed as basic to education, numeracy and educated citizenship. Households with poorer educational achievement are at great risk of poverty (Hills et al., 2010). Education is firmly connected to better wellbeing. In the literature, negative relationship amongst poverty and kids’ subjective capacities and social-enthusiastic competence has been identified (Mayer, 2002).
Living standards
The literature also demonstrates that individuals living in poverty will probably encounter the vast majority of the types of house quality issues. Low quality housing may make the danger of poverty, or intensify the impacts of poverty, on expectations for everyday comforts and life opportunities (Tunstall et al., 2013). The dominant part of individuals living in developing nations need consumable water in the house, flush toilets, good quality fuel to use, cooking facilities and lighting facilities. They also tend to have less satisfactory and stable house structures, and lack home ownership (Tunstall et al., 2013; Azpitarte, 2010).
The current study
This study fills a gap in the multidimensional poverty literature by establishing that the extreme poverty of the poor regularly depends straightforwardly or in a roundabout way on biological systems and the assorted variety of services they give, as well as uncertain rights of the poor to ecological assets, lacking access to natural data, markets and basic leadership. These factors limit their ability to guarantee the sustainable earth system and enhance their occupations and comfort. Ecological hazard factors represent up to one-fifth of the aggregate weight of ailment in developing nations (WHO, 2009). This is because the complicated connection between human prosperity, environment services and biodiversity requires a coordinated approach including associations between common society, health, education, and wealth and public/private sector.
This study follows the MPI procedures developed by Alkire and Sumer (2013) which offer flexible methods for identifying the poor, severely poor and extremely poor in a two stage approach. The newest income poverty estimates, the 2015 MDGs report (Sachs et al., 2016) and the SDGs for the next 15 years have accelerated discussions in academia and among policy makers in developing countries about the need for measures of poverty that better reflect the multiple dimensions of poverty and deprivation (Sachs et al., 2016). According to the World Bank Global Monitoring Report (2015) in Pakistan, the multidimensional poverty rate in 2013–14 was 44%, while the income based poverty was 13%, showing noteworthy contrasts in the two methods of measurement.
This study was designed for rural Pakistan, to study the context of multidimensional poverty by increasing the number of dimensions examined, and translating to a micro level, within a region. The study has the following objectives:
- 1. To develop and improve a methodological framework to measure multidimensional poverty.
- 2. To measure the extent and severity of poverty at the micro-level in northern Pakistan.
Materials and Methods
Study area
In Pakistan poverty is a long term problem with its incidence at 28%. Levels of poverty vary among the provinces, regions and districts, and also among the groups of the population. Family units headed by uneducated people working in less paid jobs are poorer than households headed by educated people, who tend to have well-paid jobs.
The area of Khyber Pakhtunkhwa comprises 26 districts with various societies and languages, and is the smallest of the four territories of Pakistan in terms of area but the third largest in terms of population. The zone is exceptionally differing, involving the high mountains of the Hindu Kush in the north and the Indus plain in the south. Khyber Pakhtunkhwa has differing environmental frameworks, from the snowy, forest covered mountains to bone-dry reaches. It stretches out from the infertile slopes of the tribal regions to the fertile rural Peshawar valley. The study location comprised four purposively selected districts of the northern areas of Khyber Pakhtunkhwa province of Pakistan (Figure 1): Shangla, Battagram, Kohistan and Tor Ghar. These were selected as they hold the top positions in the poverty and other development indicators of Human Development Index among the 26 districts of the province, and also because 100% of their populations are rural and depend mainly on subsistence farming and associated activities for livelihood. The incidence of poverty in the selected provinces is 38% (Irfan, 2011).
Developing additional dimensions for poverty measurement
This method followed here replaces the traditional unidimensional measure of poverty and generalizes the standards income poverty measures of Foster et al. (1990) which are the poverty gap, squared poverty, and the headcount ratio, by proposing their analogs in a multidimensional setting. Poverty gap, squared poverty, and the headcount ratio are all unidimensional in nature, and make it difficult to identify the poorest of the poor. The method suits the measurement of the multidimensional aspects of poverty as it can incorporate ordinal, discrete and categorical data. It can apply to various units of analysis: the individual, households, and countries. The method essentially takes two steps, (1) identifying who is poor, then (2) incidence, depth of severity of poverty (Alkire and Foster, 2014). This method uses a two cut-off for the identification of the multi-dimensionally poor, i.e. a deprivation cut-off (the level on each dimension of poverty upon which an individual or household is deemed to be ‘deprived’) and a multidimensional poverty cut-off (verse category), based on the minimum number of dimensions on which a person needs to measure as ‘deprived’ in order to qualify as multi-dimensionally poor (poverty cut-off) (Alkire and Foster, 2014). Following Alkire and Foster (2011), it measures the deprivation count on each dimension of poverty (deeming an individual as poor, or not-poor, according to a cut-off), then creates an aggregate deprivation value showing how each unit (e.g. person or household) is situated with respect to all of the dimensions of poverty, taken together. This explains that people are identified as poor/not poor on each dimension, using the cut-off (identification step), then an aggregation measure is created which is an overall measure of multi-dimensional poverty (aggregation step).
This investigation depends on the Multidimensional Poverty Index (MPI) approach created by Alkire and Foster (2011), which is based on two major steps; namely identification of the occurrence of being ‘poor’ (who is poor) on the part of each individual on each dimension, and the aggregate deprivation value of poverty across the multiple dimensions.
Let us consider i=1,2,3……n as the number of households in the selected population, i=1,2,3……L is the multiple dimensions of poverty with the condition that L ≥2, and j=1,2,3……d with a condition that d ≥ L, be the indicator representing the dimensions. Let yij represent the achievement of Household i in indicator j in the selected population that y=[yij] is a n×d matrix of achievements. The row vector yi has all achievements of household i, while a column
vector yj is the distribution vector of dimensions j for each household. A household has different levels of achievement over the dimensions, ranging from minimum to maximum values. In this situation, there is a need for a cut-off point to decide which households are deprived in a particular dimension. When the household’s achievement is below the cut-off point, that household is declared as deprived (verse)/poor on that dimension. More than one cut-off may be used, for instance to differentiate households considered as deprived or multi-dimensional poor.
Let us also consider that Zj be the specific predetermined poverty thresholds below which a household is measuring as poor destitute in the j, where z is a (1×d) vector of the poverty threshold. Let wj denote the weight suggesting the relative importance of indicator j with the condition that (wj>0), such that (Σdj=1 wj=dI); w is a (1×d) matrix of weighting. If a household is deprived in the indicator j, so that (yij<zj) only a matrix of deprivation g is constructed by using this identification function i.e. go = [goij] denotes the (n×d) deprivation matrix. This implies that goij =1, if yij ≤ z and goij =0, if yij > z. Let ci (0 ≤ ci ≤ d) present the sum of weights for the indicators in which the household i is poor. This is the submission of all the entries in the ith row of go and is the (n×1) matrix of deprivation counts. The vector c is simply multiplied with the vector of weights associated with each dimension. Households will be identified as multi-dimensionally poor if c0i ≥ k, where k (0 < k ≤ d) specifies the second cut-off for the measurement of household poverty.
Identification of the proportion of poor within the population uses the ‘head count ratio’ H. This is the extent of populace that falls underneath the poverty line selected through the cut-offs that is the poor or the deprived, poor plus the deprived. H=H (y, z) such that H=q/n, where q(y, z) is the number of all poor households in the population zk. For the measure of the aggregate poverty the adjusted headcount or intensity of poverty is used, which considers the extent of deprivation faced by the poor. To overcome this problem, the MPI approach used the intensity of poverty which is measured as the average weighted deprivation faced by the households who fall below poverty line. This is also the fraction of possible dimensions d in which the multi-dimensionally poor are deprived.
The MPI measure is the product of two components, i.e. incidence and depth or severity.
MPI =H×A
Where;
H= Percentage of people who are poor, or i.e. the share of the population that is multi-dimensionally poor (incidence measure) and A = Average percentage of dimensions in which poor people are deprived, i.e. the weighted deprivation share of multidimensionally poor households (severity measure).
The principal segment is known as the multidimensional headcount proportion (H) and it is H= q/n, where the q is the quantity of households who are multi-dimensionally poor and n is the aggregate population, while A is the normal deprivation score of the multi-dimensionally poor households;
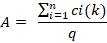
Here ci(k) is the censored deprivation score of household i, and q is the number of households who are multi-dimensionally poor. The k value provides the information about the severity and vulnerability of poverty. The aggregate cut-off point lower than the poverty line k identifies the poor in severe poverty, while the aggregate cut-off point, slightly lower than k provides the headcount ratio vulnerable to poverty. This means that people scoring beyond the first cut-off are classified as in severe poverty, and those between the first and second cut-offs are classified as vulnerable.
Dimensions, indicators and cut-off points
Health, education, and the standards of living are the three dimensions used by researchers such as Alkire and Sumner (2013) and the UNDP (2017) in Human Development Reports, for measuring the extent of multi-dimensional poverty across the world, among the different countries, and within countries. It is very difficult to include particular dimensions and indicators to study and measure poverty, because the choice is difficult as some of the concept is difficult to measure. This study used the MPI 2010 (Alkire and Santos, 2010) criteria for the inclusion of different dimensions and indicators, as these were derived from participatory studies providing value judgments to select capabilities (Alkire and Santos, 2010). This study also includes three other dimensions i.e. participation, environment and wealth in addition to the commonly used health, education, and standards of living. Table 1, present the details of the dimensions, indicators, weights and deprivation cut-offs chosen for this study.
Poverty line
The MPI calculations of Alkire and Santos (2010), Alkire and Foster (2014) adopted a poverty line of 33% of the weighted whole of deprivations, which infers that families confronting hardship of 33% of the weighted aggregate of measurements are viewed as poor people. Since this study included six dimensions, the equivalent figure is 17%, this study involved a preservationist destitution line of 17% of deprivations as shown in Table 1. This implies family units confronting deprivation of 30% or to a greater extent a weighted total of measurements is viewed as poor. Also, this study used separate cut-offs for the measurement of severe poverty and vulnerability. Family units denied in 40% or a greater amount of the weighted totals of measurements are considered extremely poor, while households deprived in 31-39% of the weighted sum of dimensions were considered vulnerable.
Pakistan procedure for data collection and analysis
From each district, 20 households (a combined total of 80) were selected through a staged sampling procedure using Google maps as a sampling frame. First, areas in each district were selected where there had been the highest numbers of development interventions during the past decade, whether from the government or other development organizations. These had varied objectives, from participatory development to poverty reduction. Within these purposefully selected areas. Google maps were used to locate dwellings, and so by dropping pins on random location and selecting the dwelling closed to the pins positions. The unit of analysis was the household, and the household head was interviewed through face-to-face interviews
Table 1: Dimensions, indicators, weights, and deprivation cut-off of multiple-dimensional poverty.
| Dimensions (Weight) | Indicators | Weight | Depravation cutoff |
| Environment (0.167) | Erosion on farm plot during last 5 years | 0.278 | Deprived if reported erosion |
| Land degraded during the last 5 years | 0.278 | Deprived if land degraded | |
| Deforestation faced in the area | 0.278 | Deprived if deforestation reported | |
| Farm inputs applied during this season | 0.278 | Deprived if inputs not applied | |
| Irrigation water available | 0.278 | Deprived if irrigation water not available | |
| Adoptive and mitigative measure for climate change taken | 0.278 | Deprived if not taken any measure for climate change | |
| Participation/empowerment (0.167) | Government or NGO Aid programs, projects or activities in the area | 0.278 | Deprived if not reporting major development programmes |
| Changes affect socio-economic status of the HH | 0.278 | Deprived if not reporting changes affecting HH | |
| Knowledge about the rural poverty or environment developmental programme | 0.278 | Deprived if not aware about the poverty reduction or environmental degradation prevention program | |
| Whether ever participated in development activities in the last 5 years | 0.278 | Deprived if had not participated in development activities | |
| Current participation | 0.278 | Deprived if not currently participating | |
| Participation in NRM activities | 0.278 | Deprived if had not participated in NRM activities | |
| Wealth/Assets (0.167) | Land possession | 0.033 | Deprived if having no land |
| Profession | 0.033 | Deprived if unemployed or a domestic worker | |
| Cultivated land | 0.033 | Deprived if having no cultivable land | |
| HH physical assets | 0.033 | Deprived if having no car, sewing machine, fridge, radio | |
| Livestock | 0.033 | Deprived if having no livestock of any kind | |
| Health (0.167) | Long-term ill person in household | 0.033 | Household having one or more ill members for more than three weeks is deprived |
| Disabled person in household | 0.033 | Deprived if having one or more members with adisability, irrespective of its type | |
| Access to health care services | 0.033 | Deprived of this indicator if its take more than 45 minutes to reach the nearest public/private hospital for treatment | |
| Access to maternal health services | 0.033 |
Deprived if the mother was not medically examined two times in the pre and postnatal stage of pregnancy. |
|
| Child deaths | 0.033 | Deprived if one or more children died in the last five years | |
| Education (0.167) | Literacy status | 0.056 | Deprived on this indicator if the heads are illiterate |
| Educational achievement | 0.056 | Deprived on this indicator if none of its members attained primary, secondary or further education | |
| Status of children’s school enrolment | 0.056 | The household is declared deprived if any child of age 5-14 is not enrolled in any school | |
| Standard of living (0.167) | Potable water availability | 0.024 | Deprived if having no access to potable water |
| Availability of toilet | 0.024 | Deprived if there is no toilet in their home | |
| Fuel used for cooking | 0.024 | Households using solid fuel i.e. wood, dung, charcoal and crop residue are deprived | |
| House ownership | 0.024 | Deprived if not having own house | |
| Kitchen availability | 0.024 | Deprived if kitchen is not available | |
| Lighting facilities | 0.024 | Deprived if electricity and gas are not light sources | |
| Types of floor | 0.024 | Deprived if the floor is made of mud and stones |
Source: Field data.
method. A questionnaire with both closed and open-ended questions, covering the six dimensions of multi-dimensional poverty chosen for this study and indicators for each, and some personal variables, was designed and pilot tested. The data were analyzed by using descriptive statistics, parametric and non-parametric tests, and the Alkire-Foster (2011) method for multidimensional poverty measurement assessment (see above).
Results and Discussion
Dimensions and indicators of multidimensional poverty
The descriptive statistics on multi-dimensional poverty on different dimensions and indicators presented in Table 2 show the access of and vice versa of different dimensions and indicators of the households. These dimensions are environment, participation, wealth, health, education and standards of living. The first dimension was the environment one of the pillars of sustainable development and a key to the SDGs. This was measured through indicators of erosion on farms, land degradation, threats of deforestation, and application of farm inputs, availability of irrigation water and adaptive and mitigative measures for climate change. The findings in Table 2 show that the households were deprived according to these indicators and hence this contributes to multidimensional poverty. The perceptions of household of the different indicators of environmental dimensions shows that, it is negatively associated with farm erosion, land degradation, deforestation and adaptive mitigate measure to climate change.
The second dimension of poverty examined was the participation/empowerment of the local population in the development of the area. The indicators were that the HH have the knowledge of any major development program in terms of government or NGO aid in the area and its affect on the HH socio-economic status, awareness about the different development organizations, participation of the HH in a development activity, and also in the management of natural resources. The data about the indication of second dimensions (see Table 2) shows that the HH are mostly deficient in indication of this dimension. The highest probability distribution values (C.V) pointed out that in this dimension the HH having comparatively less access to different participatory development activities in the areas.
The indicators of wealth and assets, the third dimension were land possession, profession, presence of cultivated land, possession of different physical assets, and the possession of livestock among the capital (due to the suitability of the area for the grazing and rearing of livestock). In the area the majority of the population have less than 1 hectare of land. Subsistence farming is the main primary profession, and low holding of physical and natural assets contributes to the poverty in the area.
The fourth dimension of the health status, higher ill health from the normal one for the total population in Pakistan reported in the literature, as well as higher disability indicators (Hyder and Marrow, 2000). The PDMA (2016) report shows that in the Khyber Pakhtunkhwa there were 112000 disabled people, amongst whom 66000 were physically disabled. The ratio was higher in the area selected for this study due to the high magnitude earthquake of 2005, followed by the flood of 2010 and other natural disasters in the area. Access to the different health services in the area was also insufficient due to its dispersed settlements and the reduced availability of physical and human assets for the provision of these services.
The indicators for the fifth dimension, education, were literacy status, educational achievement and children’s enrollment in schools. According to Haq (2015) the literacy rate in Pakistan was 85% while in Khyber Pakhtunkhwa it was 35%. According to the estimate of the UNSD (2016), among the total population of Pakistan 60.4% are aged between 15-64 years, so if this proportion of population in Khyber Pakhtunkhwa has missed out on education due to teacher shortages, absenteeism, poor school environments, shortage of nearby schools, poor teaching quality, family poverty, insecurity, natural disasters and other factors, this leads to multidimensional poverty. Moreover, 35.4% of the total Pakistan population is under 15 years of age, and anyone not enrolling in school between the ages of 5-14 years might be adding to the future poverty in the area.
The sixth dimension of the MPI, the standards of living, was measured using 7 indicators of housing poverty. The results show that half of the population lacked their own home due to tenancy/subsistence farming, and had poor access to potable drinking water, lacked flush toilets, used wood as a cooking fuel, had inadequate cooking facilities, lacked suitable lighting facilities and had a mud or soil floor. Thus, the above situation constitutes a situation of poverty, and if this continues the SDG’s objectives will not be achieved.
Overall the reasons for the multidimensional poverty are manifold and particularly the dimension of environment and wealth contributes to it and hence creates a challenge for the different sustainable development goals in the area.
Measurement results of multidimensional poverty
The results of the multidimensional poverty index suggest that there is severe poverty in the study area,
Table 2: Descriptive statistics on dimensions and indicators of multidimensional poverty.
| Dimensions (Weight) | Indicators | HH having access/ possession (%) | HH having no access/ possession (%) | Mean of person | St. Dev. | Variance | Co-efficient of variation |
| Environment | Erosion on farm plot during last 5 years | (43.75) | (56.25) | 0.44 | 0.49 | 0.25 | 114.1 |
| Land degraded during the last 5 years | (11.25) | (88.75) | 0.89 | 0.32 | 0.10 | 35.83 | |
| Deforestation faced in the area | (42.50) | (57.50) | 0.43 | 0.49 | 0.25 | 117.7 | |
| Farm inputs applied during for each seasons crop | (40.00) | (60.00) | 0.40 | 0.49 | 0.24 | 123.3 | |
| Irrigation water available | (22.50) | (77.50) | 0.34 | 0.84 | 0.70 | 249.2 | |
| Adoptive and mitigative measure for climate change taken | (16.25) | (83.75) | 0.16 | 0.37 | 0.14 | 228.5 | |
| Participation in/ Empowerment | Major development in felt in the area | (66.25) | (33.75) | 0.63 | 0.48 | 0.23 | 71.82 |
| Major changes affect on socio-economic status of the HH | (67.50) | (32.50) | 0.68 | 0.47 | 0.22 | 69.83 | |
| Awareness about the development organizations working in the area | (50.00) | (50.00) | 0.50 | 0.50 | 0.53 | 100.6 | |
| Whether ever participated in development activities in the last 5 years | (10.00) | (90.00) | 0.10 | 0.30 | 0.09 | 301.9 | |
| Current participation | (5.00) | (95.00) | 0.05 | 0.22 | 0.05 | 438.7 | |
| Participation in NRM activities | (22.50) | (77.50) | 0.23 | 0.42 | 0.18 | 186.8 | |
| Wealth | Land possession | (56.25) | (43.75) | 0.56 | 0.49 | 0.25 | 88.75 |
| Profession | (37.50) | (62.50) | 2.70 | 2.38 | 5.68 | 88.28 | |
| Cultivated land | (45.00) | (55.00) | 0.13 | 0.33 | 0.11 | 266.2 | |
| HH physical assets | (58.75) | (41.25) | 0.45 | 0.50 | 0.25 | 91.02 | |
| HH natural assets(livestock) | (61.25) | (38.75) | 0.61 | 0.49 | 0.24 | 80.04 | |
| Health | Long-term ill person in household | (85.00) | (15.00) | 0.15 | 0.36 | 0.13 | 239.6 |
| Disabled person in household | (77.50) | (22.50) | 0.23 | 0.42 | 0.18 | 186.8 | |
| Access to health care services | (36.30) | (63.80) | 0.38 | 0.49 | 0.24 | 126.5 | |
| Access to maternal health services | (38.75) | (61.25) | 0.36 | 0.84 | 0.23 | 133.5 | |
| Children death | (67.50) | (32.50) | 0.33 | 0.47 | 0.22 | 0.22 | |
| Education | Literacy status | (53.75) | (46.25) | 2.71 | 1.30 | 1.70 | 48.08 |
| Educational achievement | (33.75) | (66.25) | 0.34 | 0.48 | 0.23 | 140.9 | |
| Status of children enrolment | (62.50) | (37.50) | 0.63 | 0.49 | 0.23 | 77.95 | |
| Standard of living | Potable water availability | (43.75) | (56.25) | 2.55 | 1.78 | 3.16 | 69.73 |
| Availability of flash toilet | (16.25) | (83.75) | 3.04 | 2.34 | 2.34 | 50.36 | |
| Fuel used for cooking | (18.75) | (81.25) | 2.86 | 2.80 | 2.80 | 58.49 | |
| House ownership | (58.75) | (42.25) | 2.39 | 3.30 | 3.30 | 76.13 | |
| Cooking place | (37.50) | (62.50) | 2.96 | 1.60 | 1.60 | 42.78 | |
| Lighting facilities | (30.00) | (70.00) | 2.25 | 1.55 | 1.55 | 55.46 | |
| Types of floor | (43.75) | (56.25) | 1.92 | 0.73 | 0.73 | 44.34 |
Source: Field data.
across all six dimensions. The households were severely poor in terms of participation/empowerment, environment, and wealth, in addition to health, education, and living standards. The head count ratio (showing incidence of multidimensional poverty) suggests that all of the population is living below the poverty line, and results in this regard were almost the same in all the districts. The measure of intensity of the poverty implies that 55% of the population is severely poor, and thus according to the MPI value (as presented in Table 3), 54% of the population was severely poor. These findings are in line with the findings of Jamal (2009), who used three dimensions (human poverty, poor housing, and economic and HH assets poverty) with 16 indicators of poverty while studying secondary data of the 2004-2005 and 2008-2009 Pakistan Social and Living Standards Measurement (PSLM) surveys. He found that in the province of Khyber Pakhtunkhwa overall, non-income multidimensional poverty was 56.10% while that of rural residents was 60.00%. According to the finding of Jamal (2009) regarding the proportion of residents that are multi-dimensionally poor in the selected districts: Shangla (76.50%), Battagram (48.81%), Kohistan (95.53%), and Torghar (65%) confirmed our finding in Table 3 for the study area. Thus, it was confirmed that there is severe poverty in the region, and the slight difference in the value of MPI and the percentages of the population in poverty may be due to the increased number of dimensions and indicators in this study coupled with the use of primary, more recent, data for this analysis.
Causes of multidimensional poverty
The survey asked the respondents opinions on four possible regional and resource related causes of poverty: the isolation and remoteness of the area, lack of infrastructure, poor access to markets and poor access to social and communal services (Table 4). Among the regional causes poor access to social and communal services was the most important reason followed by lack of infrastructure and poor access to markets. This was mainly because in the whole area there are 100 % scattered population with little or no access to services. The chi- square values are significant with respect to three of the four regional characteristics, isolation (36.70), infrastructure (21.93), and poor access to social and communal services (75.03). The resource causes include lack of cultivated land, land degradation, weather and environmental conditions. The Chi-square values are significant with respect to two resource of multi-dimensional poverty causes; i.e. lack of cultivated land and weather condition. Land degradation was the most important reason of resource causes of multi-dimentional poverty while the environmental and weather conditions also contributed to this end. This is because that the quality of land was degraded very severely in the last few years due to a flood, an earthquake, and thunderstorms in the area.
Table 3: Incidence and Intensity of Multidimensional Poverty, by district (n=80).
| District name | Headcount ratio (H) | Intensity (A) | MPI | Poor HH | Vulnerable HH | Severely poor HH |
| Shangla | 1 | 0.54 | 0.54 | 0 | 0 | 20 |
| Battagram | 1 | 0.59 | 0.59 | 0 | 0 | 20 |
| Kohistan | 1 | 0.48 | 0.48 | 0 | 0 | 20 |
| Torgher | 0.95 | 0.58 | 0.57 | 0 | 1 | 19 |
| Average | 0.99 | 0.55 | 0.54 | 0 | 0.25 | 19.75 |
Source: Field data and statistical analysis.
Conclusions and Recommendations
The extreme poverty of the poor regularly depends straightforwardly or in a roundabout way on biological systems and the decent variety of services they give, and additionally questionable privileges of the poor to natural assets, markets and decision-making. This study expands the range of dimensions used in a MPI, and tests the approach in rural Pakistan. All six dimensions of multidimensional poverty were observed, i.e. environment, empowerment/participation, wealth, health, education and standards
Table 4: Multidimensional poverty causes.
| Regional Causes | Very high (%) | High (%) | Moderate (%) | Not answer (%) | S. Dev. | Variance | C.V | Rank | Chi-Square | P-value |
| Isolation/remoteness | (47) | (35.0) | (11) | (6.3) | 0.89 | 0.79 | 50.46 | 4 | 36.70 | <0.001 |
| Less infrastructure | (47) | (44) | (9) | (0.00) | 0.64 | 0.42 | 40.07 | 2 | 21.93 | <0.001 |
| Poor access to market | (25) | (26) | (31) | (18) | 1.05 | 0.10 | 43.60 | 3 | 3.10 | 0.3765 |
| Poor access to social and communal services | (2) | (78) | (0) | (1.3) | 0.48 | 0.23 | 26.47 | 1 | 75.03 | <0.001 |
| Resource Causes | ||||||||||
| Lack of cultivated land | (51) | (41) | (8) | 0 (0.00) | 0.63 | 0.40 | 40.53 | 4 | 25.23 | <0.001 |
| Degraded quality of land | (21) | (49) | (30) | (0.00) | 0.72 | 0.51 | 34.25 | 1 | 9.48 | 0.0088 |
| Weather conditions i.e. drought and monsoon | (46) | (29) | (16) | (8.8) | 0.99 | 0.97 | 52.57 | 2 | 25.80 | <0.001 |
| Environmental conditions (Earth quake and flood) | (40) | (45) | (15) | (0.00) | 0.70 | 0.49 | 40.15 | 3 | 12.40 | 0.0020 |
Source: Field data.
of living. However, the dimensions of environment, empowerment, and wealth were where the most severe poverty was found. The head count ratio (incidence of poverty) suggested that all of the population was living below the poverty line, while the severity index showed that 55% of the population was severely poor. The causes of this poverty include the isolation and remoteness of the area, low-quality infrastructure, poor access to markets and to social and communal services. Therefore, we believe these three dimensions also need to be included in the measurements of multidimensional poverty due to their contribution as causes of poverty in one way or the other and also due to their important role in the sustainable development process. Thus, it is a great challenge for the officials and policymakers in Pakistan and at international organizations to achieve the targets of the Sustainable Development Goals of the UN to overcome this multi-dimensional poverty.
Acknowledgements
This is to acknowledge the financial support of the Endeavor Fellowship of the Australian Government and the logistic support of School of Agriculture and Food Sciences, University of Queensland Australia.
Novelty Statement
This study contributed to the expanded dimensions of multidimensional poverty in terms of wealth status, participation/empowerment, environment, health, education, and standard of living in the context of farm level households in northern rural Pakistan as implication for sustainable development.
Author’s Contribution
Muhammad Israr: Conceived the idea and wrote the paper.
Helen Ross: Supervised the overall research.
Shakeel Ahmad: Helped in designing and formatting of figures.
Nafees Ahmad: Helped in the data collection.
Urooba Pervaiz: Contributed to the theoretical background.
References
Alkire, S., and A. Sumner. 2013. Oxford poverty and human development initiative. Multidimensional Poverty and the Post-2015 MDGs. King’s College London.
Londres, S. Alkire, J.M. Roche, M.E. Santos and S. Seth. 2011. Multidimensional poverty index 2011: Brief methodological note.
Alkire, S. and J. Foster. 2011a. Counting and multidimensional poverty measurement. J. Publ. Econ., 95(7): 476-487.
Alkire, S. and J. Foster. 2011b. Understandings and misunderstandings of multidimensional poverty measurement. J. Econ. Inequality, 9: 289-314.
Alkire, S. and M.E. Santos. 2014. Measuring acute poverty in the developing world: Robustness and scope of the multidimensional poverty index. World Dev., 59, 251-274.
Alkire, S. and M.E. Santos. 2010. Acute multidimensional poverty: A new index for developing countries (July 1, 2010). U. N. Dev. Programme Hum. Dev. Rep. Off. Background Pap. No. 2010/11.
Alkire, S. and J.E. Foster. 2014. Multidimensional poverty measurement and analysis: Chapter 1–introduction. Oxford Poverty & Human Development Initiative (OPHI) Oxford Department of International Development Queen Elizabeth House (QEH), University of Oxford, Working paper No.82, pp. 1-33.
Azpitarte, F., 2010. Measuring poverty using both income and wealth: An empirical comparison of multidimensional approaches using data for the US and Spain. The Levy Economics Institute Working Paper no.620, pp.1-27.
Aryeetey, G.C., C. Jehu-Appiah, A.M. Kotoh, E. Spaan, D.K. Arhinful, R. Baltussen, S. van der Geest and I.A. Agyepong. 2013. Community concepts of poverty: An application to premium exemptions in Ghana’s National Health Insurance Scheme. Globalization Health. 9(1):12.
Ansoms, A. 2013. Negotiating on poverty: A participatory poverty assessment simulation game. Simul. Gaming. 44(4):586-601.
Bossert, W., S.R. Chakravarty and C. D’Ambrosio. 2013. Multidimensional poverty and material deprivation with discrete data. Rev. Income Wealth. 59(1): 29-43.
Bailey, R. and L. Wren-Lewis. 2009. The right to survive in a changing climate. Oxfam background paper. Available from: http://www.oxfam.org.
Carrillo, F.J., A. Raza, A.R. Kausar and D. Paul. 2007. The social management of embodied knowledge in a knowledge community. J. Knowl. Manage. 11(5):45-54.
Cornwall, A. and K. Brock. 2005. What do buzzwords do for development policy? A critical look at participation, empowerment and poverty reduction. Third world quarterly. 26(7):1043-1060.
Cohen, J.M. and N.T. Uphoff. 1980. Participation’s place in rural development: seeking clarity through specificity. World Dev. 8(3):213-235.
Daimon, T. 2001. The spatial dimension of welfare and poverty: Lessons from a regional targeting programme in indonesia. Asian Econ. J. 15(4): 345-367.
Dhakal, B., H.R. Bigsby and R. Cullen. 2007. The link between community forestry policies and poverty and unemployment in rural Nepal. Mt. Res. Dev. 27(1): 32-39.
Fabricius, C., E. Koch, S. Turner and H. Magome. 2013. Rights resources and rural development: Community-based natural resource management in Southern Africa. Routledge.
Foster, J.E., M. Ravallion and N. Kakwani. 1990. Can high-inequality developing countries escape absolute poverty?. Econ. Lett. 56(1): 51-57.
Gibson, J. 2018. Benefits and costs of the poverty targets for the post-2015 development agenda. Prioritizing Development: A Cost Benefit Analysis of the United Nations’ Sustainable Development Goals, pp. 446.
Gabol, W.A., A. Ahmed, A. Ghaffar, H. Bux and M. Amanullah. 2012. Poverty-environment linkages in pakistan and deforestation as an indicator: A case study of District Ghotki, Sindh. Int. J. Manage., Econ. Soc. Sci. 1 (1): 13-18.
Garroway, C. and J.R. De Laiglesia. 2012. On the relevance of relative poverty for developing countries. OECD Development Centre Working Paper No. 314, pp.1-57.
Gerlitz, J.Y., M. Apablaza, B. Hoermann, K. Hunzai and L. Bennett. 2015. A multidimensional poverty measure for the Hindu Kush–Himalayas, applied to selected districts in Nepal. Mt. Res. Dev. 35(3): 278-288.
Haq, R. 2015. Education woes: Pakistan misses UN target with 58% literacy rate. Expr. Tribune. http://tribune.com.pk/story/897995/education-woespakistan-misses-un-target-with-58-literacy-rate/
Hills, L., M. Willoughby andP. Garrett-Peters. 2010. Predictors of behavioral regulation in kindergarten: Household chaos, parenting, and early executive functions. Developmental psychology, 52(3): 430.
Homer, C.S., I.K. Friberg, M.A.B., Dias, P. Hoope-Bender, J. Sandall, M. Speciale and L.A. Bartlett 2014. The projected effect of scaling up midwifery. The Lancet, 384(9948): 1146-1157.
Hulme, D. and M. Murphree. 2001. African wildlife and livelihoods: the promise and performance of community conservation. James Currey Ltd.
Hyder, A.A. and R.H. Morrow. 2000. Applying burden of disease methods in developing countries: a case study from Pakistan. Am. J. Publ. Health. 90(8): 1235.
Imperiale, A.J. and F. Vanclay. 2016. Using social impact assessment to strengthen community resilience in sustainable rural development in mountain areas. Mt. Res. Dev., 36(4): 431-442.
ILO. (International Labour Organisation). 2012. Structure and functions of rural workers’ organisation: Participation of the rural poor in development, geneva: ILO; MA Rahman people’s self development: Perspectives on Participatory Action Research, London: Zed Books, 1995; and J Gaventa, ‘Introduction: exploring citizenship, participation and accountability’, IDS Bulletin, 53 (9): 25-40.
Irfan, S. 2011. Benazir Income Support Programme (BISP) and its impact on women’s empowerment. SAARC J. Hum. Resour. Dev. 12: 71-82.
Israr, M., H. Khan and N. Ahmad. 2013. Employment composition of the rural households in northern Pakistan. J. Asian Dev. Stud. 2(4): 44-50.
Jamal, H. 2009. Estimation of multidimensional poverty in Pakistan. Soc. Policy Dev. Centre, Res. Rep. No. 79, Karachi. 48(3): 221-228.
Kohl-Arenas, E., 2011. Governing poverty amidst plenty: Participatory development and private philanthropy. Geogr. Compass. 5(11): 811-824.
Khan, A.R. and Z. Bibi. 2011. Women’s socio-economic empowerment through participatory approach: A critical assessment. Pak. Econ. Soc. Rev. 49: 133-148.
Karekezi, S., S. McDade, B. Boardman, J. Kimani and N. Lustig. 2012. Global Energy Assessment (GEA): Energy, Poverty Dev. 35(4): 227-240.
Klasen, S. 2012. Policy Note: MDGs post-2015: What to do?, Courant Research Centre: Poverty, Equity and Growth - Discussion Papers, No. 123, Courant Research Centre Poverty, Equity and Growth, Göttingen, pp.1-15.
Laderchi, C.R. and S. Savastano. 2013. Poverty and exclusion in the Western Balkans: New directions in measurement and policy (Vol. 8). Springer Science & Business Media.
Levine, S., J. Muwonge and Y.M. Batana. 2014. A robust multi-dimensional poverty profile for Uganda. J. Hum. Dev. Capabilities, 15(4): 369-390.
Li, G., C. Fang, D. Qiu and L. Wang. 2014. Impact of farmer households’ livelihood assets on their options of economic compensation patterns for cultivated land protection. J. Geogr. Sci. 24: 331-348.
Mayer, R.E. 2002. Invited reaction: Cultivating problem-solving skills through problem-based approaches to professional development. Human Resource Development Quarterly, 13(3): 263-269.
Mosites, E., S.M. Thumbi, E. Otiang, T.F. McElwain, M. Njenga, P.M. Rabinowitz, A. Rowhani-Rahbar, M.L. Neuhouser, S. May and G.H. Palmer. 2016. Relations between household livestock ownership, livestock disease, and young child growth. J. Nutr. 146(5): 1118-1124.
OECD [Organization for Economic Cooperation and Development]. 2013. Ending poverty. Development co-operation report 2013, Paris. Glob. Forum Dev. Summ. Rec., Paris. Aid Least Dev. Countries. 25(1): 78-91.
Paris. HLP [High-Level Panel]. 2013. A new global partnership: Eradicate poverty and transform economies through sustainable development, report of the high-level panel of eminent persons on the post-2015 Dev. Agenda, available at: www.post2015hlp.org/the-report.
PDMA [Provisional Disaster Management Authority]. 2016. Provisional disability list, Daily Aaj, May 07, 2016. 2(1): 1-4.
Rahman, M.A. 2013. Household characteristics and poverty: a logistic regression analysis. J. Dev. Areas 47(1): 303-317.
Sachs, J.D., G. Schmidt-Traub and D. Durand-Delacre. 2016. Preliminary sustainable development goal (SDG) index and dashboard. Sustainable Dev. Solut. Netw., 15: 1-20.
Salole, G. 1991. Participatory development: The taxation of the beneficiary? J. Soc. Dev. Afr. 6(2): 5-18.
Sen, A. 1979. Personal utilities and public judgements: or what’s wrong with welfare economics. Econ. J. 44: 537-558.
Sen, A. 1985. Well-being, agency and freedom: The Dewey lectures 1984. J. Philos. 82(4): 169-221.
Tunstall, R., M. Bevan, J. Bradshaw, K. Croucher, S. Duffy, C. Hunter, A. Jones, J. Rugg, A. Wallace and S. Wilcox. 2013. The links between housing and poverty: an evidence review. JRF Report, York: Joseph Rowntree foundation. pp.22-44.
UN [United Nations]. 2013. My world: Survey the United Nations. Global survey for a better world, online survey results at: www.myworld2015.org. ODI (Overseas Development Institute) (2010), Millennium Development Goals (MDG) Report Card: Measuring progress across countries, ODI, London.
UNDP [United Nations Development Program]. 2003. Millennium development goals: A compact among nations to end human poverty. New York: Oxf. Univ. Press. pp. 375.
UNDP [United Nation Development Program]. 2015. Human development report 2011. Hum. Dev. 21: 45–68.
UNDP. 2017. Human development reports, Multidimensional poverty index, http://hdr.undp.org/en/content/multidimensional-poverty-index-m viewed 17 April 2017 [website]
UNSD [United Nations Statistics Division]. 2016. Pakistan population country meters.
WB [World Bank]. 2015. Development goals in an era of demographic change: Global monitoring report 2015/2016; International bank for reconstruction and development / The world bank 1818 H Street NW, Washington, DC 20433, A joint publication of the world bank group and the international monetary fund.
WB [World Bank]. 2011. World development report 2010: development in changing climate: Concept note; Available from: http://www.worldbank.org
White, R. 2017. Multidimensional poverty and deprivation: An introduction. In measuring multidimensional poverty and deprivation. Palgrave Macmillan, Cham. pp. 1-6.
WHO [World Health Organization]. 2009. Global health risks: mortality and burden of disease attributable to selected major risks.
WHO (World Health Organization). 2015. Health in 2015: from MDGs, millennium development goals to SDGs, sustainable development goals. World Health Organization.WHO Library Cataloguing-in-Publication Data, pp.10-28
To share on other social networks, click on any share button. What are these?


