
Measurement of Allocative Efficiency of Sugarcane Farms in District Charsadda-Khyber Pakhtunkhwa


Research Article
Measurement of Allocative Efficiency of Sugarcane Farms in District Charsadda-Khyber Pakhtunkhwa
Amjad Ali1, Abbas Ullah Jan1, Lal Almas2, Noor Piao Khan1 and Khurran Nawaz Saddozai1
1Department of Agricultural and Applied Economics, The University of Agriculture Peshawar, Khyber Pakhtunkhwa, Pakistan; 2Agricultural Business and Economics, West Texas AandM University, Canyon, TX USA.
Abstract | According to agricultural trade experts Pakistan need to reduce cost of production in order to compete in the international market. At national level food group exports decline from 3,439.4 million US$ during 2015 to 3040.7 in 2016. Increase in productivity and efficiency has been the major concern for agricultural researchers and policy makers in Pakistan. In current study allocative efficiency of sugarcane growers in district Charsadda was worked out with frontier model. Randomly 118 sugarcane growers were interviewed during crop season 2014-2015. For survey data a pre-tested structured questioner set according to objectives of the study was used. Coefficients of parameters were calculated by maximum likelihood estimation techniques. Per acre total yield, land rent and per acre inputs cost (labor hired, seed, tractor hours, irrigation, Urea, DAP, FYM and pesticides) were considered determinants for cost function. Respondent age, farming experience, education, family size, off-farm income, farm to home distance, tenancy and extension contacts are determinants in allocative inefficiency model. Results of the study revealed that except farmyard manure and pesticides all other explanatory variables are significant influencing factors in total cost of sugarcane production in district Charsadda. In socio-economic characteristics family size and extension contacts show negative correlation with allocative inefficiency. Mean allocative efficiency was found 63% with range from minimum 36% to maximum 90%. The presence of allocative inefficiency indicates that the average growers can reduce his cost of production (Rs.77,083/- per acre) up to 30% without any decrease in output level. Attractive output prices, timely payment and provision of quality extension services would help farmers to redirect their scarce resource allocation and reduce allocative inefficiency.
Received | December 06, 2017; Accepted | November 06, 2018; Published | November 29, 2018
*Correspondence | Amjad Ali, Department of Agricultural and Applied Economics, The University of Agriculture Peshawar, Khyber Pakhtunkhwa, Pakistan; Email: [email protected]
Citation | Ali, A., A.U. Jan, L. Almas, N.P. Khan and K.N. Saddozai. 2018. Measurement of Allocative Efficiency of Sugarcane Farms in District Charsadda-Khyber Pakhtunkhwa. Sarhad Journal of Agriculture, 34(4): 955-962.
DOI | http://dx.doi.org/10.17582/journal.sja/2018/34.4.955.962
Keywords | Allocative efficiency, Stochastic frontier analysis, District Charsadda, Khyber Pakhtunkhwa
Introduction
Agriculture sector in Pakistan provides means of livelihood to more than 60 percent of the total population and serve as a source of foreign exchange earnings. However, because of rapid increase in input prices, the profitability of the agriculture sector is declining in Pakistan (Niala and Shahid, 2009).
Bashir and Khan (2005) suggest three possible ways to decrease cost of production namely by improving management practices, decreasing cost of inputs and by developing of high yielding varieties. However, only the first alternative seems to be achievable. Improvement in management practices refers to allocative efficiency, in which marginal production of each inputs equal to the ratio of input and output prices.
Sugarcane is among major crops of Pakistan and is under cultivation since long. It was grown in almost 1.13 million hectares during the year 2015-16. It is a source of income and employment for farming community throughout the year. In Pakistan it is mainly grown in Sindh, Punjab and Khyber Pakhtunkhwa. Pakistan has the resources to obtain per unit high yield of sugarcane crop, yet it has neither export sugar at a competitive price nor could get rid of import to meet local requirement. Per capita sugar consumption in South Asia including Pakistan is 25.83 kg year-1) (Azam and Mukarram, 2010). During the year 2014-15 total white sugar production was 4.65 million tonnes while consumption was 4.1 million tonnes (PSMA, 2014-15).
A vast body of literature pertaining to technical efficiency and agronomic aspects of sugarcane crops exists but no work has been done to estimate allocative efficiency of sugarcane crop in Khyber Pakhtunkhwa specifically in district Charsadda.
Due to lack of integrated planning in agriculture, inputs are recommended irrespective of soil type, inputs availability and market information. Trails are carried out in research stations and recommendations are made for wide area based on evidence derived from these trails. Rapid increase and revision in prices of energy, fertilizers and other agriculture inputs illustrate the need to explore whether sugarcane growers are allocating their resources efficiently or not?
Current study was directed in district Charsadda which is the largest sugarcane producing district of the province. Major part of its land is under agriculture activities. Its resources comprise fertile soil well suited for farming, climate and water. Main sources of irrigations are Rivers Jindi, Kabul and Swat flowing in district, which cover 86% of district Charsadda. Major crops grown are sugarcane, sugar beet, maize, tobacco and wheat along with some orchards and vegetables. Based on production district Charsadda contribute 32.21 to sugarcane production at provincial level (GoKP, 2015).
The objectives of the study were to estimate allocative efficiency of sugarcane grower in study area and its influencing factors. The findings will be used as base for recommendations.
Theoretical background
Farrell (1957) is considered first researcher who use and measure efficiency, he did this by comparing a firm’s actual and potential output from a given set of inputs. He argued two components of efficiency, namely technical and allocative efficiency. Technical efficiency was defined as the ability to produce maximum output from a given amount of inputs, while allocative efficiency refers to the ability to produce a given level of output at minimum cost.
The interpretation of allocative efficiency depends upon assumption researchers made about firm’s behavior. Farrell (1957) assumed cost minimization for a given level of output and defined allocative inefficiency as inability of growers to equate the ratio of marginal products of inputs with the ratio of their prices.
In current study, constraint allocative efficiency, which means that growers have fixed cash outlay which he allocates among various inputs during the entire sugarcane growing season. Also, it is assumed that grower’s objective is to maximize his output at a given cash outlay.
Materials and Methods
This study was conducted in district Charsadda. Randomly two villages Serdehri and Sheikabad were selected from union council Muhammad Nehri. Primary data was collected through a pre- structured questioner that was designed according to objectives of the study. Randomly 118 willing respondents were interviewed in study area. Out of total 118 sample size 64 were selected from village Sirdehri and 54 from Sheikhabad by using Cochran (1977) proportional sampling allocation technique given in Equation 1 as given in Table 1.

Symbols represent:
ni: number of sugarcane growers randomly interviewed in selected villages; Ni: number of total sugarcane growers; n: sample size for the study; N: total number of sugarcane growers in the study area.
Econometric model
Specification of functional form for an econometric model pose problem, because economic theory does not provide a precise guide in this regard. According to Kopp and Smith (1980) functional form has limited effect on empirical measurement of efficiency. Ogundari et al. (2010) reported that it is necessary to choose functional form well in advance because it influence the estimated results. Similarly, Hall (1978) and Godfrey and Wickens (1981) also reported that functional form has important implications for estimated results, forecast and policy analysis. According to Bashir and khan (2005) specification of model should be guided by visualization of the true research process which means that through a range of visible ideas and techniques exploring the research nature and findings. But for specification of model visualization need to be used with care.
The stochastic frontier production model of Aigner et al. (1977) and Meeusen and Van den Broeck (1977) was employed. According to Battese (1992) it has the property of self-dual which allow to estimate technical as well as allocative efficiency. According to Burki and Shah (1998) the concept of frontier is applied to production, profit and cost functions. Therefore, stochastic cost frontier analysis is used to estimate allocative efficiency of sugarcane growers in study area. The cost function shows the relationships between the prices of inputs and the amount of output that can be produced at these prices. Using vector of input prices, the cost frontier in its general form can be written as:

Where; Ci : represents the observed cost for each grower, pᵢ: price of nth input while Yi: represent the output.
In stochastic frontier analysis mostly Cobb-Douglas functional form is used. Thus, the cost frontier with the Cobb-Douglas form was specified as follow in Equation 2. Studies conducted by Bravo-Ureta and Pinheiro (1997) and Sajjad (2012) have also employed same technique.
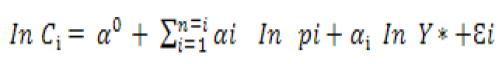
Where; Ci: Represent cost per acre (Rs/acre); Y*: Yield in kg acre-1; ρ1: Land rent per acre of ith farmer (Rs acre-1); ρ2: Labour cost (Rs acre-1); ρ3: Seed cost (Rs acre-1); ρ4: Tractor hours (Rs acre-1); ρ5: Irrigation charges (Rs acre-1); ρ6: Cost of urea (Rs acre-1); ρ7: Cost of DAP (Rs acre-1); ρ8: Cost of Fym (Rs acre-1);
ρ9: Cost of pesticides (Rs acre-1); Ɛi : Error term (vi- μi); α0: Intercept of allocative inefficiency; α1: Parameters to be estimated.
Model for allocative inefficiency estimation
For allocative inefficiency normal distribution of V- N (0, σ²ᵥ) and half normal distribution of Ui- N (0, σ²ᵤ) was assumed. Determinants for allocative inefficiency were expressed as follows:
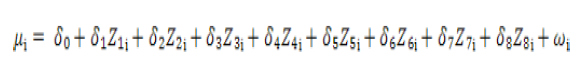
Where; μᵢ: Represent cost inefficiency and range from 0 to 1; Z1i: Farmer Age (Years); Z2i: Farming experience of the ith farmer in years; Z3i: Number of schooling years; Z4i: Represent family size of farmer; Z5i: Dummy for off farm income activities (1, if growers have off farm activities otherwise 0); Z6i: Distance between farm and house; Z7i: Off farm income; Z8i: Dummy for tenural status (1, if growers is owner, 0 for tenant and 2 for owner- cum tenant; ωᵢ: Random error term normally distributed with 0 mean and constant σ²; δ₀: constant for allocative inefficiency model and δi are parameters to be estimated.
Individual grower allocative efficiency is represented by the ratio of minimum cost to observed cost that is:
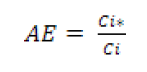
Where; AE: Allocative efficiency; Ci*: Minimum possible cost of ith farm; Ci: Observed cost ith farm.
Allocative efficiency ranges between 0 and 1. Individual farm level allocative inefficiency was arrived by using the following formula.
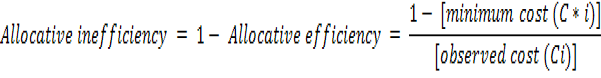
Table 1: Respondents selection in two villages of District Charsada.
| Union Council | Village | Total sugarcane growers | Respondents selected for interview | Sample size |
| Muhammad Nahri | Sirdehri | 269 | 64 | 118 |
| Sheikhabad | 223 | 54 | ||
| Total | 492 | 118 |
Source: Government of Khyber Pakhtunkhwa, 2014-2015.
Results and Discussion
The results given in Table 2 revealed that the average sugarcane yield was 24566.78 kg acre-1 (60 tonnes/hec) in district Charsadda but varies from 18200 to 30480 kg/acre. Which show that average yield in study area was high compare to national level (50 tonnes/hec). Average seed, urea, DAP and farmyard manure applied were 2471.86, 115.70, 74.96 and 1543.43 kg respectively. Mean farm size was 2.36 acres having standard deviation of 0.83. On average tractor hours applied were 20.74 with standard deviation of 3.64 up to maximum 30.00 hours per acre. During entire season maximum numbers of irrigation applied were 17.09. Average human labor (both family and hired) was 44.02-man days, with minimum and maximum rate of 32 and 55 man days respectively. It indicates that sugarcane production is water as well as labor intensive crop. Average pesticides application per acre in study area was 2689.83 milliliter up to maximum 9000.00 milliliter. Variability by standard deviation implies that growers operated at different level of inputs which affect their yield level.
Table 2: Descriptive statistics of key explanatory variables used in the analysis.
| Variable | Unit | Mean | Std. Dev | Min | Max |
| Yield | Kg. | 24566.78 | 3009.76 | 18200.00 | 30480.00 |
| LASCC | Acre | 2.36 | 0.83 | 0.50 | 4.20 |
| Labor days | No. | 44.02 | 3.51 | 32.00 | 55.00 |
| Seed | Kg. | 2471.86 | 458.18 | 1440.00 | 3520.00 |
| Tractor | Hour | 20.74 | 3.64 | 14.50 | 30.00 |
| Irrigation | No. | 17.09 | 3.89 | 7.00 | 25.00 |
| Urea | Kg. | 115.70 | 44.79 | 50.00 | 220.00 |
| DAP | Kg. | 74.96 | 14.99 | 45.00 | 112.00 |
| FYM | Kg. | 1543.43 | 474.50 | 500.00 | 2190.00 |
| Pesticides | ML | 2689.83 | 2281.75 | 400.00 | 9000.00 |
Note: LASCC: Land allocated to sugarcane crop in study period; DAP: Di-Ammonium phosphate; FYM: Farmyard manure; ML: milliliter; Source: Field Survey, 2014-15.
Allocative efficiency analysis of sugarcane growers in district charsadda
MLE estimates were arrived by using the computer software (STATA). Maximum Likelihood and Ordinary Least Squares (OLS) estimates along with those of inefficiency model are presented in Table 3. Positive as well as significant (at 5% level) coefficients were noted for all explanatory variables except farmyard manure and pesticides. This implies that these variables have direct relationship with total cost of sugarcane production. The estimated cost elasticities show that one percent increase in total production and prices of explanatory variables given in Table 3 increase total cost by 0.097, 0.0023, 0.294, 0.217, 0.338, 0.083, 0.084, 0.224, 0.029 and 0.017 percent respectively.
Results on causes of allocative efficiency
Major sources of allocative inefficiency discussed in recent literature are the management qualities of respondents, such as education, age, experience etc. in current study estimates for inefficiency parameters has incorporated in Table 3. Negative sign associated with a parameter means that the associated variable has direct relationship with allocative efficiency.
In allocative inefficiency model family size and extension contacts were found negatively and significantly correlated with allocative inefficiency at 5% level. A possible reason of family size positive impact on allocative efficiency might be that larger household size ensure availability of labor for various activities to be carried out timely. At peak seasons large family size could deploy more labor to undertake farming activities such as weeding, plowing and harvesting timely compare to their counterparts and hence they are efficient. The result is in line with Sisay et al. (2015). Dipeolu and Akinbode (2006) found effect of household family size on allocative efficiency non-significant in his study. Similarly, Coelli et al. (2002) reported that larger families are causes of low efficiencies in less labor-intensive seasons.
Several researchers such as Khan (2012), Dipeolu and Akinbode (2006), Bravo-Ureta and Pinheiro (1993) and Bravo-Ureta and Evenson (1994) has reported positive association between extension contacts and allocative efficiency. They found that farmers with more extension contacts are relatively more efficiency compare to their partner growers.
Table 3: Ordinary Least Square (OLS) and Maximum Likelihood (ML) Estimates for Stochastic Frontier Cost Function in District Charsadda.
|
Variables
|
Parameter
|
OLS | MLE | |||
| Coefficient | T-ratio | Coefficient | T-ratio | |||
| Constant |
α0 |
3.790 | 10.41 | 2.209 | 8.69 | |
| Ln Y* (Yield) |
α1 |
0.590 | 4.61 | 0.097 | 10.70 | |
|
Ln ρ1 (Land rent) |
α2 |
0.007 | 2.60 | 0.0023 | 2.85 | |
|
Ln ρ2 (Labor cost) |
α3 |
0.587 | 10.66 | 0.294 | 10.70 | |
|
Ln ρ3 (Seed cost) |
α4 |
0.163 | 8.33 | 0.217 | 8.20 | |
|
Ln ρ4 (Tractor cost) |
α5 |
0.367 | 12.10 | 0.338 | 6.97 | |
|
Ln ρ5 (Irrigation cost) |
α6 |
0.005 | 0.25 | 0.083 | 3.02 | |
|
Ln ρ6 (Urea cost) |
α7 |
0.078 | 5.13 | 0.084 | 9.76 | |
|
Ln ρ7 (DAP cost) |
α8 |
0.174 | 7.58 | 0.224 | 7.97 | |
|
Ln ρ8 (Fym cost) |
α9 |
0.002 | 0.11 | 0.029 | 1.22 | |
|
Ln ρ9 (Pesticides cost) |
α10 |
0.029 | 2.37 | 0.017 | 1.51 | |
| Allocative Inefficiency Model Estimates | ||||||
| Constant |
δ₀ |
0 | 0 | -6.81 | -1.07 | |
| Age (Years) |
δ₁ |
0 | 0 | 0.032 | 0.22 | |
| Experience (Years) |
δ₂ |
0 | 0 | -0.764 | -1.90 | |
| Education (Years) |
δ₃ |
0 | 0 | 0.012 | 0.04 | |
| Family Size (Nos) |
δ₄ |
0 | 0 | -1.36 | -3.67 | |
| Off farm income(Dummy) |
δ₅ |
0 | 0 | -2.15 | -1.11 | |
| Farm to home distance(m) |
δ₆ |
0 | 0 | 0.008 | 1.08 | |
| Tenancy (Dummy) |
δ₇ |
0 | 0 | 0.86 | 0.53 | |
| Extension contacts (Nos) |
δ₈ |
0 | 0 | -1.97 | -2.03 | |
| Sigma V | - | 0 | 0 | 0 | 0.019 | |
| Sigma U | - | 0 | 0 | 0 | 0.037 | |
| Lambda | Λ | 0 | 0 | 0 | 1.947 | |
| Gamma | Γ | 0 | 0 | 0 | 0.79 | |
| Log likelihood function | 230.25 | 232.70 | ||||
Note: Ln represent natural log; M stand for meter; Source: Researcher’s calculation from STATA.
In district Charsadda other socio-economic variables such as age, experience, education, off farm income, farm to home distance and tenancy status of growers were found non-significant. The estimated value of 0.79 for γ suggest that 79 percent differences in sugarcane cost of production among growers is due to allocative inefficiency and the remaining 21% is due to random error.
Frequency distribution of allocative efficiency of sample respondents in district Charsadda
The estimated allocative efficiencies of individual growers of sugarcane have been presented in Table 4. Allocative efficiency ranges from zero to one. First column of Table 4 shows allocative efficiency level, second column presents frequency distribution of growers according to allocative efficiency level given in column 1. In district Charsadda majority (52.54 %) of growers were found in the range beyond 60%, while 47.45 % growers lie in the medium category. The results revealed that there is allocative inefficiency problem among majority of sugarcane farms.
The average predicated allocative efficiency in study area was found 0.63 with range from minimum 0.36 to maximum 0.90. None, of the sample respondent had a 100% allocative efficiency index. The mean level (0.63%) of allocative efficiency for sugarcane growers given in Table 4 is in line with study of Londiwe et al. (2014). He found 61.5% mean allocative efficiency level for sugarcane crop in South Africa. Similarly, Rangalal and B. Sen. (2013) found 0.23% allocative efficiency level for sugarcane crop in India. Hussain (1995) reported 42.5 % allocative efficiency level for wheat crop in Pakistan. Bashir and Khan (2005) reported 72 percent mean allocative efficiency score for wheat crop in Peshawar valley.
The presence of allocative inefficiency indicates that average growers can reduce [(1 – 0.63/0.90)] 30% of their average cost in order to achieve the allocative efficiency level of most efficient fellow grower without decrease in output level. In district Charsadda per acre average cost was noted Rs. 77083/-. 30% reduction mean that average grower can decrease his cost to Rs.53,958/- without any reduction in production.
Table 4: Frequency distribution of allocative efficiency of sample respondents in district Charsada.
| Allocative Efficiency Level | No. of Respondents | %age |
| Low (0.0 – 0.30) | 0 | 0 |
| Medium (0.31-0.60) | 56 | 47.45 |
| Beyond (> 0.60) | 62 | 52.54 |
| Mean | 0.63 | |
| Min | 0.36 | |
| Max | 0.90 | |
Source: Study results.
Conclusions and Recommendations
This paper has presented measures of allocative efficiency for a sample of 118 sugarcane growers in district Charsadda-Khyber Pakhtunkwa, Pakistan. Maximum likelihood estimation technique was used to estimate a Cobb-Douglas cost frontier. For data analysis both OLS and Cobb-Douglas functional forms were tried.
It was found that except farmyard manure and pesticides all other explanatory variables (observed sugarcane production, land rent, labor, seed, tractor hours, irrigation, urea a DAP) are important constituents of total sugarcane production cost in district Charsadda. It was revealed that average allocative efficiency for sample respondents equal to 0.63 ranging from minimum 0.36 to maximum 0.90 respectively. The results suggest that substantial decrease in cost without reduction in productivity can be attained by given the existing technology.
In second step of analysis allocative efficiency was related to various attributes of sugarcane growers in study area. Only two (Household family size and extension contacts) were found significant and of the expected sign. While other non-economic variables (age, experience, education, off-farm income, farm to home distance and tenancy position) were found none-significant with alternative signs. Based on findings of the study it is argued that extension contacts for better access of growers to managerial assistance and market information for both inputs and output prices along with attractive wages as an incentive for labors need to be focused for improvement in allocative efficiency.
Authors’ Contribution
Amjad Ali: Did survey for primary data and drafted the manuscript.
Abbas Ullah Jan: Provided technical assistance at model fitting stage.
Lal Almas: Reviewed the draft.
Noor Piao Khan: Provided inputs in results interpretation.
Khurran Nawaz Saddozai: Helped in interview scheduling, survey and data feeding in Excel.
References
Aigner, D.J., C.A.K. Lovell and P. Schmidt. 1977. Formulation and estimation of stochastic production function models. J. Econ. 6: 21-37. https://doi.org/10.1016/0304-4076(77)90052-5
Burki, A.A and H.N. Shah. 1998. Stochastic frontier and technical efficiency of farms in irrigated areas of Pakistan’s Punjab. Pak. Dev. Rev. 37: 3. 275-291.
Azam, M. and M. Khan. 2010. Significance of the sugarcane crops with special and reference to NWFP. Sarhad J. Agric. 26(2): 289-295.
Bashir, M. and D. Khan., 2005. An analysis of allocative efficiency of wheat growers in Northern Pakistan. Pak. Dev. Rev. 44: 4 Part II (winter 2005) pp. 643-657.
Battese, G.E. 1992. Frontier production function and technical efficiency: A survey of empirical application in Agricultural Economics. Agric. Econ. 7: 185-208. https://doi.org/10.1016/0169-5150(92)90049-5
Bravo-Ureta, B.E. and R.E. Evenson. 1994. Efficiency in agricultural production: The case of peasant farmers in Eastern Paraguay”. Agric. Econ. 10: 27-37. https://doi.org/10.1016/0169-5150(94)90037-X
Bravo-Ureta, B.E and A.E. Pinheiro. 1993. Efficiency analysis of developing country agriculture: A review of the frontier function literature. Agric. Resour. Econ. Rev. 22 (1): 88-101. https://doi.org/10.1017/S1068280500000320
Bravo-Ureta, Boris. E and A. E. Pinheiro. 1997. Technical, economic and allocative efficiency in peasant farming: Evidence from the Dominican Repulic. Dev. Econ. I: 48-67.
Byerlee, D. 1987. Maintaining the momentum in post-green revaluation agriculture: A micro level perspective from Asia. Univ. Michigan (MSU Int. Dev. Paper No. 10).
Cochran, W.G. 1977. Sampling Techniques, 3rd Edition. John Wiley and Sons, New York. pp. 37-45
Coelli, T.J., S. Rehman and C. Tirtle. 2002. Technical, allocative, cost and scale efficiencies in Bangladesh rice Cultivation: A non-parametric approach. J. Agric. Econ. 533607. https://doi.org/10.1111/j.1477-9552.2002.tb00040.x
Dipeolu, A.O. and S.O. Akinbode. 2006. Technical, economic and allocative efficiencies of Pepper production in South West Nigeria: A Stochastic Frontier Appraoch. J. Econ. Rural Dev. 17 (1).
Farrell, M.J. 1957. The measurement of productive efficiency. J. R. Stat. Soc. Ser. A, 120: 253-90. https://doi.org/10.2307/2343100
Godfrey, L.G. and M.R. Wickens. 1981. Testing linear and log-linear regressions for functional forms. Rev. Econ. Stud. 18: 487-96. https://doi.org/10.2307/2297160
Green, W.H. 1990. Econometric Analysis. Macmillan press, New York.
Hall, R.E. 1978. Stochastic implication of the life cycle-permanent income hypothesis: Theory and Evidence. J. Pol. Econ. 78: 1971-87. https://doi.org/10.1086/260724
Hopper, W.D. 1965. Allocative efficiency in a traditional Indian agriculture. J. Farm Econ. 47: 611-24. https://doi.org/10.2307/1236276
Hussain, S.S. 1995. Analysis of Allocative Efficiency in Northern Pakistan: Estimation, Causes, and Policy implication. Pak. Dev. Rev. 34(4): 1167-1180. https://doi.org/10.30541/v34i4IIIpp.1167-1180
Khan, H. 2012. Measurement of technical, allocative and economic efficiency of tomato farms in Northern Pakistan. J. Agric. Sci. Technol. 1080-1090.
Kodde, D.A. and F.C. Palm. 1986. Wald criteria for jointly testing equality and inequality restrictions. Economertican. 54: 1234-1248. https://doi.org/10.2307/1912331
Kopp, R.J and V.K. Smith. 1980. Frontier production function estimation for steam electric generation: A comparative analysis. South. Econ. J. 47: 1049-59. https://doi.org/10.2307/1057240
Lau, L.J. and P.A. Yotopoulos. 1971. A test for relative efficiency and an application to Indian Agriculture. Am. Econ. Rev. 61(1): 97-109.
Londiwe, T., E. Mungatana and M. Labuschagne. 2014. Estimation of technical, economic and allocative efficiencies in sugarcane production in south Africa: A case study of Mpumalanga growers. J. Econ. Sustainable Dev. 5 (16).
Mceusen, W. and J.V. den Broeck. 1977. Efficiency estimation from Cobb-Douglas production function with composed error. Int. Econ. Rev. 18: 435-44. https://doi.org/10.2307/2525757
Naila, A. and Shahid. A. 2009. Agricultural input use efficiency in Pakistan: Key issues and reform areas. Managing natural resources for sustaining future agriculture. Res. Brief. 1(3).
Ogundari, K., T.T. Amos and S.O. Ojo. 2010. Estimating confidence intervals for technical efficiency of rainfed rice farming system in Nigeria. China Agric. Econ. Rev. 2(1): 107-118. https://doi.org/10.1108/17561371011017531
Pakistan Sugar Mills Association 2014-15. Annul Report. Government of Pakistan.
Rangalal, M. and B. Sen. 2013. Technical, allocative and economic efficiency in sugarcane production: A non-parametric approach. Int. J. Adv. Res. 1(6): 366-374
Subhash, R.C. 1985. Measurement and test of efficiency of farms in linear programming models: A study of West Bengal Farms. Oxf. Bull. Econ. Stat. 47 (4):371-86.
Sajjad, M. 2012. Economic efficiency of milk production in Khyber Pakhtunkhwa. Ph.D thesis submitted to the Department of Agricultural and Applied Economics. Univ. Agric. Peshawar, KPK Pak.
Schultz, T.W. 1964. Transforming traditional agriculture. Univ. Chic. Press, Chic.
Sisay, D., J. Haji, D. Goshu and A.K. Edriss. 2015. Technical, allocative, and economic efficiency among smallholder maize farmers in Southwestern Ethiopia: Parametric approach. J. Dev. Agric. Econ. 7(8): 282-291. https://doi.org/10.5897/JDAE2015.0652
Stefanou, E.S. and S. Sexena. 1988. Education, experience and allocative efficiency: A Dual Approach. Am. J. Agric. Econ. 70 (2): 338-45. https://doi.org/10.2307/1242074
To share on other social networks, click on any share button. What are these?


