
Macroscopic Effect of Small Intestine Submucosa Hydrogel-Silver Nanoparticles Composite on Healing of Infected Wounds


Macroscopic Effect of Small Intestine Submucosa Hydrogel-Silver Nanoparticles Composite on Healing of Infected Wounds
Saddam Hummadi1, Nadia Al-Falahi2*


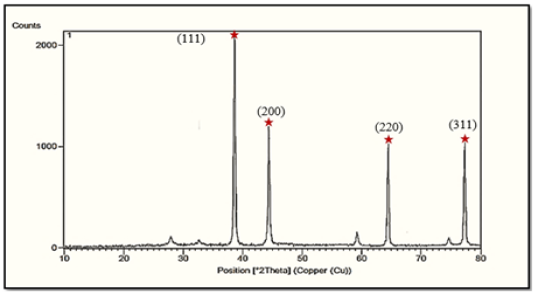
XRD pattern of AgNPs. Shows the diffraction peaks of 38.5, 44.4, 64.55 and 77.32 corresponded to the (111), (200), (220), and (311) planes respectively.
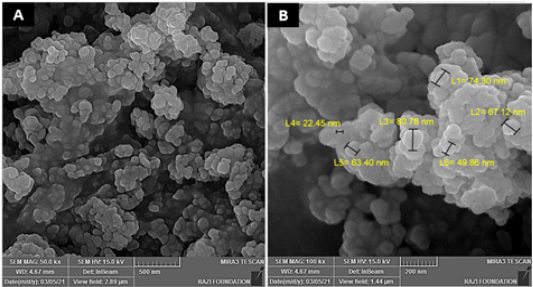
Scanning electron microscope (SEM) images of silver nanoparticles synthesized using Aloe Vera gel extracts at different magnifications. (A) at 50 kx magnifications, shows uniformly spherical shape nanoparticles with smooth edges.(B) at 100 kx magnifications, shows particles size ranged from 22.45 nm to 80.78 nm.
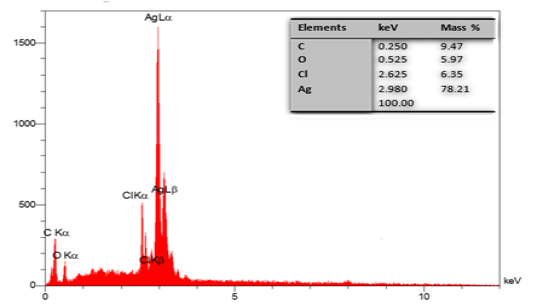
Energy dispersive X-ray (EDX) analysis of silver nanoparticles, shows a strong signal for the Ag atoms, other peaks observed were represent carbon (C), oxygen (O) and chlorine (Cl).
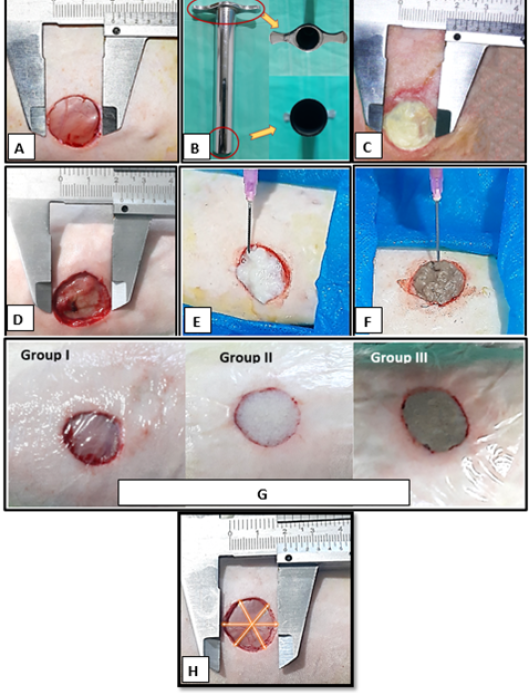
(A) Creation of circular full-thickness skin wound with 2 cm in diameter. (B) Shows a cylindrical metal tube with sharp end used for induce circular wound. (C) The induced infected wound. (D) Shows the infected wound after cleaning and debridement. (E) Application of SIS hydrogel on wound area. (F) Application of SIS hydrogel- AgNPs composite on wound area. (G) Shows covering of the wounds by Tegaderm in GI, GII and GIII. (H) Measurement of three different diameters of wound using a Vernier caliper.

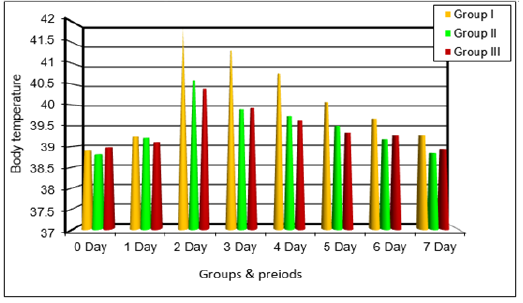
The mean values M± SD of body temperature (Degrees Celsius °C) during the first weak pre and post- induced infected wound and treatment.

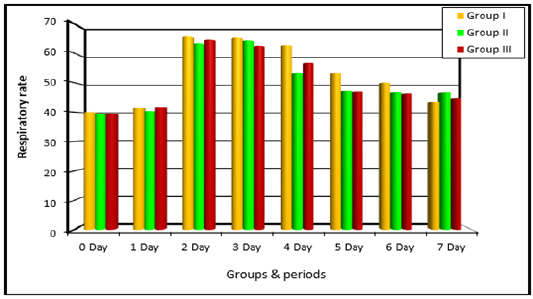
The mean values M± SD of respiratory rate (breaths per minute) during the first weak pre and post- induced infected wound and treatment.

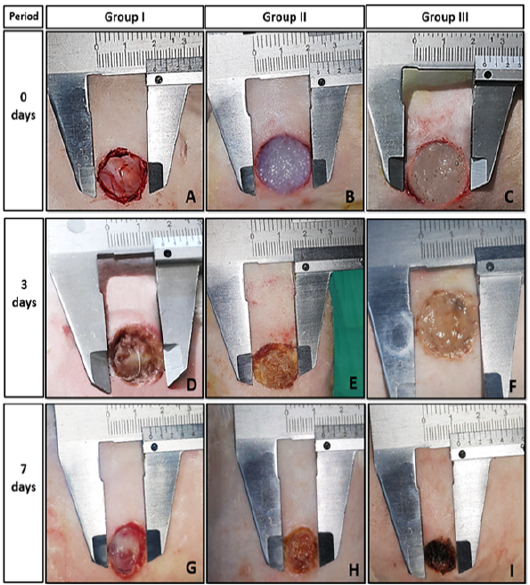
(A) The wound bed at zero day after debridement of group I. (B and C) The wounds of GII and GIII respectively at zero day, which are completely covered by fresh hydrogels. (D) The wound bed of GI at 3rd day shows the beginning of granulation tissue formation with swelling and rounding of wound edges. (E and F) The wounds defect of GII and GIII at 3rd day shows, no clear signs of inflammation, and the hydrogels become more homogenized with increased its adherence to the bed and edges of the wounds. (G) The wounds defect of control group at 7th still unfilled with granulation tissue, with a lesser reduction of wound area compared with GII and GIII. (H and I) The wounds of GII and GIII, respectively at 7th day post-treatment shows the organization and conversion of hydrogels to tissue-like structure.
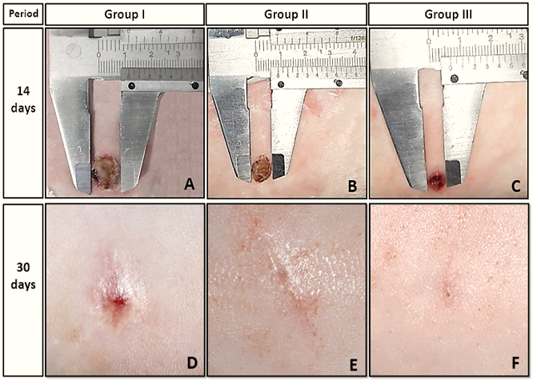
(A) The wound bed of GI at 14th day post-management is filled with granulation tissue, which appears higher than the adjacent normal skin. (B and C) The wounds in GII and GIII respectively at 14th day post treatment, shows the new tissue still at the same level to adjacent normal skin. (D) The wounds in GI shows incomplete closure at 30th day post-management. (E) The wounds of GII shows complete closure at 30th day post treatment with minimal scar formation. (F) The wounds area of GIII at 30th day post treatment disappeared without presence of scar tissue.


