
Levels and Timings of Irrigation Improves the Yield of Broccoli in Peshawar Region


Research Article
Levels and Timings of Irrigation Improves the Yield of Broccoli in Peshawar Region
Mohammad Umar* and Gohar Ayub
Department of Horticulture, University of Agriculture, Peshawar, Khyber Pakhtunkhwa, Pakistan.
Abstract | Experiments were conducted to study the effect of different irrigation levels i.e. (35%, 45% and 55 % depletion of maximum available water) and irrigation timings i.e. (Morning, Noon and Evening) on growth and yield of broccoli at Horticulture Research Farm, The University of Agriculture Peshawar during the growing season in 2016-17 and repeated in 2017-18. The experiment was laid out in Randomized Complete Block Design (RCBD) with split plot arrangement. Irrigation timings were kept in main plot, while irrigation levels in sub plot. Two years average results revealed that irrigation timings, levels and their interactions had significant effects on growth, yield and quality parameters of broccoli. Broccoli plants irrigated early in the morning resulted in early curd formation (66.8), maximum plant height (45.21cm), leaves plant-1 (15.84), leaf weight (11.00 g), primary curd weight (340.94 g), secondary curd weight (189.50 g), primary curd diameter (8.60), secondary curd diameter (7.56cm), curds plant-1 (8.73), yield (8.03 t ha-1) and survival (92.67 %) than rest of the treatments. As for as irrigation level is concerned, irrigation at 35 % rate resulted in in early curd formation (66.44 days), maximum plant height (47.54 cm), leaves plant-1 (15.88), leaf weight (11.24 g), primary curd weight (344.48g), secondary curd weight (192.88 g), primary curd diameter (8.70cm), secondary curd diameter (7.69 cm), curds plant-1(8.50), yield (8.44 t ha-1) and survival (92.33 %) than rest of the treatments. Regarding interactions majority of the growth and yield parameters showed best results in morning time irrigation @ 35 % depletion level. Irrigation with 35% depletion of maximum available water produced higher yield and yield components as compared to other treatments. Morning irrigation increased growth, yield and quality components of broccoli. Therefore, it is recommended that the broccoli plants should be irrigated with 35 % depletion of maximum available water to obtain best growth, yield and quality under the agro-climatic condition of Peshawar-Pakistan at the morning.
Received | February 22, 2024; Accepted | April 27, 2024; Published | May 30, 2024
*Correspondence | Mohammad Umar, Department of Horticulture, University of Agriculture, Peshawar, Khyber Pakhtunkhwa, Pakistan; Email: umar22us@hotmail.com
Citation | Umar, M. and G. Ayub. 2024. Levels and timings of irrigation improves the yield of broccoli in Peshawar region. Sarhad Journal of Agriculture, 40(2): 536-550.
DOI | https://dx.doi.org/10.17582/journal.sja/2024/40.2.536.550
Keywords | Broccoli, Curd weight, Irrigation, Survival and yield
Copyright: 2024 by the authors. Licensee ResearchersLinks Ltd, England, UK.
This article is an open access article distributed under the terms and conditions of the Creative Commons Attribution (CC BY) license (https://creativecommons.org/licenses/by/4.0/).
Introduction
Broccoli (Brassica oleracia L.) belonging to the family of Cruciferae is a delicious and one of the most vitamin rich winter vegetables. It is a member of cole crops, which is recently cultivated in Indian subcontinent and closely related to cauliflower and cabbage. It is fairly rich in carotene and ascorbic acid and contains appreciable quantities of thiamin, riboflavin, niacin and iron (Thomson and Kelly, 1985). There is a good scope for its large-scale cultivation in Pakistan for increasing vegetable diversification and to meet vegetable demand of the country’s people. However, the yield of broccoli in Pakistan is low compared to other countries. The crop is grown in Pakistan during winter when there is low precipitation and high evapotranspiration. Crop cultivation during this dry period usually requires irrigation. Broccoli being a shallow rooted crop requires frequent irrigation to keep the plant vigorous. Studies of various workers indicated that frequent irrigation gave the higher yields of curd (Islam et al., 1996; Gomes et al., 2000). Non-judicious irrigation not only reduces the efficiency of fertilizer and water use but also reduces the yield of cole crop (Rahman et al., 1988). Water deficits in any growth stage will decrease optimum growth and head quality of broccoli. The amount of water within the plant is small compared with the amount of water transpirated, and as a consequence, water uptake from the soil via the roots is very high. The extraction of water by roots and evaporation losses progressively reduces the moisture content of the soil to less than field capacity. If not replenished, soil water levels may ultimately reach the wilting point for plant growth. Broccoli growers are likely to over-apply water to achieve a desired yield, which results water loss from the system (Pasakdee et al., 2006). Improper irrigation management not only wastes available water resources, but also causes nutrient losses by leaching, runoff, and denitrification of N in both organic and conventional farming. Irrigation scheduling is a critical management input to ensure optimum soil moisture status for proper plant growth and development as well as for optimum yield, water use efficiency and economic benefits (Himanshu et al., 2013).
To quantify the exact amount of water required by a plant, it is necessary to consider two major parameters (Hanson et al., 1999). The amount of water required by the crop and also the rates of precipitation and evapotranspiration need to be considered to improve the accuracy of the estimation of the amount of water applied during the growing season. The optimum use of irrigation can be characterized as the rooting area, and at the same time, avoiding the leaching of nutrients into deeper soil layers (Kruger et al., 1999). Therefore, predicting the water content in the root zone can be a means of helping the farmer decide when, and how much to irrigate. The aim of irrigation management is to control soil water for optimal crop yield and quality, while conserving water. Therefore, the study was undertaken with the following specific objectives:
- To investigate the response of broccoli to different irrigation time/schedule.
- To predict an effective irrigation level for broccoli production.
Materials and Methods
The experiment entitled the effect of different irrigation levels and irrigation timings on growth and yield of broccoli in Peshawar region was carried out at Horticulture Research Farm, The University of Agriculture Peshawar during the growing season of the years 2016-17 and 2017- 18.
Physio-chemical soil analysis
Prior to the transplanting of broccoli seedlings in each year, five soil samples from different sites of the experimental block, were taken with the help of an auger at 0-15cm depth. The samples were mixed together for making a composite sample. The composite sample were dried in air and sieved for removing the mainly plant residues, stones or other unnecessary materials with a 2mm mesh. Different soil physico-chemical characteristics were analyzed, which show that the soil texture is silty clay loam, calcareous in nature (CaCO3= 13.4%), alkaline in reaction, low in organic matter content (0.58 sm-1) and with a total N content of 0.09 d Sm-1 has a mean soil pH of 7.9 having 32% clay, 53.05 % silt and 14.25 % sand.
Seed sowing
The nursery bed was prepared by adding compost and farm yard manure. Seeds were sown in October 2016 in the seedbed. Sowing was done thinly in lines spaced at 5 cm distance. Seeds were sown at a depth of 2 cm and covered with a fine layer of soil followed by light watering by using water can. Thereafter the beds were covered with dry straw to maintain required temperature and moisture. The cover of dry straw was removed immediately after emergence of seed sprout. When germinated seeds were shaded by bamboo mat (Chatai) to protect the young seedlings from scorching sunshine and rain.
Raising of seedlings
Light watering and weeding were done several times. No chemical fertilizers were applied for raising of seedlings. Seedlings were not attacked by any kind of insect or disease. Healthy and 21 days old seedlings were transplanted into the experimental field in November.
Layout
The experimental plot was first divided into four blocks. Each block consisted of 9 plots. Thus, the total numbers of plot were 27. Different combinations of irrigation time and levels were assigned to each block as per design of the experiment. The size of a unit plot was 4.5m × l.2m. A distance of 0.5 m between the plots and 1.0 m between the blocks were kept. Thus, the total area of the experiment was 27.2m × 16.5m.
Land preparation
The experimental area was first opened a month before by a disc plough to open direct sunshine to kill soil borne pathogens and soil inhabitant insects. It was prepared by several ploughing and cross ploughing with a power tiller followed by laddering to bring about a good tilth. The land was leveled, corners were shaped and the clods were broken into pieces. The weeds, crop residues and stables were removed from the field. The basal doses of manure and fertilizers were applied and finally leveled. According to design and layout the plots were prepared.
Transplanting
The seedbed was watered before uprooting the seedlings to minimize the damage of roots. At the time of uprooting, care was taken so that root damage become minimum and some soil remained with the roots. Twenty-one days-old healthy seedlings were transplanted at the spacing of 60 cm × 50 cm in the experimental field. Planting was done in the afternoon. Light irrigation was given immediately after transplanting around each seedling for their better establishment. The transplanting seedlings were shaded for five days with the help of white polythene to protect them from scorching sunlight, watering was done up to five days until they became capable of establishing on their own root system.
Treatments details were as under.
|
Factor A (Main plot factor) |
Factor B |
|
Irrigation timing (T) |
Irrigation levels (I) |
|
T1= Morning |
I1=35% depletion of maximum available water |
|
T2= Noon |
I2=45% depletion of maximum available water |
|
T3=Evening |
I3=55% depletion of maximum available water |
Weather data for the year 2016-17 and 2018.
|
2016 |
Total rainfall mm |
Average temperature oC Max |
Min |
|
January |
9.5 |
17.03 |
2.77 |
|
February |
33 |
22.69 |
3.76 |
|
March |
82.8 |
24.10 |
12.0 |
|
April |
25.2 |
30.07 |
14.10 |
|
May |
9 |
37.58 |
19.61 |
|
June |
51.2 |
39.37 |
23.80 |
|
July |
72 |
36.32 |
24.35 |
|
August |
86 |
35.74 |
22.39 |
|
September |
0 |
36.20 |
20.97 |
|
October |
0 |
32.68 |
14.55 |
|
November |
0 |
25.63 |
7.83 |
|
December |
0 |
22.42 |
2.29 |
|
2017 |
|||
|
January |
54 |
16.58 |
4.19 |
|
February |
33 |
21.18 |
5.57 |
|
March |
14 |
25.42 |
6.71 |
|
April |
33.6 |
32.40 |
14.30 |
|
May |
3 |
36.81 |
19.81 |
|
June |
46.4 |
37.80 |
22.23 |
|
July |
78.1 |
36.42 |
24.19 |
|
August |
67.2 |
34.94 |
24.03 |
|
September |
35 |
34.97 |
20.37 |
|
October |
0 |
32.65 |
14.45 |
|
November |
60.8 |
22.97 |
8.07 |
|
December |
15 |
19.65 |
2.45 |
|
2018 |
|||
|
January |
0 |
18.94 |
0.10 |
|
February |
40.4 |
21.0 |
4.64 |
|
March |
29.2 |
27.29 |
10.90 |
|
April |
102 |
31.50 |
15.50 |
|
May |
50 |
34.71 |
18.58 |
|
June |
12.8 |
38.97 |
22.20 |
|
July |
80 |
38.29 |
23.52 |
|
August |
35.8 |
37.84 |
24.84 |
|
September |
3.4 |
35.87 |
21.07 |
|
October |
32.9 |
28.68 |
13.45 |
|
November |
4.2 |
23.70 |
8.13 |
|
December |
0 |
18.71 |
0.48 |
The following parameters were studied:
Days to curd formation
Data for days to curd formation was collected by recording number days from transplanting to first flower appearance in randomly selected plants and their average was calculated.
Plant height (cm)
Plant height was measured from three sides from the ground surface to the tip of the plant of randomly selected plants at the time of apical head maturity and their average was calculated.
Number of leaves plant-1
Ten plants were selected randomly from each treatment of every replication. Their number of leaves plant-1 was measured and then their average was calculated.
Leaf weight (g)
Leaf weight of randomly selected plants was recorded and their average was calculated.
Primary curd weight (g)
Weight of the primary marketable curd of ten randomly selected plants was recorded and their average was calculated.
Secondary curd weight (g)
Weight of the secondary curd of ten randomly selected plants was recorded and their average was noted.
Primary curd diameter (cm)
Curd diameter was taken by using a meter scale at the final harvest. Diameter of the curd was measured at different directions and finally the average of all directions was recorded and expressed in centimeter (cm).
Secondary curd diameter (cm)
At the final harvest a meter scale was used for curd diameter.The curd diameter at different directions was measured and then finally the average of all directions was noted in centimeters (cm).
Number of curds plant-1
Number of curds of ten randomly selected plants was counted and their average was noted.
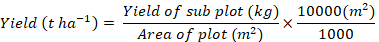
Total yield (t ha-1)
After harvesting, the weight of all the curds of each treatment in sub plot was obtained then total yield t ha-1 was computed by the following formula:
Survival %
Data for survival % was noted on the basis of total plants survived out of the total number of plants planted in each sub plot with the following formula:

Disease incidence %
The data was recorded on the basis of total plants diseased out of the total number of plants sprouted in each sub plot with the following formula.

Statistical analysis
The data recorded were analyzed statistically combined over years using analysis of variance techniques appropriate for RCB design with split plot arrangement. Means were compared using LSD test at 0.05 level of probability, when the F values were significant (Steel and Torrie, 1980). The statistical software GenStat release 8.1 (GenStat, 2005) was used for analysis of data.
Results and Discussion
Days to curd formation
Data concerning days to curd formation in response to different irrigation timing (T) and levels (I) is provided in (Table 1). Days to curd formation was significantly affected by different irrigation timing and irrigation levels. The interaction I × T was also significant; while rest of the interaction effects showed non-significant results (Figure 1). Irrigation in morning resulted in early curd formation (66.82 days), while late curd formation (70.11 days) was recorded in plants irrigated at evening. Irrigation at 35% depletion of maximum available water resulted in early curd formation (66.44 days) as compared to 45 % (68.23 days) and 55 % depletion of maximum available water (69.95 days). The interaction effect of I × T showed increasing trend for days to curd formation with increase in deletion of maximum available water with late time irrigation.
A significant difference was observed in curd formation among all three-irrigation timing with irrigation levels. Curd formation was delayed with late time irrigation than morning, which might be due to the fact that watering in the morning conserves water by allowing it to soak into the ground without evaporating. Watering during the middle of the day
Table 1: Days to curd formation of broccoli plants as affected by irrigation levels and irrigation time.
|
Treatments |
Years |
Mean |
|
|
2016 |
2017 |
||
|
Irrigation time (T) |
|||
|
Morning |
66.42 |
67.23 |
66.82 b |
|
Noon |
69.75 |
70.48 |
70.11 a |
|
Evening |
67.17 |
68.20 |
67.68 b |
|
LSD (0.05) |
NS |
NS |
2.16 |
|
Irrigation levels (I) % depletion of maximum available water |
|||
|
35% |
65.92 |
66.96 |
66.44c |
|
45 % |
67.83 |
68.63 |
68.23 b |
|
55 % |
69.58 |
70.32 |
69.95 a |
|
LSD (0.05) |
NS |
NS |
0.80 |
|
Year |
67.53B |
68.88A |
** |
|
Interactions |
|||
|
Y × T |
NS |
Y×I |
NS |
|
T × I |
** |
Y×T×I |
NS |
Means not followed by the same letters are significantly different. *, ** show probability level of 5 and 1 %, correspondingly. NS means non-significant.
also has its problems. Each water droplet that sits on a plant’s leaves will act like a magnifying glass and burn the leaves of the plants in the sun. In addition, if excess irrigation is used during the middle of the day, much of the water evaporates before it ever reaches the ground. Watering in the morning conserves water, allows greater penetration of water, and reduces disease problems. Irrigation level timing also has an effect on curd formation. Earliness in curd formation due to 35 % depletion of maximum available water might be due to the readily available water in root zone. In both the cases the decrease in days to curd formation with the water stress might be due to the circumstance of plants under water stress, which tends to complete their life cycle a few days earlier than those under normal or high soil moisture conditions. This enables them to escape unfavorable conditions, thereby ensuring the perpetuation of the species (Al-Suhaibani, 2009).
Plant height (cm)
It is evident from the data in Table 2 for plant height, that there was significant variation between different irrigation timings, levels and year as source of variation. The interactions were not significant. As for as irrigation timing is concerned, highest plant height (45.21 cm) was noted in plants irrigated in morning, whereas lowest plant height (42.13 cm) was recorded in evening irrigated plants. Irrigation at 35 % depletion level resulted in significantly tallest plants (47.54 cm) as compared to irrigation at 45 % depletion level (44.74 cm) and irrigation at 55 % depletion level (39.12 cm).
Table 2: Plant height (cm) of broccoli plants as affected by irrigation levels and irrigation time.
|
Treatment |
Years |
Mean |
|
|
2016 |
2017 |
||
|
Irrigation Time (T) |
|||
|
Morning |
44.79 |
45.63 |
45.21 a |
|
Noon |
41.47 |
42.78 |
42.13 b |
|
Evening |
43.40 |
44.72 |
44.06 a |
|
LSD (0.05) |
1.50 |
||
|
Irrigation levels (I) %depletion of maximum available water |
|||
|
35% |
47.13 |
47.95 |
47.54 a |
|
45 % |
44.26 |
45.22 |
44.74 b |
|
55 % |
38.28 |
39.96 |
39.12 d |
|
LSD (0.05) |
0.76 |
||
|
Year |
43.22AB |
44.38A |
** |
|
Interactions |
|||
|
Y × T |
NS |
Y × I |
NS |
|
T × I |
NS |
Y × T × I |
NS |
Means not followed by the same letters are significantly different. *, ** show probability level of 5 and 1 %, correspondingly. NS means non-significant.
The decrease in plant height both at noon, evening and 55 % depletion level might be since under soil moisture stresses the physiological process of the plant like assimilation; photosynthesis and translocation are slowing down, and ultimately decrease the plant height by inhibiting cell division and cell enlargement. Similar results were obtained by (Rajput and Patel, 2006), who reported that the growth increased with increasing irrigation rates. The increase in plant height with increased irrigation water could be mainly due to better availability of soil moisture that has enhanced effects on the vegetative growth of plants by increasing cell division and elongation. The increasing plant height with adequate depth of irrigation application also indicates the favorable effect of water in maintaining the turgor pressure of the cell, which is the major prerequisite for growth (Ramada and Ramanathan, 2017). On the other hand, shortening of plant height under soil moisture stress may be due to stomatal closure and reduced CO2 and nutrient uptake by the plants and, hence, photosynthesis and other biochemical process hampered, affecting plant growth (El-Noemani et al., 2009). Growths of plant depends on cell expansion and enlargement, which is probably most sensitive physiological aspect of a plant to water deficit leading to reducing plant productivity and ultimately affect plant height. Phenolic compounds produced in plants during water stress also respond to reduce plant growth (Al-Moshileh, 2007). The study is in agreement with the finding of Ramada and Ramanathan (2017) who reported that the highest and lowest plant height of shallot resulted from 1.0 to 0.5 ETc irrigation levels, respectively. David et al. (2016) also observed that the higher level of irrigation (1.2 IW) resulted in maximum plant height Al-Moshileh (2007) and Enchalew et al. (2016) reported that with increasing soil-water supply, plant growth parameters (plant height) were significantly increased.
The increased in plant height in 2017 could be due to the prevailing favorable weather condition because of higher precipitation and optimum temperature in 2016. The increased soil moisture content played an important role in dissolving nutrients and absorption (Wright, 2002) which in turn positively affected the plant height.
Number of leaves plant-1
Significant variation was observed in number of leaves plant-1 with different irrigation timing and irrigation levels (Table 3). The interaction effects of all the treatments were not significant. Regarding irrigation timing highest number of leaves (15.84) were counted in plants in morning timing, followed by (13.27) at curd formation time, while noon time irrigation produced least number of leaves plant-1 (12.25). The maximum number of leaves plant-1 (15.88) recorded with the application of 35 % depletion irrigation while minimum (11.49) were noted with 55% depletion level.
Table 3: Number of leaves plant-1 of broccoli as affected by irrigation levels and irrigation time.
|
Treatment |
Years |
Mean |
|
|
2016 |
2017 |
||
|
Irrigation time (T) |
|||
|
Morning |
15.35 |
16.33 |
15.84 a |
|
Noon |
11.61 |
12.88 |
12.25b |
|
Evening |
13.07 |
13.48 |
13.27 b |
|
LSD (0.05) |
1.22 |
||
|
Irrigation levels (I) % depletion of maximum available water |
|||
|
35% |
15.82 |
15.93 |
15.88 a |
|
45 % |
13.28 |
14.71 |
13.99 b |
|
55 % |
10.93 |
12.05 |
11.49c |
|
LSD (0.05) |
1.42 |
||
|
Year |
13.34 B |
14.23A |
** |
|
Interactions |
|||
|
Y × T |
NS |
Y × I |
NS |
|
T × I |
NS |
Y×T×I |
NS |
Means not followed by the same letters are significantly different. *, ** show probability level of 5 and 1 %, correspondingly. NS means non-significant.
The increased in number of leaves in morning time irrigation and 35 % depletion of maximum available water is due to the irrigation effect that facilitates nutrient availability and photosynthesis for undisrupted growth of the plant. Similarly, the reduced number of leaves per plant at curd formation, noon time and 55 % depletion of maximum available water attributed to the effects of water stress on cell expansion (Abbey and Joyce, 2004). This indicated that, when plants respond to water stress by closing their stomata to slowdown water loss by transpiration, gas exchange within the leaf is limited; consequently, photosynthesis and growth would slow down. The result also in agreement with the findings of Ramada and Ramanathan (2017) who found that leaf numbers had a linear correlation with the availability of soil moisture. The results are in close compliance with the findings of Islam et al. (1990), who attained the significantly maximum number of compound leaves per plant (11.40) at irrigation level 40% depletion of available soil moisture. Non-judicious irrigation not only reduces the efficiency of fertilizer and water use but also reduces the growth and yield of Cole crop (Rahman et al., 1988). Water deficits in any growth stage will decrease optimum growth and production of broccoli (Hussain et al., 2016). Improper irrigation management not only wastes available water resources, but also causes nutrient losses by leaching, runoff, and denitrification of N in both organic and conventional farming that ultimately results in poor plant growth and yield. Irrigation scheduling is a critical management input to ensure optimum soil moisture status for proper plant growth and development as well as for optimum yield, water use efficiency and economic benefits (Himanshu et al., 2013).
Leaf weight (g)
Information collected on leaf weight (g) processed for statistical analysis and the results are given in (Table 4). There is a significant result for irrigation timing and irrigation level, while all the interactions were found non- significant. These results demonstrated that Maximum leaf weight (11.00 g) was recorded in morning time irrigation, while minimum (9.86 g) was noted in noon time. Plots irrigated with 35% depletion level had a significant superiority over the other levels in respect of leaf weight. Maximum leaf weight (11.24 g) was recorded in plots irrigated with 35 % depletion, while leaf weight was minimum (9.85 g) in plots irrigated @55 % depletion level.
Table 4: Leaf weight (g) of broccoli plants as affected by irrigation levels and irrigation time.
|
Treatment |
Years |
Mean |
|
|
2016 |
2017 |
||
|
Irrigation time (T) |
|||
|
Morning |
10.68 |
11.33 |
11.00 a |
|
Noon |
9.57 |
10.16 |
9.86 d |
|
Evening |
9.95 |
10.58 |
10.26 b |
|
LSD (0.05) |
0.37 |
||
|
Irrigation levels (I) % depletion of maximum available water |
|||
|
35% |
10.92 |
11.57 |
11.24 a |
|
45 % |
9.72 |
10.35 |
10.03 b |
|
55 % |
9.56 |
10.15 |
9.85b |
|
LSD (0.05) |
0.35 |
||
|
Year |
10.06 |
10.69 |
NS |
|
Interactions |
|||
|
Y × T |
NS |
Y × I |
NS |
|
T × I |
NS |
Y × T × I |
NS |
Means not followed by the same letters are significantly different. *, ** show probability level of 5 and 1 %, correspondingly. NS means non-significant.
The increased in leaf weight in morning time and 35% depletion of irrigation could be accredited with adequate depth of irrigation application that indicates the favorable effect of water in maintaining the turgor pressure of the cell which is the major prerequisite for growth. On the contrary, shortening of plant height under soil moisture stress may be due to stomatal closure and reduced CO2 and nutrient uptake by the plants and, hence, photosynthesis and other biochemical process slow down, affecting plant growth (El-Noemani et al., 2009). The present result is also in agreement with the work of Al-Moshileh (2007) who reported that with increasing soil, water supply, the plant growth parameters (plant height, leaf number and leaf weight) were significantly increased. Thus, plants treated with water application at the sufficiency of water and no zero-water application at any growth stage produced leaves with the widest diameter and weight. However, plants treated with water deficit with 25% of ETc produced leaves with less weight. Leaf weight and areas decreased with the water stress. Schreiner et al. (2009) indicated the impacts of water stress over the leaves of mustard at every growth period.
Table 5: Primary curd weight (g) of broccoli as affected by irrigation levels and irrigation time.
|
Treatment |
Years |
Mean |
|
|
2016 |
2017 |
||
|
Irrigation time (T) |
|||
|
Morning |
336.30 |
345.59 |
340.94 a |
|
Noon |
288.74 |
301.68 |
295.21 c |
|
Evening |
313.70 |
323.18 |
318.44 b |
|
LSD (0.05) |
3.71 |
||
|
Irrigation levels (I) % depletion of maximum available water |
|||
|
35% |
341.52 |
347.44 |
344.48a |
|
45 % |
299.75 |
314.38 |
307.07 b |
|
55 % |
297.46 |
308.63 |
303.04b |
|
LSD (0.05) |
10.51 |
||
|
Year |
312.91 B |
323.48A |
** |
|
Interactions |
|||
|
Y × T |
NS |
Y × I |
NS |
|
T × I |
NS |
Y×T×I |
NS |
Means not followed by the same letters are significantly different. *, ** show probability level of 5 and 1 %, correspondingly. NS means non-significant.
Primary curd weight (g)
Data in Table 5 indicated highly significant differences among irrigation timing, irrigation levels and year of planting on primary curd weight (g). None of the interactions were significant. Regarding irrigation timing least primary curd weight (295.21 g) was produced at noon time irrigation, followed by (318.44 g) in curd formation time irrigation, whereas highest primary curd weight (340.94 g) was produced in morning time. The highest primary curd weight (344.48 g) was recorded in 35 % depletion of irrigation, followed by (307.07 g) at 45 % depletion of irrigation, while irrigation @ 55% depletion produced least primary curd weight (g) (303.04 g). Regarding year maximum primary curd weight (323.48 g) was recorded during 2017 as compared to (312.91 g) in 2016. Irrigation in morning timing with 35 % irrigation increased in curd weight (g).
The increased in curd weight due to morning irrigation and also at 35 % depletion of irrigation might be due to the availability of sufficient soil moisture for longer time. These differences may be due to changes in photosynthesis process, which is the most significant process influence crop production and is also affected by drought stress. Some photosynthesis process studies have shown that the photosynthetic rate of leaves decreases as relative water content and water potential decrease (Tardieu et al., 1998). Limitation of net photosynthetic rate in low moisture stressed plant is mainly through stomatal closure (Bota et al., 2004) and/or by metabolic impairment (Taiz and Zeiger, 2002).
Year as a source of variation showed that curd weight was more during 2017 as compared to 2016. The increase in curd weight in 2017 might be due to the optimum climatic conditions. Water being an important manageable input affecting the growth, yield and quality of broccoli (Belanger et al., 2000). Plant close their stomata at relatively low soil moisture deficits leading to faster decrease in photosynthesis and transpiration rate than other field crops. Moreover, broccoli has a shallow root system, hence requires frequent irrigation in soils with low water holding capacity (Kumar et al., 2003).
Secondary curd weight (g)
Data analyzed statistically regarding secondary curd weight are presented in Table 6. It is cleared from the analyzed data that irrigation level, irrigation timing and year of sowing significantly affected secondary curd weight (g). All the interactions remained non-significant. Regarding irrigation timing maximum secondary curd weight (189.50 g) was recorded in morning time irrigation as compared to (169.71 g) in noon time irrigation. Significantly highest curd weight (192.88 g) was obtained from the plots irrigated @ 35 % depletion level, followed by (174.79 g) from plants irrigated @ 45 % depletion level, while least curd weight (174.00 g) was recorded in plots irrigated @ 55 % depletion level.
Table 6: Secondary curd weight (g) of broccoli as affected by irrigation levels and irrigation time.
|
Treatment |
Years |
Mean |
|
|
2016 |
2017 |
||
|
Irrigation time (T) |
|||
|
Morning |
186.00 |
193.01 |
189.50 a |
|
Noon |
162.88 |
176.55 |
169.71 c |
|
Evening |
178.74 |
186.19 |
182.47 b |
|
LSD (0.05) |
5.45 |
||
|
Irrigation levels (I) % depletion of maximum available water |
|||
|
35% |
188.54 |
197.22 |
192.88 a |
|
45 % |
170.34 |
179.25 |
174.79 b |
|
55 % |
168.73 |
179.28 |
174.00 b |
|
LSD (0.05) |
3.71 |
||
|
Year |
175.87B |
185.25A |
** |
|
Interactions |
|||
|
Y × T |
NS |
Y × I |
NS |
|
T × I |
NS |
Y×T×I |
NS |
Means not followed by the same letters are significantly different. *, ** show probability level of 5 and 1 %, correspondingly. NS means non-significant.
Data recorded for secondary curd weight revealed the trend of delay in irrigation timing with increasing the depletion of maximum available water. As stated early that irrigation in the morning conserves water by allowing it to soak into the ground without evaporating. Also, minimum depletion of available water will conserve water for maximum time in root zone area. Frequent watering to the soil especially during the early growth stages of the crop prevented water stress and kept the soil in available moisture that help to improve plant health and growth and ultimately the curd yield components increased (Moniruzzaman et al., 2007). Studies of various workers indicated that frequent irrigation gives higher yields of curd (Gomes et al., 2000). Proper irrigation time is an effective method of manipulating crop growing environment to increase yield and improve product quality by ameliorating soil temperature, conserving soil moisture (Hochmuth et al., 2001; Awodoyin and Ogunyemi, 2005).
The increased in secondary curd weight during year 2016-17 might be due the favorable climatic condition like temperature, soil fertility, photoperiod moisture and rainfall which helped in better growth. Water has been recognized as an important manageable input influencing broccoli growth, development, quality and yield (Belanger et al., 2000). Plant close their stomata at relatively low soil moisture deficits leading to faster decrease in photosynthesis and transpiration rate than other field crops. Moreover, if the soil with having low water holding capacity be required to fill the depletion level as required by broccoli because it has a shallow root system (Kumar et al., 2003).
Primary curd diameter (cm)
Irrigation time, irrigation level and year as a source of variation significantly affected the primary curd diameter (cm), while none of the interaction showed significant results (Table 7). About irrigation timing it was observed that irrigation in morning time increased the curd diameter (8.60 cm) which was followed by (8.42 cm) in curd formation irrigation, while least curd diameter (7.93 cm) was produced at noon time irrigation. Irrigation @ 35 % produced significantly maximum curd diameter (8.70 cm) that was significantly different from the subsequent irrigation levels i.e., 45 % and 55 % which produced (8.19 cm) and (8.07 cm) curd diameter respectively. Concerning the year, maximum curd diameter (8.43) was recorded during 2017 as compared to (8.21 cm) in 2016.
The higher broccoli curd diameter in morning irrigation and with 35 % depletion of maximum available water was due to the availability more quantity of water thereby improving the plant shoot and root growth which resulted in increased nutrient uptake in comparison to other treatments. Similar findings were also reported by Gadissa and Chemeda (2009) and Jayapiratha et al. (2010). Our results are also in agreement with Thompson et al. (2000) who stated that high irrigation treatments (soil water tension is between 10-12 kPa) generally increased curd yield components of broccoli and cauliflower.
A significant difference was observed regarding primary curd diameter during 2016 and 2017. The increased in curd diameter during year 2017 could be contributed to the optimum climatic condition like temperature, photoperiod, moisture and rainfall. Water acts as a solvent. Plants can absorb nutrients when these nutrients are dissolved in water which increased the fertility of the soil. Also, the temperature was not too hot during the year 2017 which leads to optimum curd formation. The broccoli is a plant mainly of typical temperate climate. The crop grows best in cool but frost-free seasons and does not perform well in heat (Haverkort and Verhagen, 2008).
Table 7: Primary curd diameter (cm)of broccoli as affected by irrigation levels and irrigation time.
|
Treatment |
Years |
Mean |
|
|
2016 |
2017 |
||
|
Irrigation time (T) |
|||
|
Morning |
8.51 |
8.70 |
8.60 a |
|
Noon |
7.80 |
8.07 |
7.93 c |
|
Evening |
8.31 |
8.53 |
8.42 ab |
|
LSD (0.05) |
0.23 |
||
|
Irrigation levels (I) % depletion of maximum available water |
|||
|
35% |
8.63 |
8.77 |
8.70a |
|
45 % |
8.04 |
8.34 |
8.19 b |
|
55 % |
7.95 |
8.18 |
8.07 b |
|
LSD (0.05) |
0.19 |
||
|
Year |
8.21B |
8.43A |
** |
|
Interactions |
|||
|
Y × T |
NS |
Y × I |
NS |
|
T × I |
NS |
Y × T × I |
NS |
Means not followed by the same letters are significantly different. *, ** show probability level of 5 and 1 %, correspondingly. NS means non-significant.
Secondary curd diameter (cm)
Data in Table 8 indicated that irrigation timing, irrigation level and year as source of variation significantly affected secondary curd diameter. The interactions effect of I × T showed significant results, while the remaining interactions were non-significant. Maximum curd diameter (7.56 cm) was recorded in plots irrigated in morning time, followed by (7.38 cm) in curd formation irrigation, while minimum curd diameter (6.40 cm) was reported at noon irrigation. Application of 35 % less irrigation of maximum available water resulted in highest curd diameter (7.69 cm) followed by (6.95 cm) in plots irrigated with 45 % depleted, while least curd diameter (6.69 cm) in increasing irrigation level to 55 %. Maximum curd diameter (7.21 cm) was recorded during the year 2017 as compared to (7.01 cm) in 2016.The I × T interaction showed a decreasing trend in curd diameter with increase in irrigation level from 35 % to 55 % with late time irrigation of the day, however decrease in curd diameter was observed in noon irrigation with 55 % depletion of maximum available water (Figure 2).
Table 8: Secondary curd diameter (cm) of broccoli as affected by irrigation levels and irrigation time.
|
Treatment |
Years |
Mean |
|
|
2016 |
2017 |
||
|
Irrigation time (T) |
|||
|
Morning |
7.45 |
7.67 |
7.56 a |
|
Noon |
6.33 |
6.47 |
6.40 c |
|
Evening |
7.27 |
7.48 |
7.38 b |
|
LSD (0.05) |
0.34 |
||
|
Irrigation levels (I) % depletion of maximum available water |
|||
|
35% |
7.63 |
7.76 |
7.69 a |
|
45 % |
6.86 |
7.03 |
6.95 b |
|
55 % |
6.56 |
6.83 |
6.69 c |
|
LSD (0.05) |
0.19 |
||
|
Year |
7.01B |
7.21 A |
** |
|
Interactions |
|||
|
Y ×T |
NS |
Y ×I |
NS |
|
T×I |
** |
Y × T×I |
NS |
Means not followed by the same letters are significantly different. *, ** show probability level of 5 and 1 %, correspondingly. NS means non significant.
This might be due to the optimum moisture in the vicinity of root zone throughout the crop growth period which enhance the vegetative growth of the crop thereby increase the photosynthesis and efficient translocation of photosynthate towards the reproductive organ i.e., curd, which increases the length, width and weight of curd finally resulted in increased curd yield of broccoli. This may also be due to complete solubility, mobilization and availability of nutrients at regular interval in required quantity. Similar findings were reported by (Khan et al., 2010). The results are also in conformity with Singh et al. (2011), who also reported that the average curd weight, curd volume, benefit cost ratio and yield were found to be maximum with 80% recommended dose of fertilizers and 0.8 PET water application.
The favorable weather conditions like temperature, photoperiod, soil moisture, and rainfall during the year 2017 resulted in maximum photosynthesis, dissolving nutrients and absorption which increased in curd diameter and yield t ha-1 (Wright, 2002). The maximum temperature and less rainfall during 2014 might have resulted a slight stress condition that affect the photosynthesis (Coronic et al., 1992) and negatively affected curd yield tuberization. The number of curds in the final yield was significantly dependent on the soil moisture and that soil moisture favorable for plants led to an increase of the number of curds.
Table 9: Number of curds plant-1 of broccoli as affected by irrigation levels and irrigation time.
|
Treatment |
Years |
Mean |
|
|
2016 |
2017 |
||
|
Irrigation time (T) |
|||
|
Morning |
8.67 |
8.79 |
8.73 a |
|
Noon |
7.88 |
8.04 |
7.96 c |
|
Evening |
8.08 |
8.25 |
8.17 b |
|
LSD (0.05) |
0.20 |
||
|
Irrigation levels (I) % depletion of maximum available water |
|||
|
35% |
8.41 |
8.59 |
8.50 a |
|
45 % |
8.38 |
8.48 |
8.43 b |
|
55 % |
7.85 |
8.02 |
7.93 c |
|
LSD (0.05) |
0.11 |
||
|
Year |
8.21 |
8.36 |
NS |
|
Interactions |
|||
|
Y × T |
NS |
Y × I |
NS |
|
T × I |
** |
Y×T×I |
NS |
Means not followed by the same letters are significantly different. *, ** show probability level of 5 and 1 %, correspondingly. NS means non significant.
Number of curds plant-1
Number of curds plant-1 as affected by irrigation timing and irrigation level is presented in (Table 9). The mean data in the table showed that number of curds plant-1 was significantly influenced by three irrigation level and irrigation timing. The interaction I × T was also significant. Regarding irrigation timing, the higher number of curds plant-1 (8.73) was obtained from plants irrigated in morning time, while the lowest number of curds plant-1 (7.96) was recorded in plants irrigated at noon. Maximum number of curds plant-1 (8.50) was produced at 35 % irrigation, which was followed by (8.43) in 45 % irrigation, whereas increasing irrigation level to 55 % produced less number of curds plant-1 (7.93). The Figure 3 showed the I × T interaction which exposed a linear trend of decreasing in number of curds plant-1 with increase in irrigation level from 35 % to 55 % at late time irrigation of the day.
Number of curd plant-1 increased with morning time irrigation and 35 % less irrigation of maximum available water. The available water at these was maximum than other treatments. This increment in number of curd plant-1 due to the fact that adequate soil moisture enhanced the uptake of nutrients, and other numerous biochemical and enzymatic reactions in the soil which in turn hastened the growth of plants, stimulation of root development and eventually produce more number of curd plant-1. Water, soil and plant are three-component system, each of which affects a final product. Soil is a reservoir for water storage and the water is essential for plant growth. Water stress decreases the elongation of leaves, dry weight of shoots, leaf area index, the leaflet numbers and average leaf area and turgor pressure in plant tissues (Turk, 2005). The action impacts on physiological processes such as photosynthesis, respiration, translocation of and absorption of nutrition, and ultimately affects the growth (Sivakumar and Shaw, 1998). Also, environmental factors such as rainfall, relative humidity, temperature and sunlight, and crop factors such as planting date, fertilizing etc.
Yield (tons ha-1)
Data in Table 10 indicated that irrigation timing, irrigation levels and year as source of variation significantly affected yield (t ha-1). The interactions effect of I ×T showed significant results (Figure 4). Maximum yield (8.03 t ha-1) was recorded in plots irrigated in morning, followed by (7.43 tha-1) at curd formation time, while minimum yield (6.45 t ha-1) was recorded at noon time irrigation. Irrigation @ 35 % produced the highest yield of (8.44t ha-1) followed by (6.86 t ha-1) in plots irrigated with 45 % depleted water, while least yield (6.61 t ha-1) at 55 % irrigation. A significant variation was observed during 2016 and 2017 regarding curd yield. Maximum yield (7.47 t ha-1) was recorded during the year 2017 as compared to (7.14t ha-1) in 2016.The I x T interaction showed a decreasing trend in yield with increase in irrigation level from 35 % 01 to 55 % at all the times (Figure 4).
Table 10: Yield (t ha-1) of broccoli as affected by irrigation levels and irrigation time.
|
Treatment |
Years |
Mean |
|
|
2016 |
2017 |
||
|
Irrigation time (T) |
|||
|
Morning |
7.88 |
8.18 |
8.03 a |
|
Noon |
6.23 |
6.66 |
6.45 c |
|
Evening |
7.30 |
7.57 |
7.43 b |
|
LSD (0.05) |
0.22 |
||
|
Irrigation levels (I) % depletion of maximum available water |
|||
|
35% |
8.28 |
8.61 |
8.44 a |
|
45 % |
6.72 |
7.01 |
6.86 b |
|
55 % |
6.42 |
6.80 |
6.61 c |
|
LSD (0.05) |
0.22 |
||
|
Year |
7.14B |
7.47A |
** |
|
Interactions |
|||
|
Y × T |
NS |
Y × I |
NS |
|
T × I |
** |
Y × T × I |
NS |
Means not followed by the same letters are significantly different. *, ** show probability level of 5 and 1 %, correspondingly. NS means non significant.
The significant improvement in the broccoli curd yield might be due to the cumulative effect of significant improvement in the value of yield attributes like number of leaves, curd number, curd weigh and curd diameter that were maximum in morning irrigation with 35 % irrigation level. Verma et al. (2017) reported increase in yield of cabbage with increasing water availability. The possibility of increased yield of broccoli due to the increased photosynthesis, maximum head weight and the production of more number of functional leaves. The increased yield under drip irrigation might have resulted due to better water utilization (Manfrinato, 1974), higher uptake of nutrients (Bafna et al., 1993), irrigation interval of 2 days (Gvozden et al., 2010) and excellent soil-water-air relationship with higher oxygen concentration in the root zone (Gornat et al.,1973)
The favorable weather conditions like temperature, photoperiod, soil moisture, and rainfall during the year 2017 resulted in maximum photosynthesis, dissolving nutrients and absorption which increased in yield tha-1 (Wright, 2002). The maximum temperature and less rainfall during 2016 might have resulted a slight stress condition that affect the photosynthesis (Coronic et al., 1992) and negatively affected curd formation.
Survival %
Survival % of broccoli plants was significantly affected by irrigation time and level (Table 11). All the interactions were not significant. Regarding the irrigation time maximum plant survival (92.67%) was noted in plants in morning time irrigation, while irrigation at noon resulted in less (81.92 %) plant survival. The highest plant survival (92.33%) was recorded in plots irrigated at 35% depletion, followed by (86.46 %) at 45% depletion, whereas least plant survival (85.58 %) was noted in plants at 55 % depletion of available water for irrigation.
Table 11: Survival %of broccoli plants as affected by irrigation levels and irrigation time.
|
Treatment |
Years |
Mean |
|
|
2016 |
2017 |
||
|
Irrigation time (T) |
|||
|
Morning |
91.83 |
93.50 |
92.67 a |
|
Noon |
81.33 |
82.50 |
81.92 b |
|
Evening |
88.67 |
90.92 |
89.79 a |
|
LSD (0.05) |
NS |
NS |
3.11 |
|
Irrigation levels (I) % depletion of maximum available water |
|||
|
35% |
92.00 |
92.67 |
92.33 a |
|
45 % |
85.92 |
87.00 |
86.46 b |
|
55 % |
83.92 |
87.25 |
85.58 b |
|
LSD (0.05) |
2.04 |
||
|
Year |
87.28 |
88.97 |
NS |
|
Interactions |
|||
|
Y × T |
NS |
Y × I |
NS |
|
T × I |
NS |
Y × T × I |
NS |
Means not followed by the same letters are significantly different. *, ** show probability level of 5 and 1 %, correspondingly. NS means non-significant.
Irrigation in morning time and with 35 % depletion level of irrigation significantly increased plant survival %. This might due to the fact that watering in the morning conserves water by allowing it to soak into the ground without evaporating. Avoid watering at night because foliage will stay wet all night long leading to disease problems. Watering during the middle of the day also has its problems. Each water droplet that sits on a plant’s leaves will act like a magnifying glass and burn the leaves of the plants in the sun. In addition, if overhead irrigation is used during the middle of the day, much of the water evaporates before it ever reaches to the ground. Watering in the morning conserves water, allows greater penetration of water, and reduces disease problems. Also, most fungal plant pathogens produce spores during nighttime, being dispersed after dawn. Consequently, morning irrigations are prone to dislodge and disperse spores, also offering humidity and free water for germination at the leaf surface. Some fungal pathogens may form spores or propagules later in the day and are thus favored by evening irrigations, while night irrigation will reduce spore dispersion, as reported for Phytophthora infestans (Rotem and Palti, 1969).
Disease incidence %
Disease incidence % was positively affected by difference in irrigation time while irrigation level has no significant effect on disease incidence (Table 12). All the interactions were not significant. Among the irrigation timing, irrigation at evening time resulted in maximum disease incidence (9.45 %) than other timings.
Table 12: Disease incidence % of broccoli plants as affected by irrigation levels and irrigation time.
|
Treatment |
Years |
Mean |
|
|
2016 |
2017 |
||
|
Irrigation time (T) |
|||
|
Morning |
6.82 |
6.97 |
6.89 c |
|
Noon |
7.96 |
7.64 |
7.80 b |
|
Evening |
11.00 |
7.90 |
9.45 a |
|
LSD (0.05) |
1.43 |
||
|
Irrigation levels (I) % depletion of maximum available water |
|||
|
35% |
9.34 |
8.34 |
8.84 a |
|
45 % |
7.90 |
6.09 |
6.99 b |
|
55 % |
8.55 |
8.07 |
8.31 ab |
|
LSD (0.05) |
1.55 |
||
|
Year |
8.59 |
7.50 |
NS |
|
Interactions |
|||
|
Y × T |
NS |
Y × I |
NS |
|
T × I |
NS |
Y × T × I |
NS |
Means not followed by the same letters are significantly different. *, ** show probability level of 5 and 1 %, correspondingly. NS means non significant.
Disease incidence was maximum during night time irrigation than morning. As early morning is the best time to irrigate plants. When watering is completed, the plant foliage dries quickly. The rapid drying of plant foliage helps guard cells against the development of fungal diseases. Watering in the evening can lead to greater disease problems as the plant foliage will likely remain wet throughout the night. Most fungal plant pathogens produce spores during nighttime, being dispersed after dawn. Consequently, prone to dislodge and disperse spores, also offering humidity and free water for germination at the leaf surface. Some fungal pathogens may form spores or propagules later in the day and are thus favored by evening irrigations, while night irrigation will reduce spore dispersion, as reported for Phytophthora infestans (Rotem and Palti, 1969).
Conclusions and Recommendations
Irrigation with 35% depletion of maximum available water produced higher yield and yield components as compared to other treatments. Morning irrigation increased growth, yield and quality components of broccoli. Therefore, it is recommended that the broccoli plants should be irrigated with 35 % depletion of maximum available water to obtain best growth, yield and quality under the agro-climatic condition of Peshawar Pakistan at the morning.
Novelty Statement
To obtain best growth, yield and quality under the agro-climatic condition, the broccoli plants should be irrigated with 35 % depletion of maximum available water.
Author’s Contribution
Mohammad Umar: PhD scholar, who did research, data collection, analysis and wrote this MS.
Gohar Ayub: Major supervisor, who guided and supervised course of study.
Conflict of interest
The authors have declared no conflict of interest.
References
Abbey, L. and D.C. Joyce. 2004. Water deficit stress and soil type effects on spring onion accumulation and partitioning in two potato cultivars. J. Plant Nutr., 25: 1621-1630. https://doi.org/10.1081/PLN-120006047
Al-Moshileh, A.M., 2007. Effect of planting date and irrigation water level on onion (Allium cepa L.) productivity under Central Saudi Arabian conditions. Sci. J. King Faisal Univ. (Basic Appl. Sci.). C.f. Computer Res.
Al-Suhaibani, N.A., 2009. Influence of early water deficit on seed yield and quality of faba bean under arid environment of Saudi Arabia. Am. Eurasian J. Agric. Environ. Sci., 5(5): 649-654.
Awodoyin, R.O. and S. Ogunyemi. 2005. Use of sicklepod, Senna obtusifolia (L.) Irwin and Barneby, as mulch interplant in cay-enne pepper, Capsicum frutescens L., production. Emirate J. Agric. Sci., 17(1): 10-22. https://doi.org/10.9755/ejfa.v12i1.5044
Bafna, A.M., S.Y. Dafterdar, K.K. Khade, P.V. Patel and R.S. Dhotre. 1993. Utilization nitrogen and water by tomato under drip irrigation systems. J. Water Manage., 1(1): 1-5.
Belanger, C., J.R. Walsh, J.F. Richard, P.H. Milburn and N. Zaidi. 2000. Yield response of two potato cultivars to supplemental irrigation and nitrogen fertilization in New Brunswick. Am. J. Potato Res., 77: 11-21. https://doi.org/10.1007/BF02853657
Bota, J.H., Medrano and J. Flexas. 2004. Is photosynthesis limited by decreased Rubisco activity and RuBP content under progressive water stress? New Phytol., 162: 671–681. https://doi.org/10.1111/j.1469-8137.2004.01056.x
Coronic, G., J.G. Hashghaie, B. Genty and J.M. Briantais. 1992. Leaf photosynthesis is resistant to mild drought stress. Photosynthetica, 27: 295-300.
David, K., C. Emmanuel and K. John. 2016. Effects of deficit irrigation on yield and quality of onion crop. J. Agric. Sci. 8(3): 112-126.
A.A., A.A.A.and O.M. 2009. Growth, yield, quality and water use efficiency of pea plant as affected by evapotranspiration and sprinkler height. J. Agric. Res., 34: 1445–1466.
Enchalew, B., S.L. Gebre, M. Rabo, B. Hindaye, M. Kedir, Y. Musa, & Shafi, A. .2016. Effect of deficit irrigation on water productivity of onion (Allium cepa L.) under drip irrigation. J. Irrigat. Drain. Sys. Eng., 5(3): 168-197.
Gadissa, T. and D. Chemeda. 2009. Effects of drip irrigation levels and planting methods on yield and yield components of green pepper (Capsicum annuum L.) in Bako, Ethiopia. Agric. Water Manage., 96: 1673-1678. https://doi.org/10.1016/j.agwat.2009.07.004
Gomes, R., M.S. Khan and M.M. Islam. 2000. Effects of irrigation and nitrogen on broccoli in grey terrace soil. Bangladesh J. Agric. Res., 25: 423-430.
Gornat, B., D. Goldberg, D. Rimon and J.A. Ben. 1973. The physiological effect of water quality and method of application on tomato, cucumber and pepper. J. Am. Soc. Hortic. Sci., 98(2): https://doi.org/10.21273/JASHS.98.2.202
Gvozden, D.G., B. Smiljana, B. Lovre, B. Josip and P. Milan. 2010. Effects of drip irrigation regimes on tomato fruit yield and water use efficiency. J. Food Agric. Environ., 8(3-4): 709-713.
Hanson, B., L.J. Schwankl and A. Fulton. 1999. Scheduling irrigations: When and how much water to apply. University of California Irrigation Program, Davis, CA.
Haverkort, A.J. and A. Verhagen. 2008. Climate change and the repercussions for the potato supply chain. Potato Res., 51(3-4): 223–237. https://doi.org/10.1007/s11540-008-9107-0
Himanshu, S.K., A.K. Sing and S.K.P. Kalura. 2013. Response of Broccolli to irrigation scheduling and methods under drip, sprinkler and surface irrigation. Int. J. Eng. Adv. Technol., 2(4).
Hochmuth, G.J., R.C. Hochmuth and S.M. Olson. 2001. Polyethylene mulching for early vegetable production in North Florida. University of Florida/Institute of Food and Agricultural Sciences (UF/IFAS), Florida A and M University Cooperative Extension Programme.
Hussain, M.J., R.P. Rannu, M.A. Razzak, R. Ahmed and M.H.R. Sheikh. 2016. Response of Broccoli (Brassica oleracia L.) to different irrigation regimes. Agriculturists, 14(1): 98-106. https://doi.org/10.3329/agric.v14i1.29106
Islam, M.M., M.S. Islam, R. Gomes, R.A. Begum and A. Khatun. 1996. Response of cauliflower to different soil moisture regimes and nitrogen level. Proc. Agric., 7: 73-76.
Islam, T., H. Sarker, J. Alam and H.U. Rashid. 1990. Water use and yield relationships of irrigated potato. Agric. Water Manage., 18: 173-179. https://doi.org/10.1016/0378-3774(90)90029-X
Jayapiratha, V., M. Thushyanthy and S. Sivakumar. 2010. Performance evaluation of okra (Abelmoschus esculantus) under drip irrigation system. Asian J. Agric. Res., 4: 139-147. https://doi.org/10.3923/ajar.2010.139.147
Khan S., S. Rehman, A. Z. Khan, M. A. Khan, M. T. Shah. 2010. Soil and vegetables enrichment with heavy metals from geological sources in Gilgit, northern Pakistan. Ecotoxicol.Environ. Safe., 73: 1820-1827.
Kruger, E., G. Schmidt and U. Brucker. 1999. Scheduling strawberry irrigation based upon tensiometer measurement and a climatic water balance model. J. Hortic. Sci., 81: 409-424. https://doi.org/10.1016/S0304-4238(99)00030-8
Kumar D., R. Ezekiel and S.M.P. Khurana. 2003. Effects of location, season and cultivar on the processing quality of potatoes. J. Indian Potato Assoc., 30: 247-251.
Manifrinato, H.A. 1974. Effect of drip irrigation on soil water plant relationships. Second Intern. Drip Irrig. Congress. 446-451.
Moniruzzaman, M., Z.A. Firoz, A.S.M.H. Rashid and G.M.A. Halim. 2007. Effect of planting time and curd scooping on seed production of cauliflower var. BARI Fulkapi-1. J. Sci. Technol. (Dinajpur), 5: 67-73.
Pasakdee, S., G. Banuelos, C. Shennan and W. Cheng. 2006. Organic N fertilizers and irrigation influence organic Broccoli production in two regions of California. J. Vegetable Sci., 12(4). https://doi.org/10.1300/J484v12n04_04
Rahman, M.A., D. Guha, P.C. Golder and M.A. Sattar. 1988. Effect of irrigation and mulch on the growth and yield of cabbage in the hilly region. Bangladesh Hortic., 17: 37-39.
Rajput, T.B.S. and N. Patel. 2006. Water and nitrate movement in drip-irrigated onion under fertigation and irrigation treatments. Agric. Water Manage., 7: 293–311. https://doi.org/10.1016/j.agwat.2005.03.009
Ramada, S. and S.P. Ramanathan. 2017. Evaluation of drip fertigation in aerobic rice-onion cropping system. Int. J. Curr. Microbiol. Appl. Sci., 6(4): 2623–2628. https://doi.org/10.20546/ijcmas.2017.604.305
Rotem, J. and J. Palti. 1969. Irrigation and plant diseases. Ann. Rev. Phytopathol., 7(1): 267-288. https://doi.org/10.1146/annurev.py.07.090169.001411
Schreiner, M., B. Beyene, A. Krumbein and H. Stuetzel. 2009. Ontogenetic changes of 2- propenyl and 3-indolylmethyl Glucosinolates in Brassica carinata leaves as affected by water supply. J. Agric. Food Chem., 57(16): 7259-7263. https://doi.org/10.1021/jf901076h
Singh, K.P., V.K. Singh, R.K. Roy. 2011. Effect of different levels of boron and its methods of application on growth and yield of cauliflower (Brassica oleracea var. botrytis L.). Vegetable Sci., 38(1): 76-78.
Sivakumar, M.V.K. and R.H. Shaw.1998. Relative evaluation of water stress indictor for soybeans. Agron. J., 70: 619-623. https://doi.org/10.2134/agronj1978.00021962007000040022x
Steel, R.G.D. and J.H. Torrie. 1980. Principles and procedures of statistics. 2nd ed. McGraw Hill, New York.
Taiz, L. and Zeiger, E. 2002. Plant Physiology (Third Edition). Sinauer Associates, Inc., Publishers, Sunderland, 67-86.
Tardieu, F. and T. Simonneau. 1998. Variability among species of stomatal control under fluctuating soil water status and evaporative demand: Modelling isohydric and anisohydric behaviours. J. Exp. Bot., 49: 419–432. https://doi.org/10.1093/jxb/49.Special_Issue.419
Thompson T.L., A. Thomas and E.D.R. Godin. 2000. Nitrogen and water interactions in subsurface drip-irrigated cauliflower. Soil Sci. Soc. Am. J., 64(1): 412. https://doi.org/10.2136/sssaj2000.641412x
Thomson, H.C. and W.C. Kelly. 1985. Vegetable crops (5th ed). Mcgrow-Hill Book Co. pp. 15.
Turk, K.J.H.A.E., 2005. Drought adaptation of cowpea. Agron. J., 76: 557-560.
Verma, S., O.P. Garhwal1, A.K. Mahawar, S.P. Singh and B. Singh. 2017. Response of Cabbage (Brassica oleracea var. capitata L.) Cultivar “Golden Acre” to irrigation intervals and different types of mulches. J. Exp. Agric. Int., 16(4): 1-9.
Verma, S.K. and M. Verma. 2007. A textbook of plant physiology, biochemistry and biotechnology. S. Chand and Company Ltd. New Delhi. pp. 110-112.
Wright, J., 2002. Irrigation scheduling checkbook method. Communication and educational technology services. University of Minnesota, USA.
To share on other social networks, click on any share button. What are these?


