Isolation and In Silico Analysis of OsGLP12-3 Gene’s Promoter from Rice Cultivar Dilrosh-97
Irfan Safdar Durrani*, Noreen Asim and Ammar Sohail
Institute of Biotechnology and Genetic Engineering, The University of Agriculture, Peshawar, Pakistan.
*Correspondence | Irfan Safdar Durrani, Institute of Biotechnology and Genetic Engineering, The University of Agriculture, Peshawar, Pakistan; Email: isdurrani@aup.edu.pk
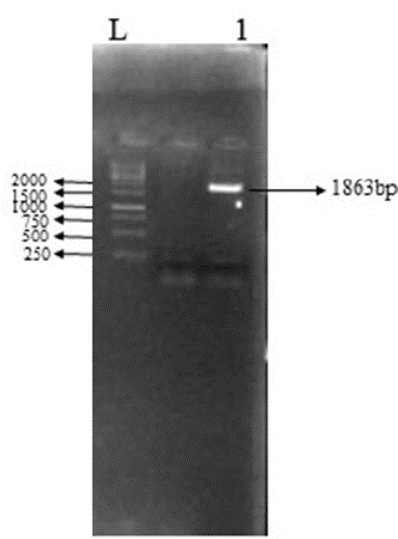
Figure 1:
PCR Amplification of OsGLP12-3 Promoter region from Indica rice cultivar Dilrosh-97.
Lane L indicate 1KB+ DNA Marker and Lane 1 represents the amplified OsGLP12-3 Promoter region from Dilrosh 97.
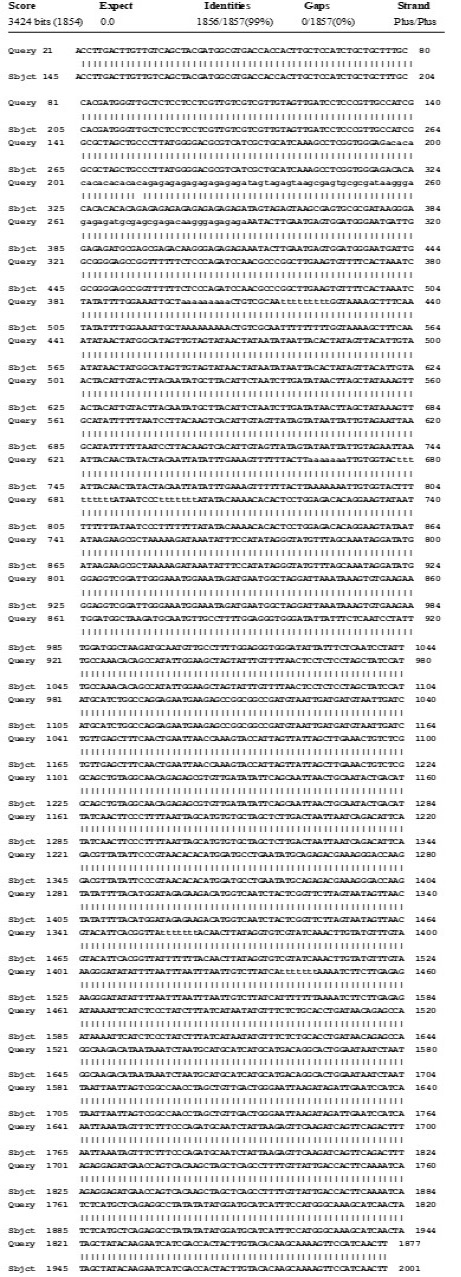
Figure 2:
Pairwise Alignment showing 99% similarity between Nipponbare and Dilrosh-97 OsGLP12-3 promoter sequence.
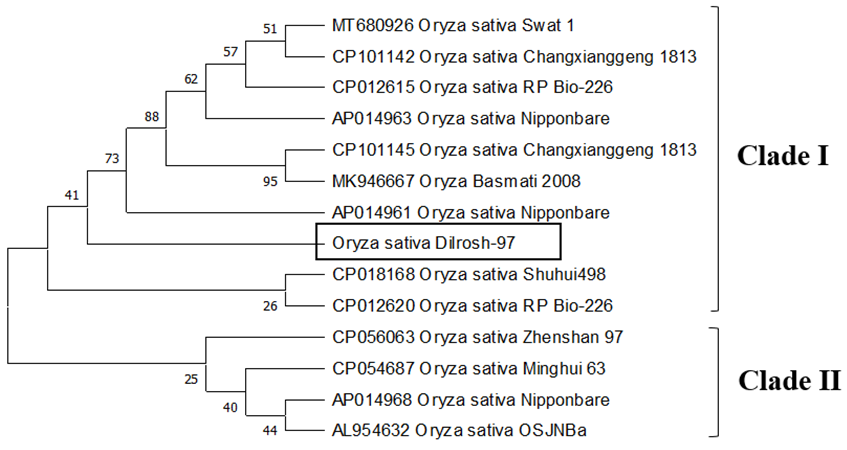
Figure 3:
Phylogenetic tree showing evolutionary relationship between OsGLP12-3 promoter from Dilrosh 97 and other Germin Like Protein Promoters.
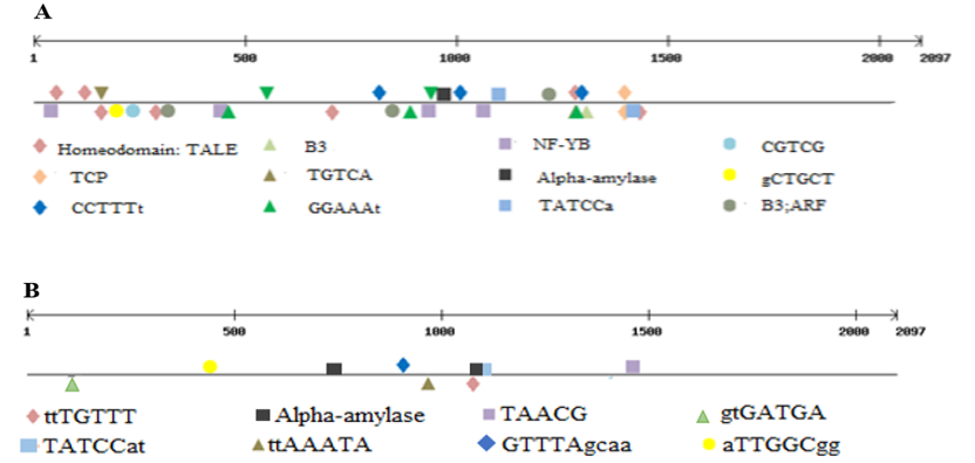
Figure 4:
A, B: Representative map showing distribution and localization of selected transcription factor binding sites within 1.5 Kb OsGLP12-3 promoter region from Nipponbare.
Legend: Upper region of line represents Plus Strand; Lower region of line represents Minus strand.
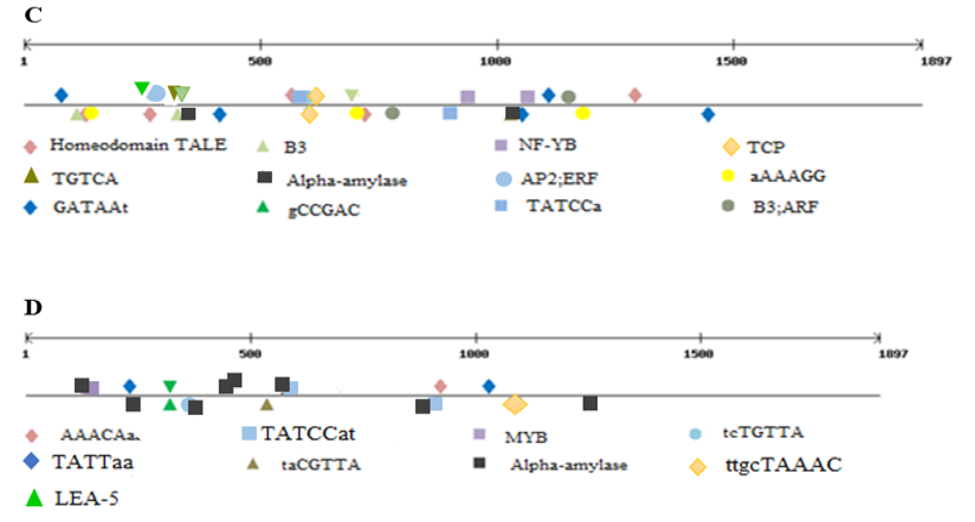
Figure 5:
C, D: Representative map showing distribution and localization of selected transcription factor binding sites within 1.5 Kb OsGLP12-3 promoter region from Dilrosh- 97.
Legend: Upper region of line represents Plus Strand; Lower region of line represents Minus strand.
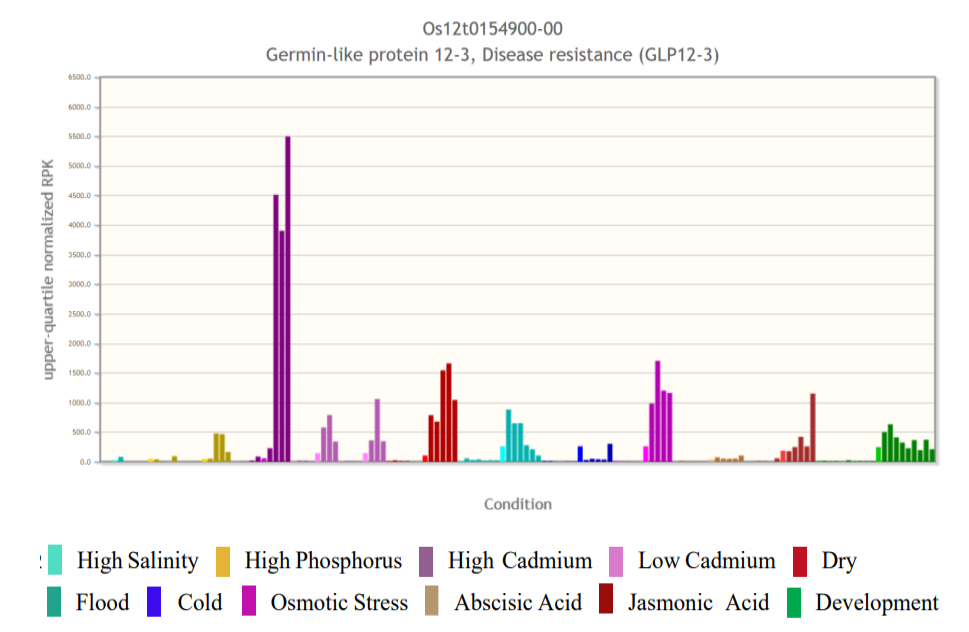
Figure 6:
Expression profile of OsGLP12-3 gene during development and induction by hormones and different stress conditions. Adopted from (Durrani et al., 2019).
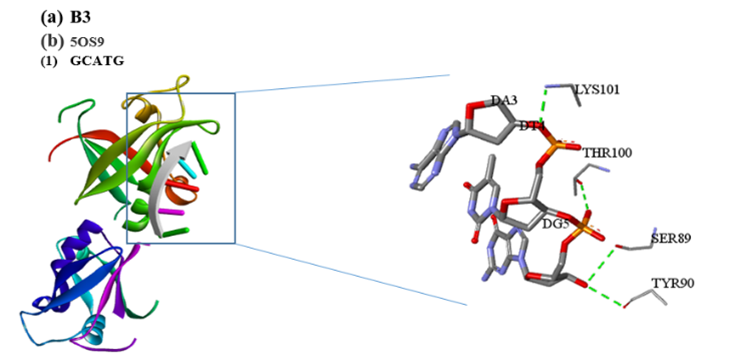
Figure 7:
Interaction between B3 protein (TF) with DNA sequence GCATG.
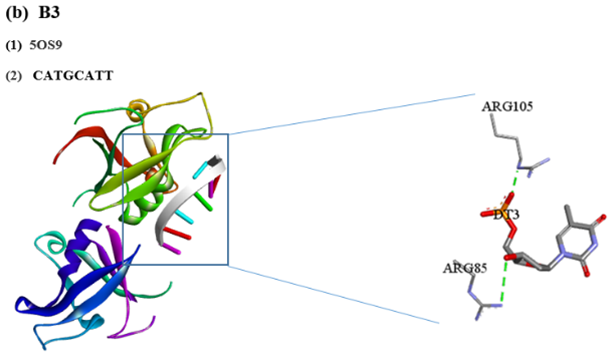
Figure 8:
Interaction between B3 protein (TF) with DNA sequence CATGCATT.
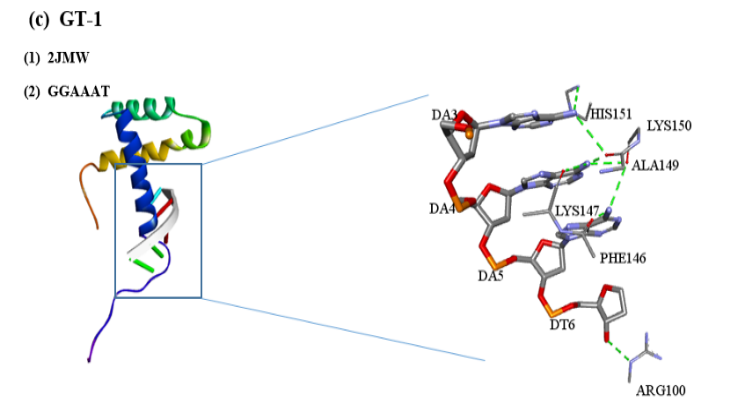
Figure 9:
Interaction between GT-1 protein (TF) with DNA sequence GGAAAt.
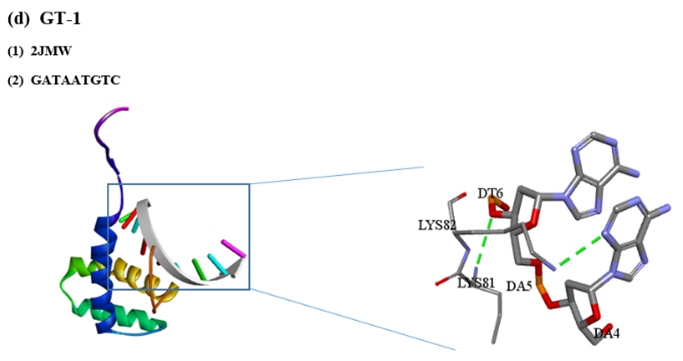
Figure 10:
Interaction between GT-1 protein (TF) with DNA sequence GATAATGTC.
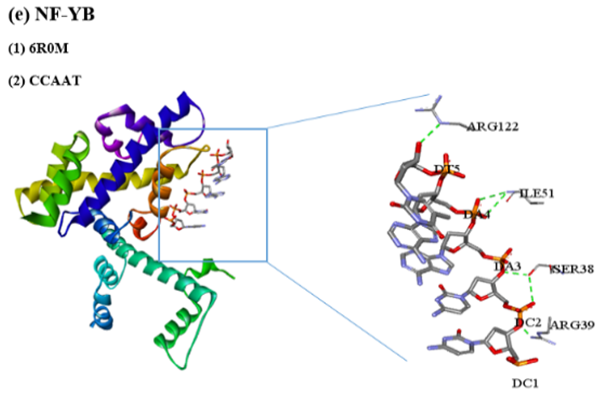
Figure 11:
Interaction between NF-YB protein (TF) with DNA sequence CCAAT.
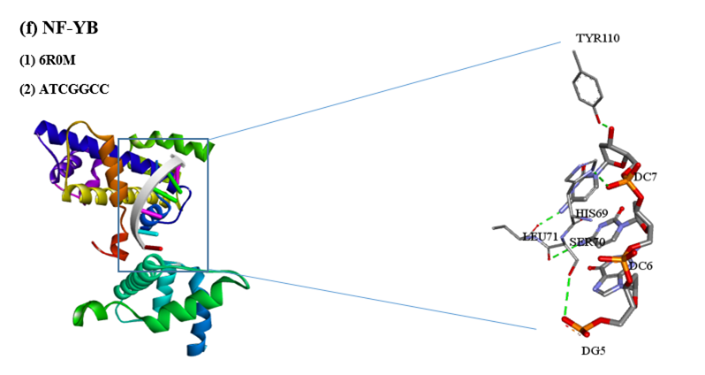
Figure 12:
Interaction between NF-YB protein (TF) with DNA sequence ATCGGCC.


