

Isolation and Biological Characterization of Muscle-Derived Stem Cells from Sheep Skeletal Muscle


Isolation and Biological Characterization of Muscle-Derived Stem Cells from Sheep Skeletal Muscle
Ping Zhang1,2, Yabin Pu1, Yu Zhang2, Jia Chen2, Kunfu Wang3, Qian Li3, Yujiao Sun3, Yuehui Ma1, Shuqing Jiao2,* and Weijun Guan1,*
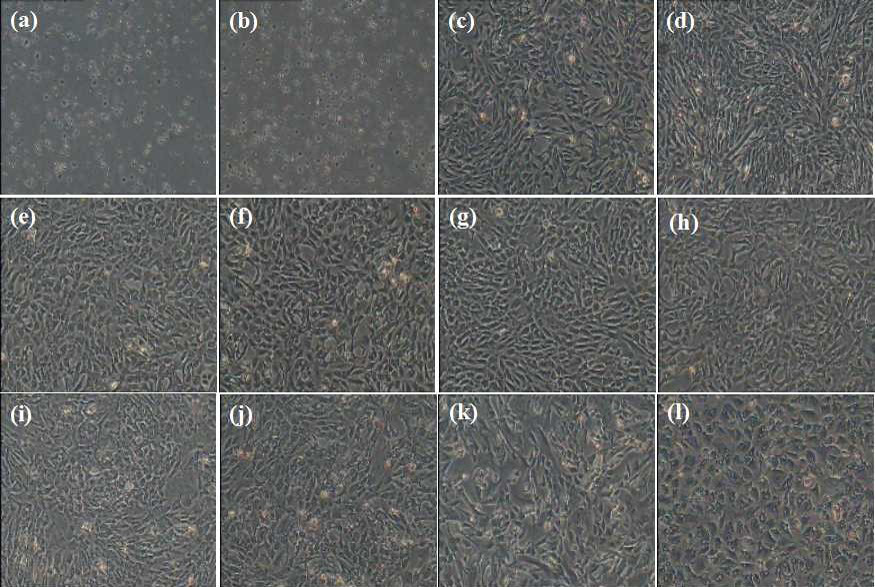
Morphology of muscle-derived stem cells at different stages of their isolation utilizing the preplate technique. MDSCs of first two passages is in homogenous, Afterwards, MDSCs were homogenous and the shape was round and spindle. A, slowly adhering cells are spherical after 1 h; B, slowly adhering cells are spherical after 2 h; C to K, cell morphologies at passage 1, passage 5, passage 10, passage 15, passage 20, passage 25, passage 30, passage 35 and passage 40 before passage (bar = 100μm). (l) Cell morphologies at passage 44 (bar = 100μm).

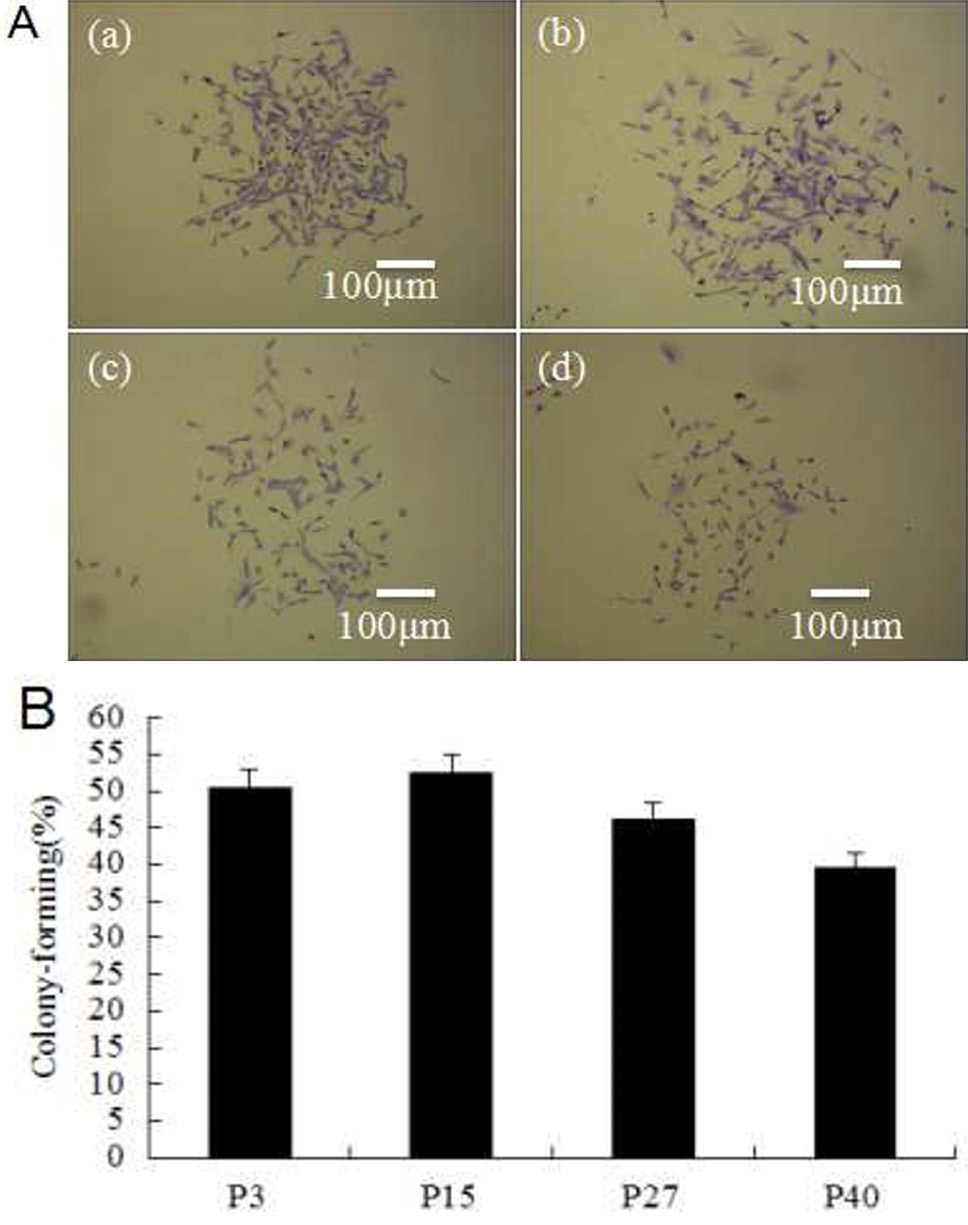
Colony-forming cell assay. A, colony-forming units of P3, P15, P27 and P40 MDSCs were counted, which indicated that colony-forming rates de-creased but did not disappear with increasing passage number. a to d, colony-forming rates of P3, P15, P27 and P40, respectively; B, the bar chart of colony-forming rates for different passages of MDSCs.

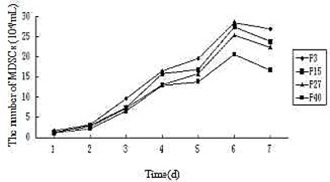
Growth curves of the MDSCs. The growth curve of MDSCs appeared an typical “S” shape and the population doubling time (PDT) were 28.62 h, 35.85 h, 34.39 h and 43.34 h for passage 3, passage 15, passage 27 and passage 40, respectively on the base of the growth curve.

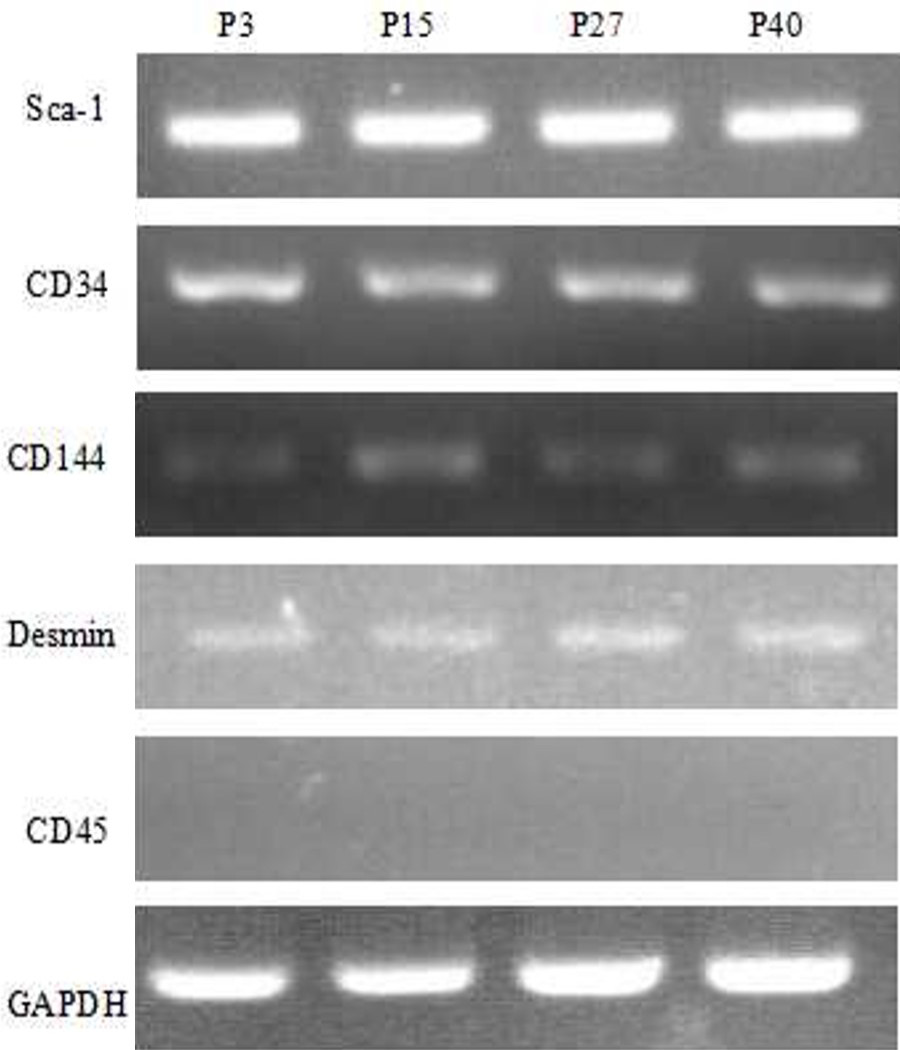
Detection of MDSCs markers by RT-PCR. The RT-PCR results show that Sca-1, CD34, CD144, and Desmin of P3, P15, P27, P40 MDSCs were positively expressed, the CD45 was negative in the four passages. GAPDH served as the internal control.

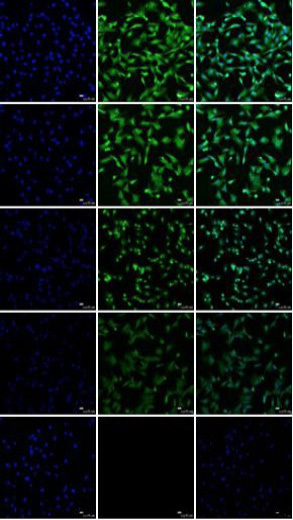
Detection of MDSCs markers by immunofluorescence staining. The immunofluorescence staining results show that Sca-1, CD34, CD144 and Desmin were positively expressed, the CD45 was negative. a, d, g, j and m, blue staining represents DAPI counterstain of DMS/PCs nuclei; b, Sca-1+; e, CD34+; h, CD144+; k, CD73+; n, CD45-; c, f, i, l and o, merge (bar=25μm).

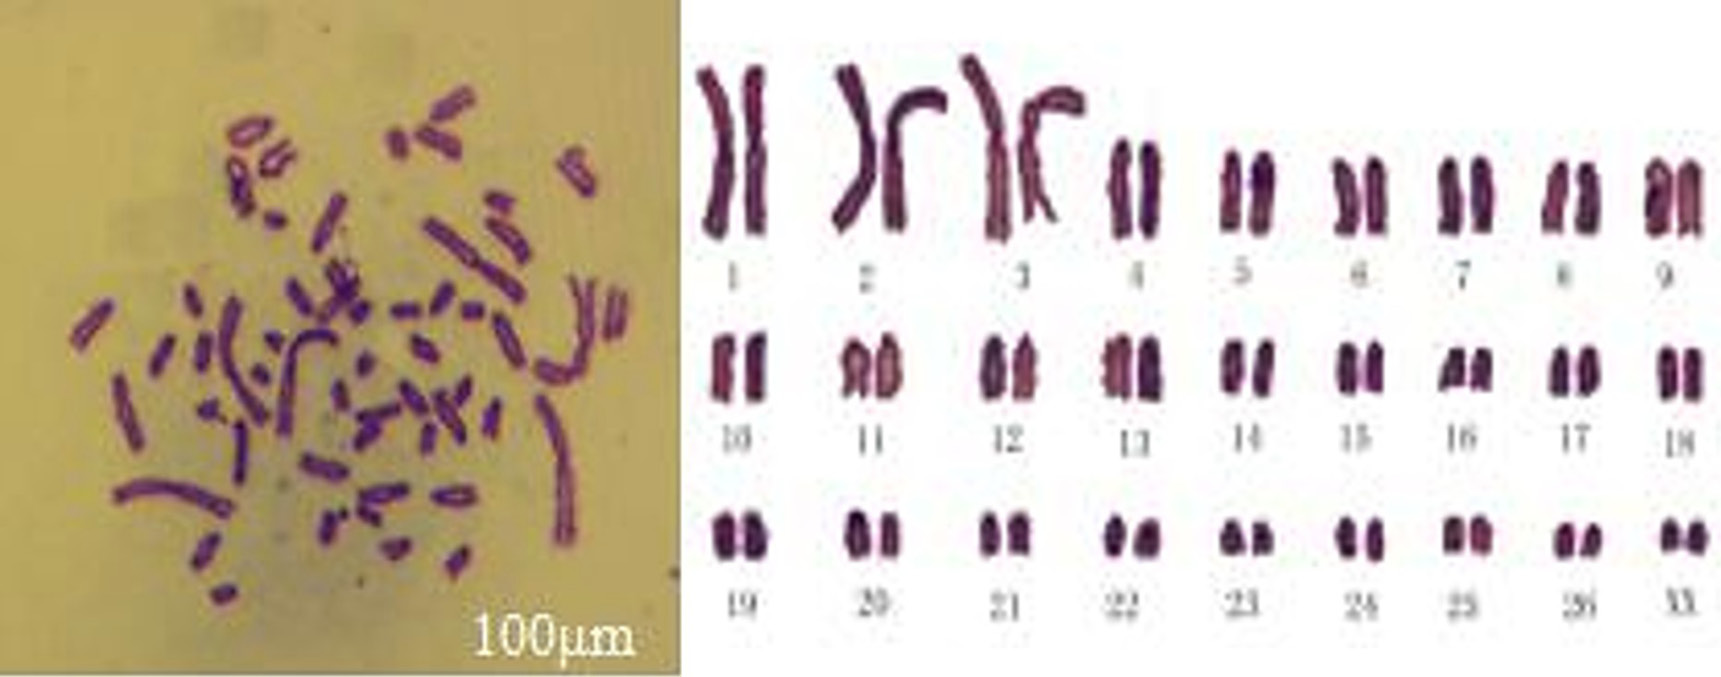
Karyotype analysis of MDSCs. Passage 27 cell chromosomes at metaphase (left) and karyotype (right) of MDSCs. The chromosome number of sheep was 2n=54, including 26 pairs of euchromosomes and one pair of sex chromosomes, XX (bar=100μm).

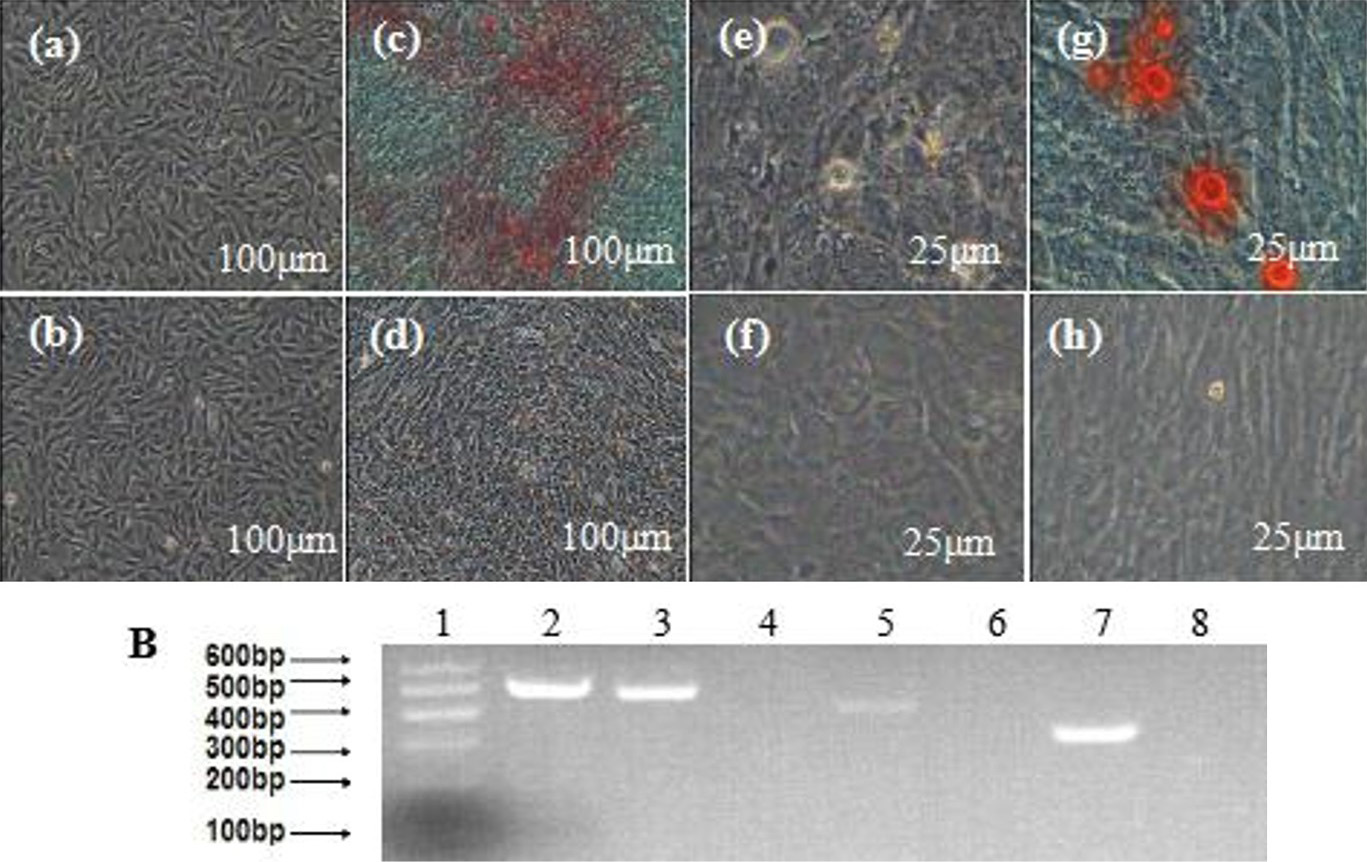
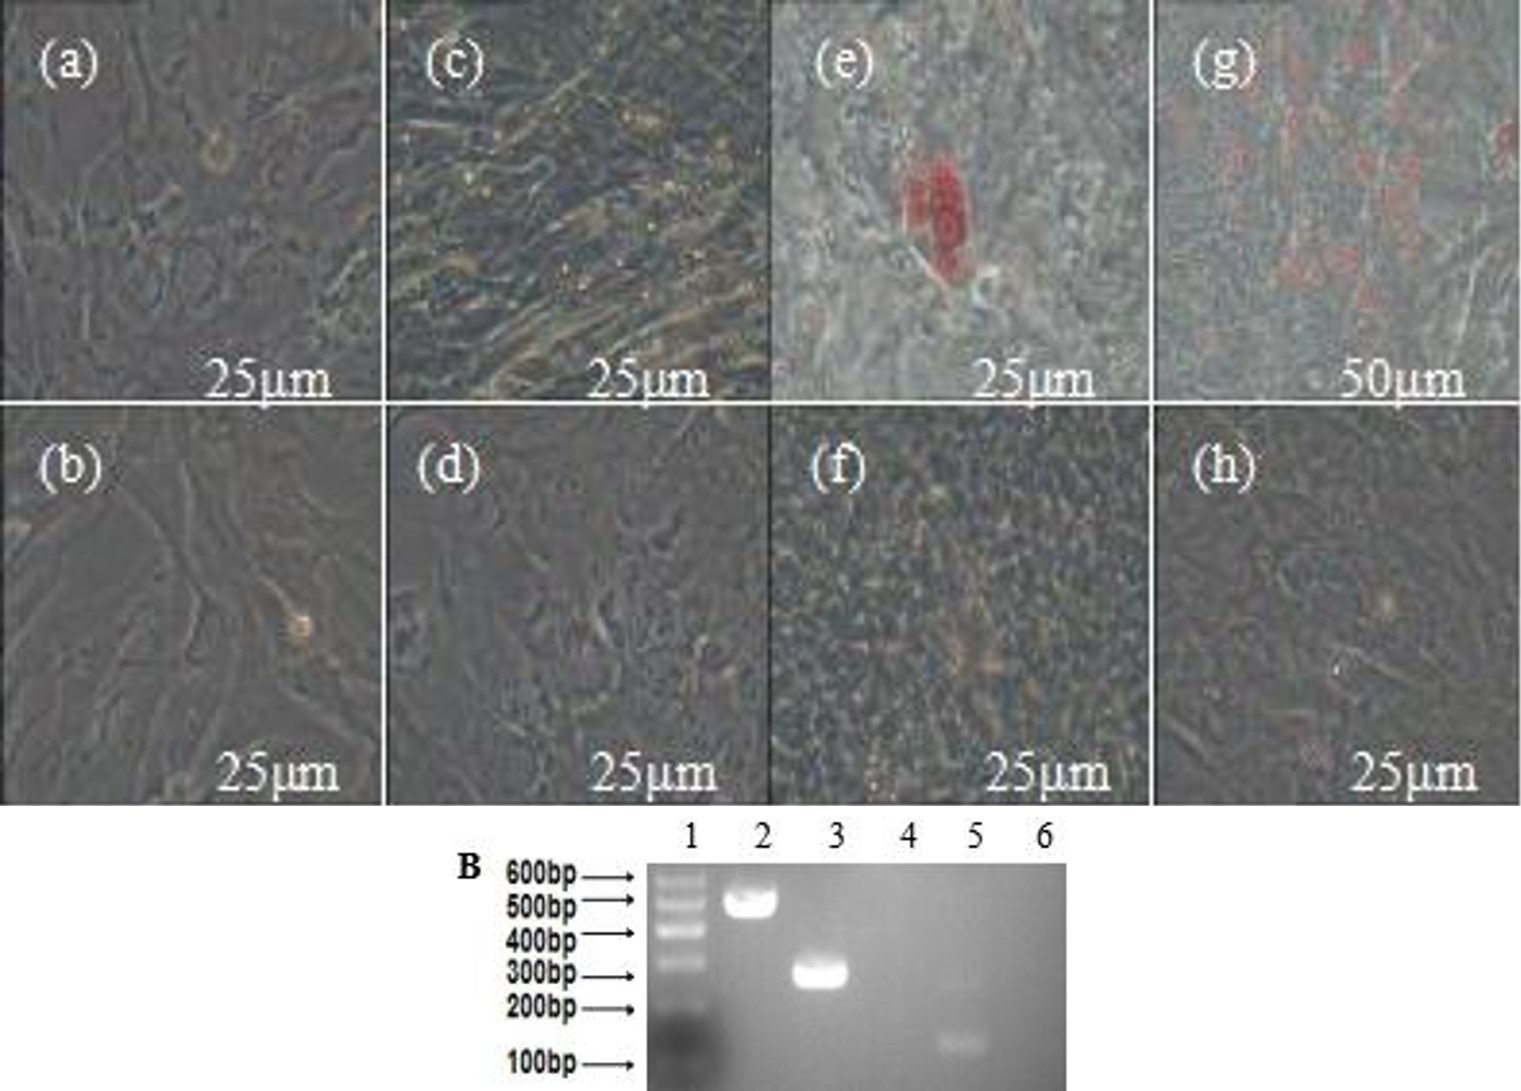
Adipogenic differentiation of MDSCs. A (a and b), the cell wasn’t induced of the induced group and the control group; d, f and h, the control group of adipogenic differentiation, after 1 d, 7 d and 14 d, and were also negative for oil red O staining; c, MDSCs induced in the inducing culture medium after 7 d, and many intracellular lipid droplets were present in the induced cells; e and g, After 14 d, the cells of induced group were positive for oil red O staining (bar=25μm). B, RT-PCR detection of the adipogenic markers LPL and PPAR-γ expression. 1, marker; 2, GAPDH; 3, LPL+; 4, LPL- (MDSCs); 5, PPAR-γ+; 6, PPAR-γ- (MDSCs).
Osteogenic differentiation of MDSCs. A (a and b), the cell before was induced of the induced group and the control group; d, f and h, the control group of osteogenic differentiation, after 1d, 7d, and 14d, and were also negative for alizarin red staining; c, the induced group of osteogenic differentiation. After induction for 14 days, the cells became confluent and formed mineralized nodules and alizarin red staining was positive(bar=100μm); e and g, the cells before and after of induced group, the alizarin red staining was positive (bar=25μm). B, RT-PCR detection of the osteogenic markers OPN, ALP and COLI expression. 1, marker; 2, GAPDH; 3, OPN+; 4, OPN- (MDSCs); 5, ALP+; 6, ALP- (MDSCs); 7, COLI+; 8, COLI- (MDSCs).
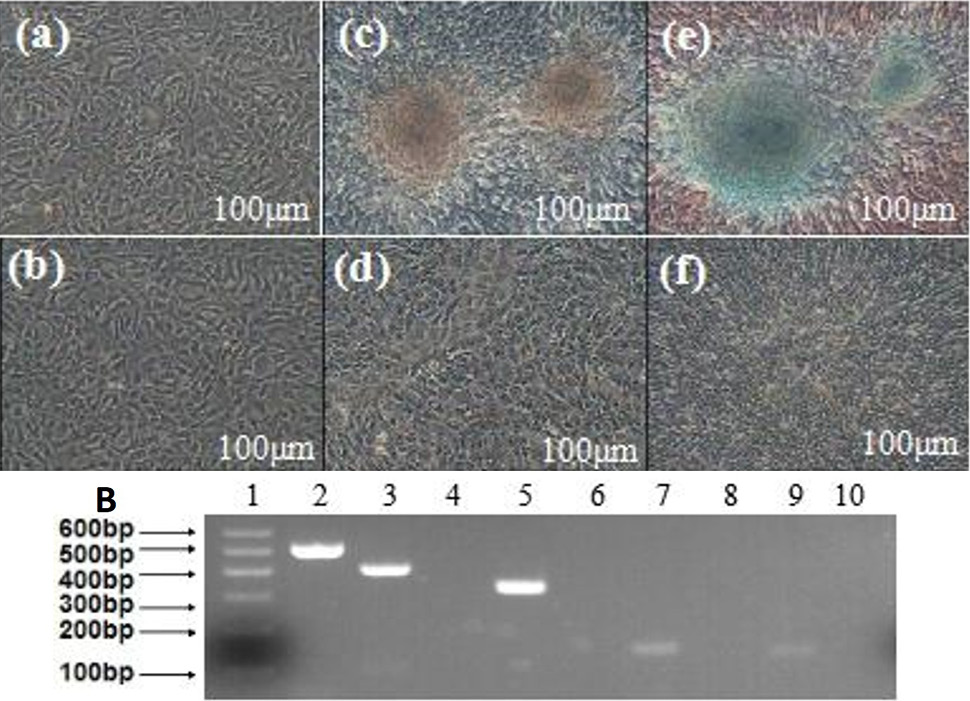
Cartilaginous differentiation of MDSCs. A (b, d, and f), the control group of cartilaginous differentiation, and were also negative for Alcian blue staining; a, after 1d, MDSCs in the induced group had no difference in the morphology and phenotype; c, the induced group of cartilaginous differentiation. After induction for three weeks, the cells became compressed; e, the cells of induced group were positive for Alcian blue staining (bar=100μm). B (1), marker; 2, GAPDH; 3, COLII+; 4, COLII- (MDSCs); 5, SOX9+; 6, SOX9- (MDSCs); 7, COL-X+; 8, COL-X- (MDSCs); 9, aggrecan+; 10, aggrecan- (MDSCs).
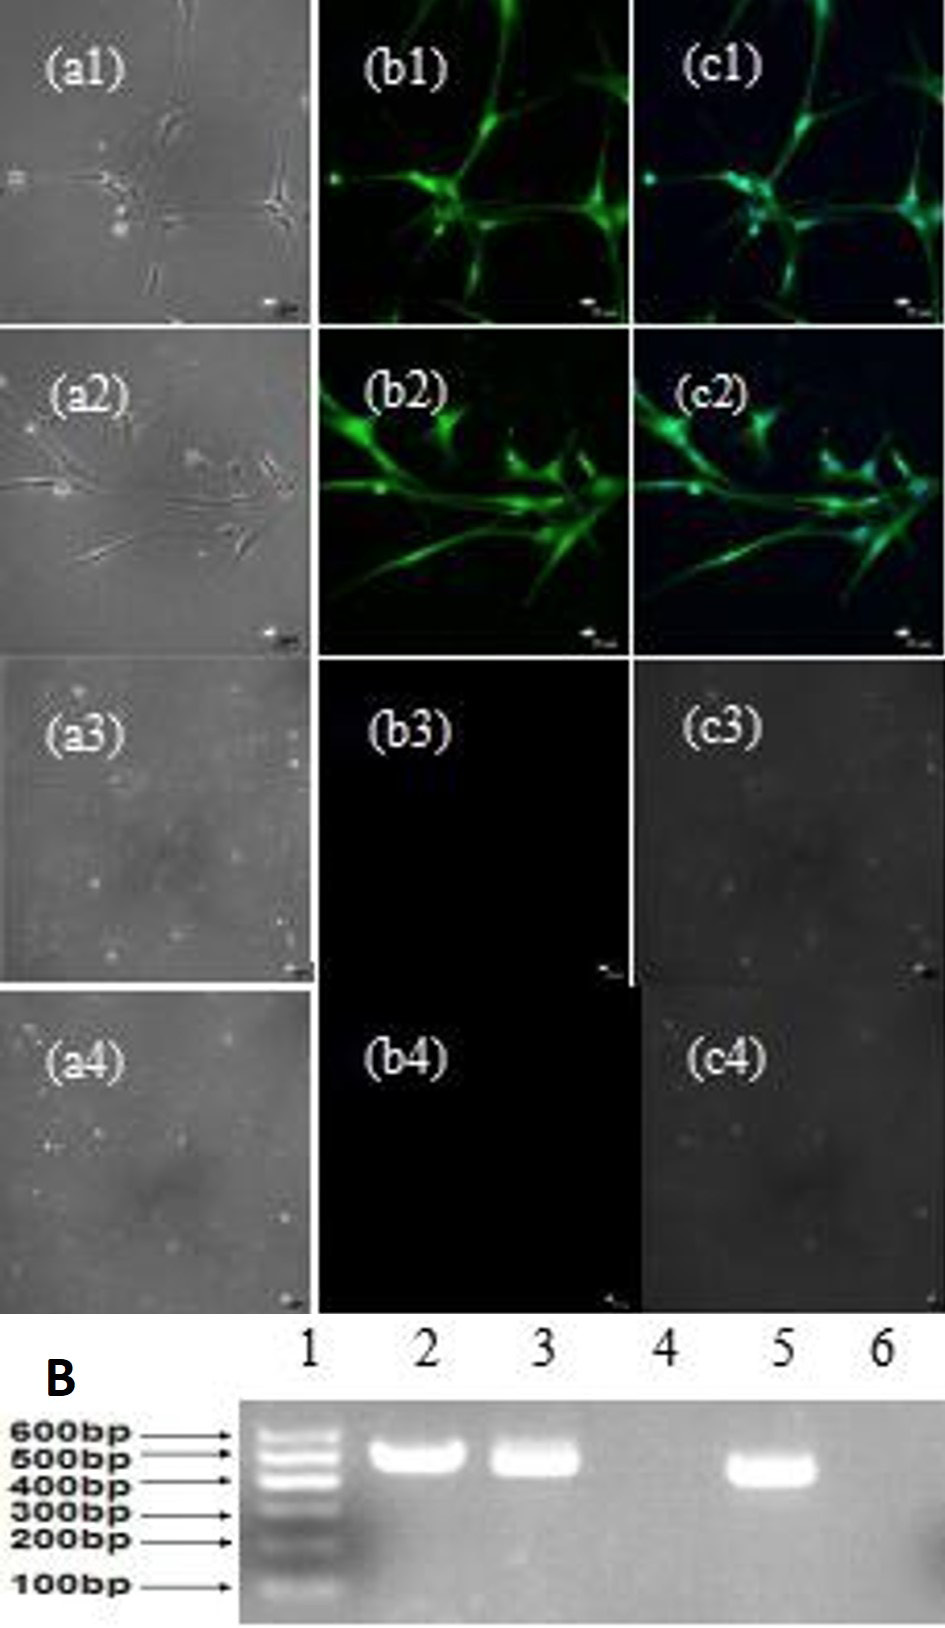
Neuron-like cell differentiation of MDSCs. A, neuron-like cells morphology and identification of MDSCs by immunofluorescent labeling; a1, a2, a3 and a4, phase contrast; b1, b2, b3 and b4, NSE+, NF+, NSE-, NF-; c1, c2, c3 and c4, merge (bar=25μm). B (1), marker; 2, GAPDH; 3, NSE+; 4, NSE- (MDSCs); 5, NF+; 6, NF- (MDSCs).


