
Investigating-the-Correlation-Between-Body-Mass-Index-and-Insulin-Resistance-among-Women-Diagnosed-with-Gestational-Diabetes


Investigating-the-Correlation-Between-Body-Mass-Index-and-Insulin-Resistance-among-Women-Diagnosed-with-Gestational-Diabetes
Ahmed J. Jaafer1*, Alaa K. Jassim1, Nidhal A. Hashim2
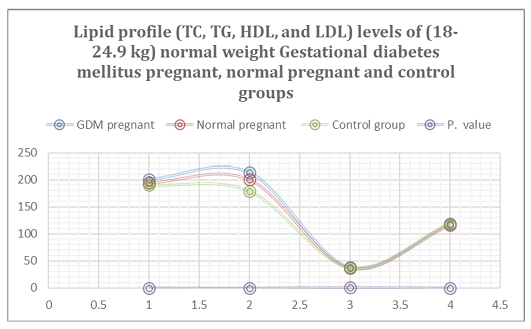
The difference in the lipid profile levels of (18-24.9 kg) normal weight Gestational diabetes mellitus pregnant, normal pregnant and control groups.
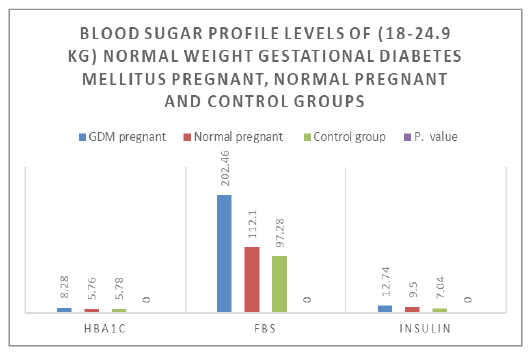
The difference in the blood sugar profile of (18-24.9 kg) normal weight Gestational diabetes mellitus pregnant, normal pregnant and control groups
The difference in the blood sugar profile of (18-24.9 kg) normal weight Gestational diabetes mellitus pregnant, normal pregnant and control groups
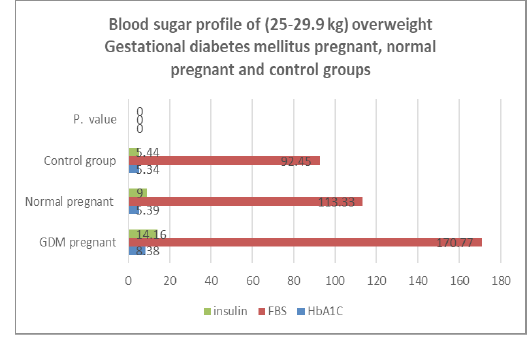
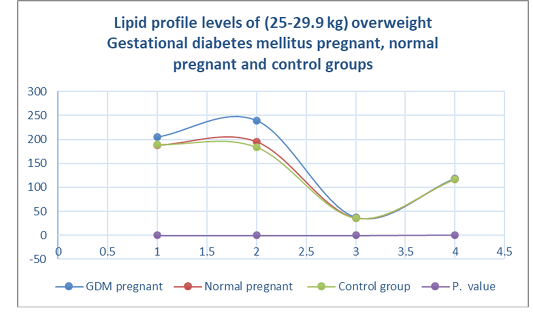
The difference in the blood sugar profile of (25-29.9 kg) overweight Gestational diabetes mellitus pregnant, normal pregnant and control groups
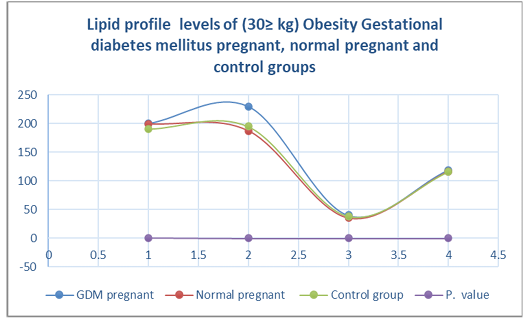
The difference in the Lipid profile of (30≥ kg) Obesity Gestational diabetes mellitus pregnant, normal pregnant and control groups
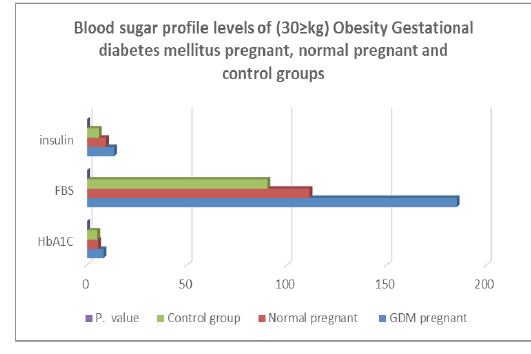
The difference in the blood sugar profile of (30≥kg) Obesity Gestational diabetes mellitus pregnant, normal pregnant and control groups


