
Insights into Curcumin-Selenium Nanoparticles in Modulating Hormonal Levels and Promoting PTEN Gene Expression in Doxorubicin Treated Rats


Insights into Curcumin-Selenium Nanoparticles in Modulating Hormonal Levels and Promoting PTEN Gene Expression in Doxorubicin Treated Rats
Rawya Sh. Mohammed*, Baraa N. Al-Okaily

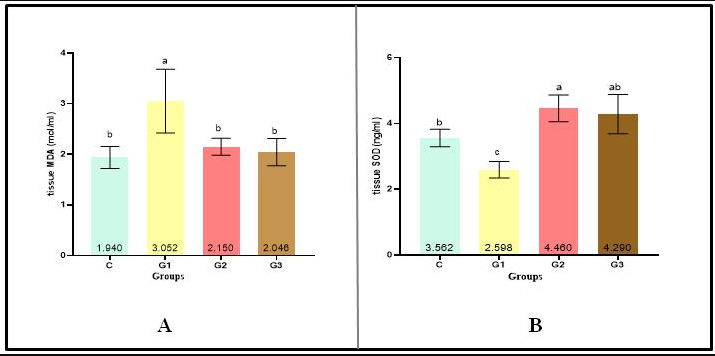
Effect of CurSeNPs, doxorubicin and both on (A) tissue MDA and (B) tissue SOD in adult female rats after 14 days.
Values are expressed as mean ± SD, n=5. C= Control group. G1 = Injected with i/p doxorubicin 4.40 mg /kg. B.W. G2 = Administrated with CurSeNPs 10.47 μg / kg B.W orally. G3 = Administrated with CurSeNPs 10.47 μg / kg B.W orally and with doxorubicin 4.40 mg/ kg B.W i/p. Different small letters present on bars indicate significant differences between groups at P<0.05.
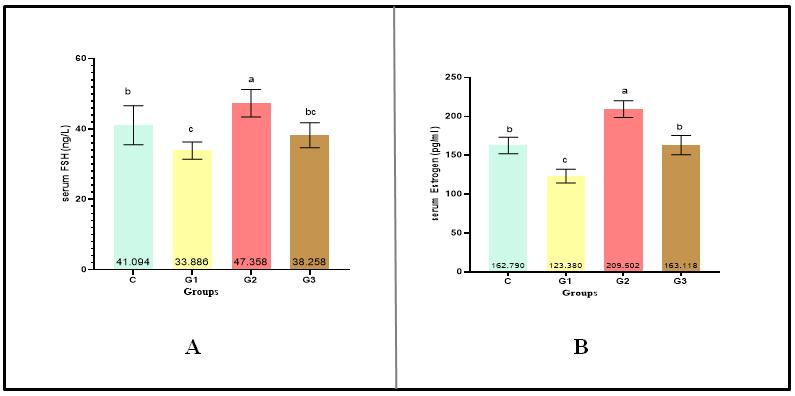
Effect of CurSeNPs, doxorubicin and both on (A) serum FSH and (B) serum estrogen in adult female rats after 14 days.
Values are expressed as mean ± SD, n=5. C= Control group. G1 = Injected with i/p doxorubicin 4.40 mg /kg. B.W. G2 = Administrated with CurSeNPs 10.47 μg / kg B.W orally. G3 = Administrated with CurSeNPs 10.47 μg / kg B.W orally and with doxorubicin 4.40 mg/ kg B.W i/p. Different small letters present on bars indicate significant differences between groups at P<0.05.
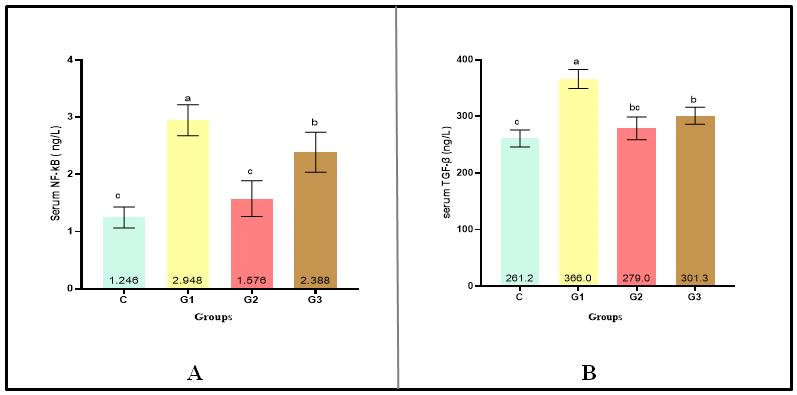
Effect of CurSeNPs, doxorubicin and both on (A) serum NF-κB and (B) serum TGF-β in adult female rats after 14 days.
Values are expressed as mean ± SD, n=5. C= Control group. G1 = Injected with i/p doxorubicin 4.40 mg /kg. B.W. G2 = Administrated with CurSeNPs 10.47 μg / kg B.W orally. G3 = Administrated with CurSeNPs 10.47 μg / kg B.W orally and with doxorubicin 4.40 mg/ kg B.W i/p. Different small letters present on bars indicate significant differences between groups at P<0.05.
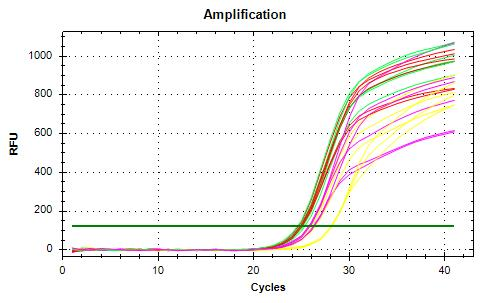
The real-time amplification plots of PTEN gene expression of ovarian tissue in rats experimental samples. The purple plots (control group), green plots (G1 group), red plots (G2 group), yellow plots (G3 group).
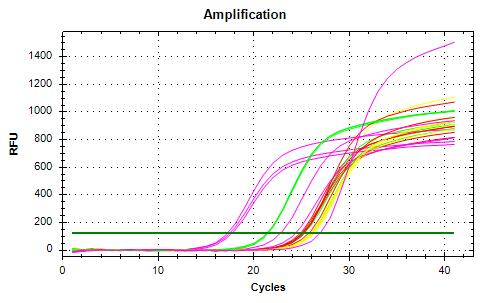
The real-time amplification plots of housekeeping (GAPDH) gene expression of ovarian tissue in rats experimental samples. The purple plots (control group), green plots (G1 group), red plots (G2 group), yellow plots (G3 group).
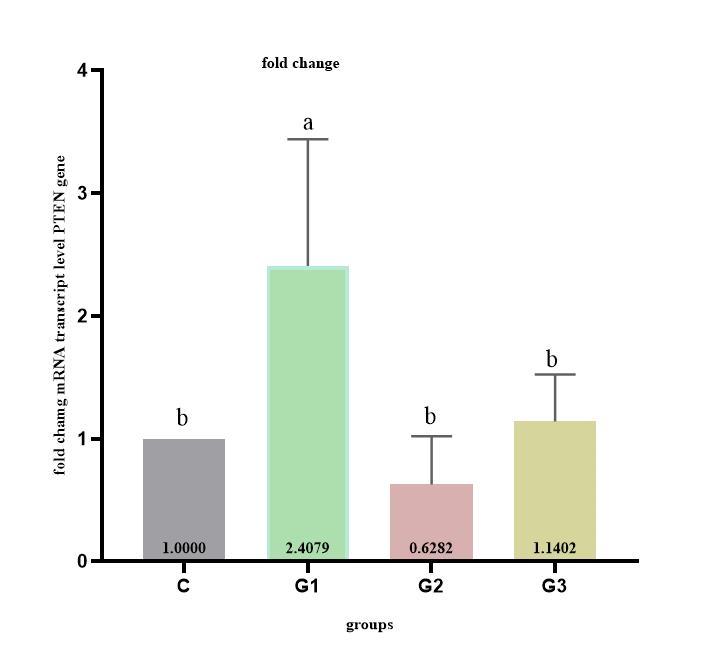
Assessment of PTEN gene expression in ovarian tissues of rats treated with CurSeNPs, doxorubicin and both after 14 days.
Values are expressed as mean ± SD, n=5. C= Control group. G1 = Injected with i/p doxorubicin 4.40 mg /kg. B.W. G2 = Administrated with CurSeNPs 10.47 μg / kg B.W orally. G3 = Administrated with CurSeNPs 10.47 μg / kg B.W orally and with doxorubicin 4.40 mg/ kg B.W i/p. Different small letters present on bars indicate significant differences between groups at P<0.05.

