

Influence of Varying Dietary Cation-Anion Difference on Blood Metabolites of Holstein Dairy Cows


Influence of Varying Dietary Cation-Anion Difference on Blood Metabolites of Holstein Dairy Cows
Hazem E. M. Hassanien1*, Awad M. M. Mahmoud2, Elsayed M. Abdel-Raouf1, Nabil M. Eweedah1 and Midhat. N. Nassif3
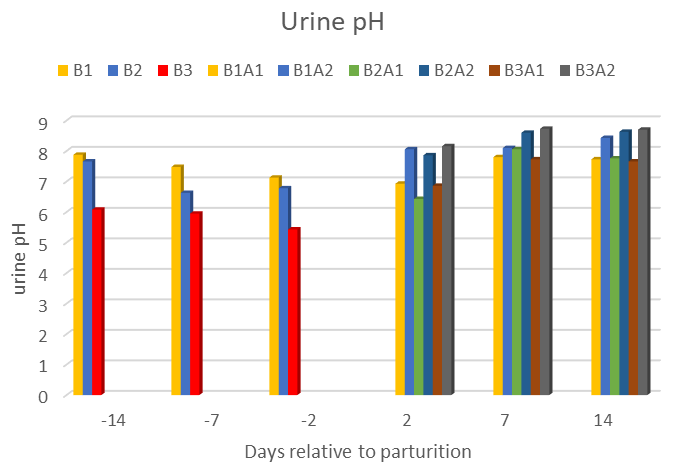
Urine pH (Means±SE) for cows fed prepartum DCAD (Tr1) 0.0, -100, -180 (BC1, BC2, BC3) and postpartum DCAD (Tr2) +250 and +350 (AC1, AC2) showing effect of interaction (BC1AC1, BC1AC2, BC2AC1, BC2AC2, BC3AC1, BC3AC2), there is effect of prepartum DCAD (Tr1) between means for cows fed 0.0, -100, -180 (7.5, 7.02 and 5.82), P < 0.005, there is effect of time sample -2, -7 ( 6.45 and 6.68) and -14 (7.21) P < 0.05 and the interaction Tr1 x T, P = 0.247. postpartum there is effect of treatment Tr2 x T time of sample at 14, 7 urine pH (8.15 and 8.17), 2 days after calving pH (7.38), P> 0.05, also there is interaction after calving Tr1 x T time of sample p. 0.05 but there is no interaction after calving from Tr1 x Tr2 x T, P = 0.690.

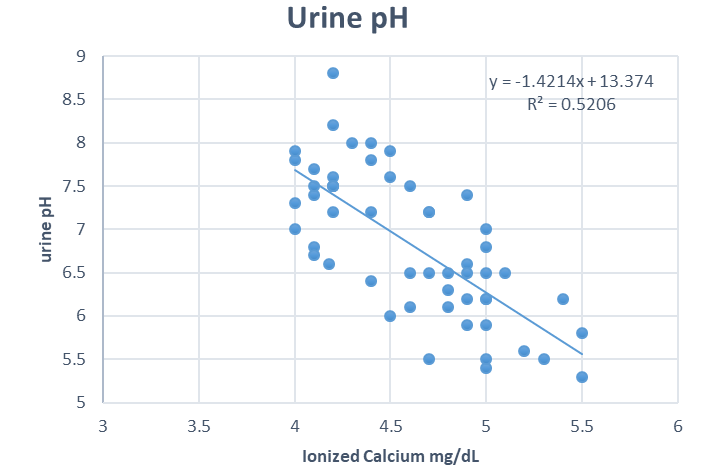
Simple linear regression and negative linear correlation between urine pH and iCa (R = -0.74, R2 = 0.548) urine pH = (14.2 + -1.61*iCa) for cows fed prepartum (Tr1) DCAD (0.0, -100, -180) there is negative linear relationship urine pH and iCa p < 0.05.
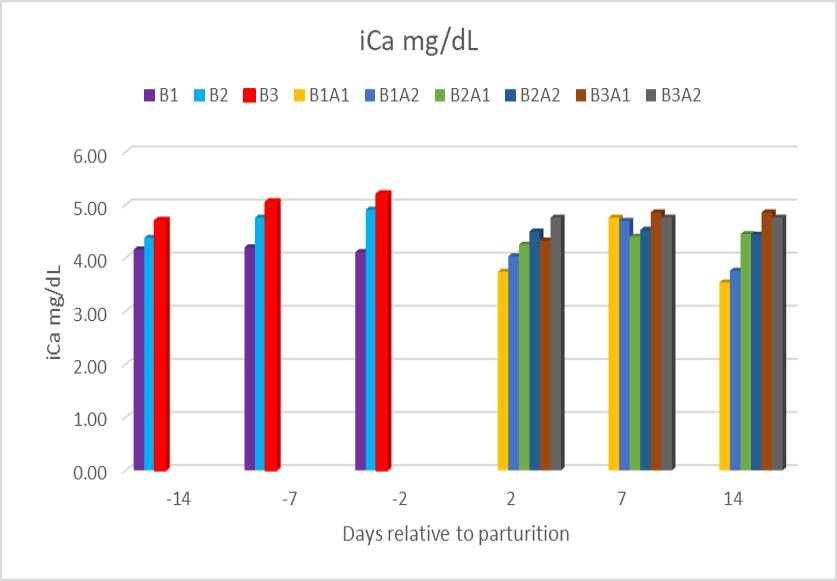
Means serum iCa concentrations for cows fed prepartum and effect of Tr1 DCAD 0.0, -100, -180 (BC1, BC2, BC3. P < 0.001) and effect of postpartum Tr2 DCAD +250 and +350 (B1A1, B1A2, B2A1, B2A2, B3A1, B3A2. P = 0.511), day P < 0.001 and interaction Tr1 x Tr2 x day P = 0.510, during experimental period.

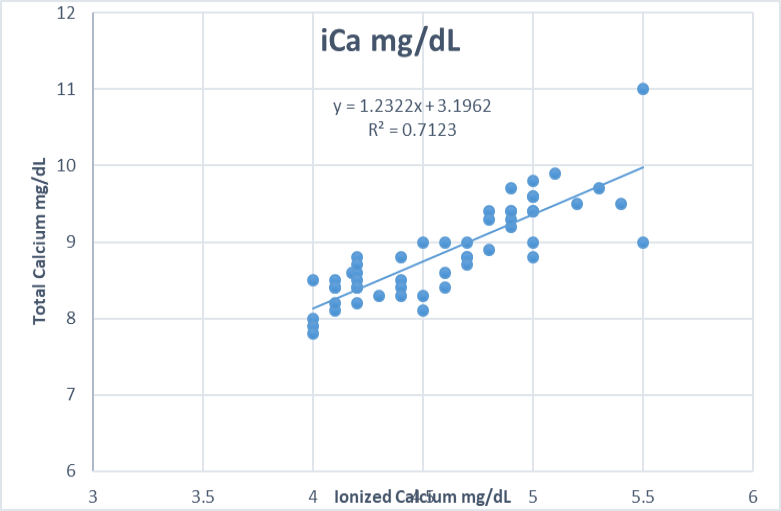
Simple linear regression and positive correlation between tCa and iCa (R = 0.84, R2 = 0.712 P < 0.001) tCa = 3.2 + 1.23*iCa for cows fed prepartum (Tr1) DCAD (0.0, -100, -180) there is positive linear relationship tCa and iCa p < 0.05.
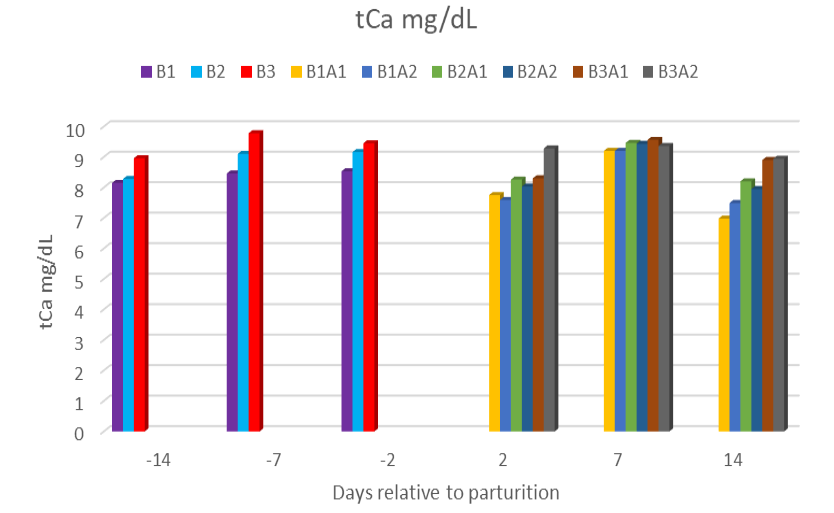
Means of tCa concentrations for cows fed prepartum and effect of (Tr1) DCAD 0.0, -100, -180 (BC1, BC2, BC3. P < 0.001) and effect of postpartum (Tr2) DCAD +250 and +350 (B1A1, B1A2, B2A1, B2A2, B3A1, B3A2. P = 0.511), day P < 0.001 and interaction Tr1 x Tr2 x day P = 0.086, during experimental period.


