
In vitro Antihelminthic Activities of Artocarpus heterophyllus (Jackfruit) and Artocarpus camansi (Breadnut) Leaf Extracts on the Model Nematode, Caenorhabditis elegans

In vitro Antihelminthic Activities of Artocarpus heterophyllus (Jackfruit) and Artocarpus camansi (Breadnut) Leaf Extracts on the Model Nematode, Caenorhabditis elegans
Estrelle Anne Tacbas1, Neil Pep Dave Sumaya2 and Nanette Hope Sumaya1,3*
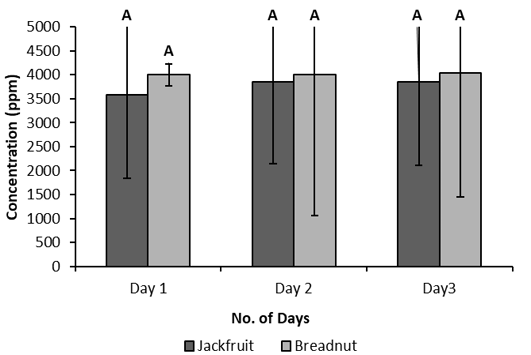
LC50 of Artocarpus heterophyllus and Artocarpus camansi from day 1 to day 3. The darker bar indicates the mean concentration of LC50 for the A. heterophyllus and the lighter bar for A. camansi with their standard error mean. The same letters above the bars denotes no statistical significant difference (P>0.860) between the two by one-way ANOVA with Tukey-Kramer HSD multiple comparisons.
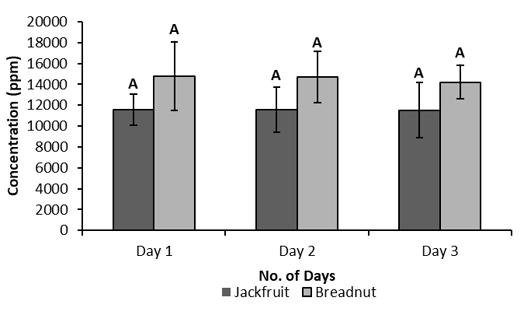
LC90 of Artocarpus heterophyllus and Artocarpus camansi from day 1 to day 3. The darker bar indicates the mean concentration of LC50 for the A. heterophyllus and the lighter bar for A. camansi with their standard error mean. The letters above the bars denote no statistical difference (P>0.096) between the two by one-way ANOVA with Tukey-Kramer HSD multiple comparisons.
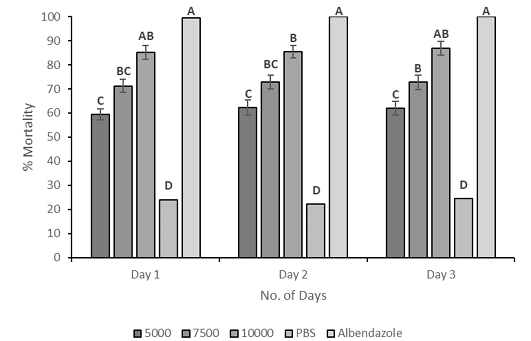
Mortality of Caenorhabditis elegans larvae (L4) treated with Artocarpus heterophyllus extract, observed from day 1 to 3. Each bar denotes the percent mortality of the nematodes in each concentration with standard error mean. The differing letters above the bars indicate statistically significant (P<0.0001) differences between concentrations and contrary for the bars with the same letters.
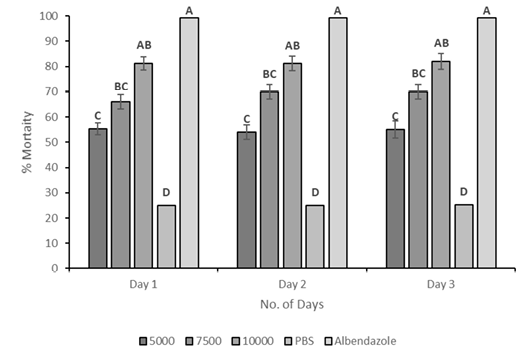
Mortality of Caenorhabditis elegans larvae (L4) treated with Artocarpus camansi extract, observed from day 1 to 3. Each bar denotes the percent mortality of the nematodes in each concentration with standard error mean. The differing letters above the bars denotes statistically significant (P<0.0001) differences between concentrations and contrary for the bars with the same letters.
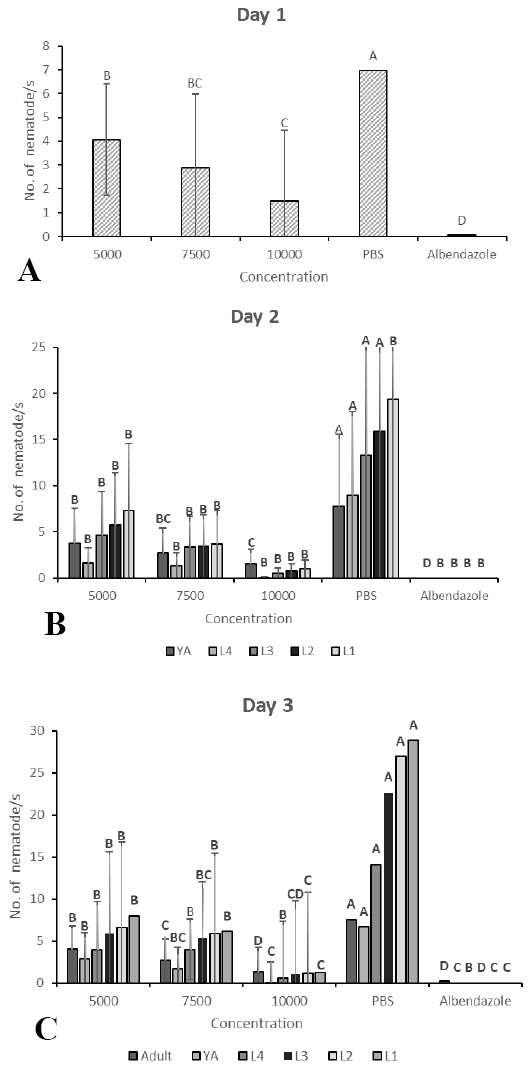
Number of surviving nematodes showing delay in development treated with Artocarpus heterophyllus extract. A, shows the development of L4 nematodes after exposure to the extract within 24 hours (day 1). B, shows the resumption of the development of L4 nematodes progressing to young adult (48 hours/day 2) and C, to fully developed adult (72 hours/day 3) together with other nematodes of different larval stages also developing to higher stages. Each bar denotes the mean number of the developmental stages in each concentration with standard error mean. Different letters above the bars denote statistically significant differences between concentrations and contrary for the bars with the same letters.
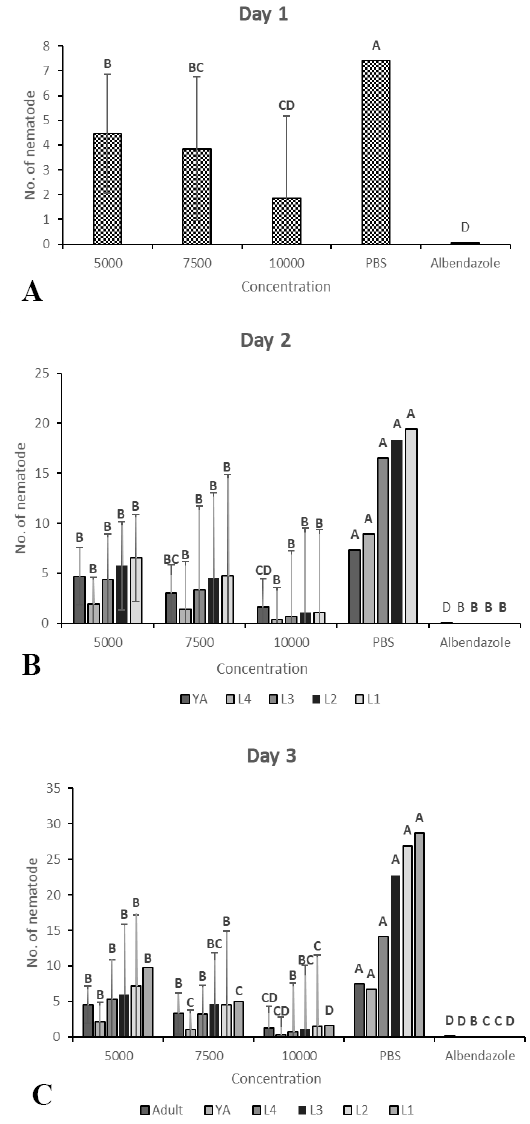
Number of surviving nematodes showing delay in development treated with Artocarpus camansi extract. A, shows the development of L4 nematodes after exposure to the extract within 24 hours (day 1). B shows the resumption of the development of L4 nematodes progressing to young adult (48 hours/day 2) and C, to fully developed adult (72 hours/day 3) together with other nematodes of different larval stages also developing to higher stages. Each bar denotes the mean number of the developmental stages in each concentration with standard error mean. Different letters above the bars denote statistically significant differences between concentrations and contrary for the bars with the same letters.

